

Twenty-nine reef sites were surveyed over the course of two weeks between April and May of 2013. Three major island/atolls were visited: Rarotonga, Aitutaki, and Palmerston (see maps on the respective pages.). For high resolution maps, please go here. For most reef coral data analyses, the data from the Cook Islands samples found on the following pages were analyzed in conjunction with those of the Austral Islands of French Polynesia given that we visited both nations during the same time period.
1. Details of the research cruise, which was part of the Living Ocean Foundation's Global Reef Expedition, can be found in the field report.
2. For environmental data, including GPS coordinates, site temperatures and salinities, as well as reef types, please consult this spreadsheet.
3. For details on the pocilloporid corals sampled (n=60), please see the associated manuscript (Mayfield et al. 2015, Platax). For details of the nucleic acid and protein extraction protocol, click here.
4. A second manuscript (Mayfield et al. 2016, Platax) presents the molecular physiological analysis of a subset of ~60 samples. The raw data associated with this manuscript can be found here. I have also posted individual JMP files (organized various ways) on the main Austral Islands page.
5. To see the partial mitochondrial genomes used to genotype the samples, please see this Sequin file.
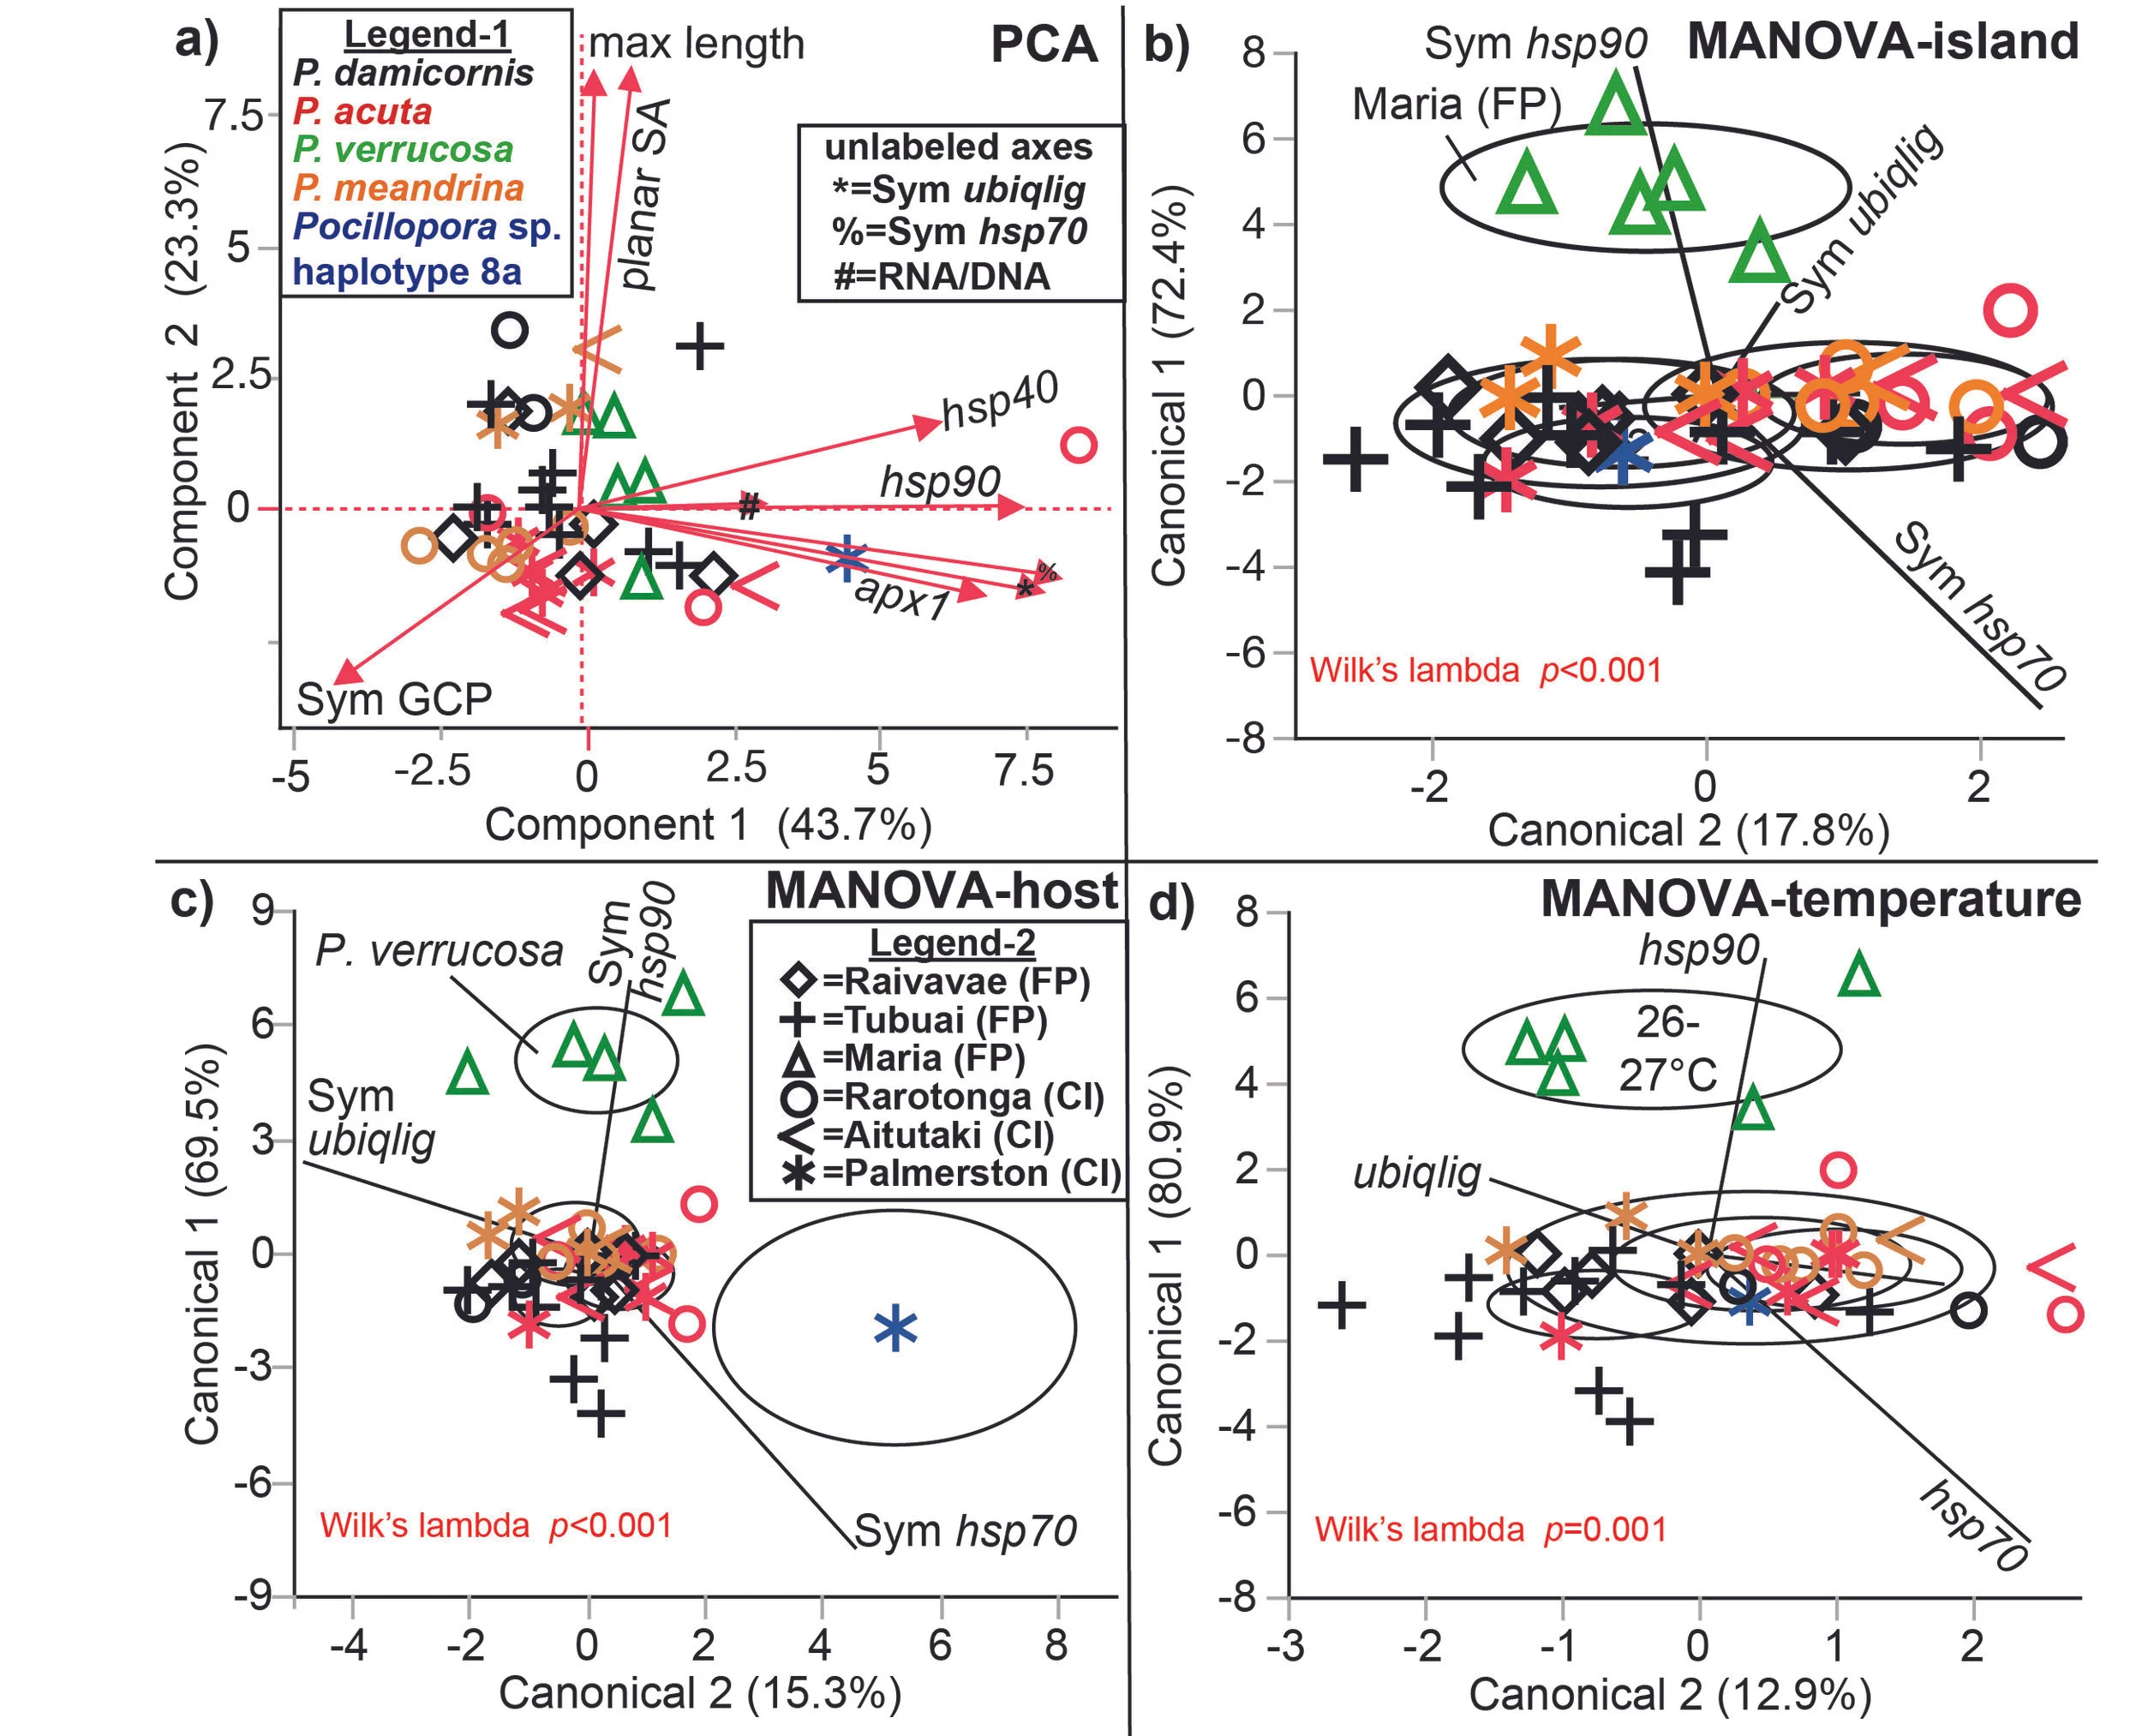
Principal components analysis (panel A) and canonical correlation analysis (CCA; labels b-d) of the Austral Islands+Cook Islands dataset. Red icons=Pocillopora acuta. Black icons=P. damicornis. Green icons=P. verrucosa. Orange icons=P. meandrina. Circles represent 95% confidence. See the associated manuscript (Mayfield et al. 2016, Platax) for details.
6. A deeper dive into the data can be found in this article.
7. For an Apple Photos library, please click here.
On the pages for the respective islands visited, I have posted habitat shots and images of the sampled colonies. For the latter, I have provided links to mitochondrial open reading frame (mORF) sequences on NCBI, as well as hyperlinks to data files.