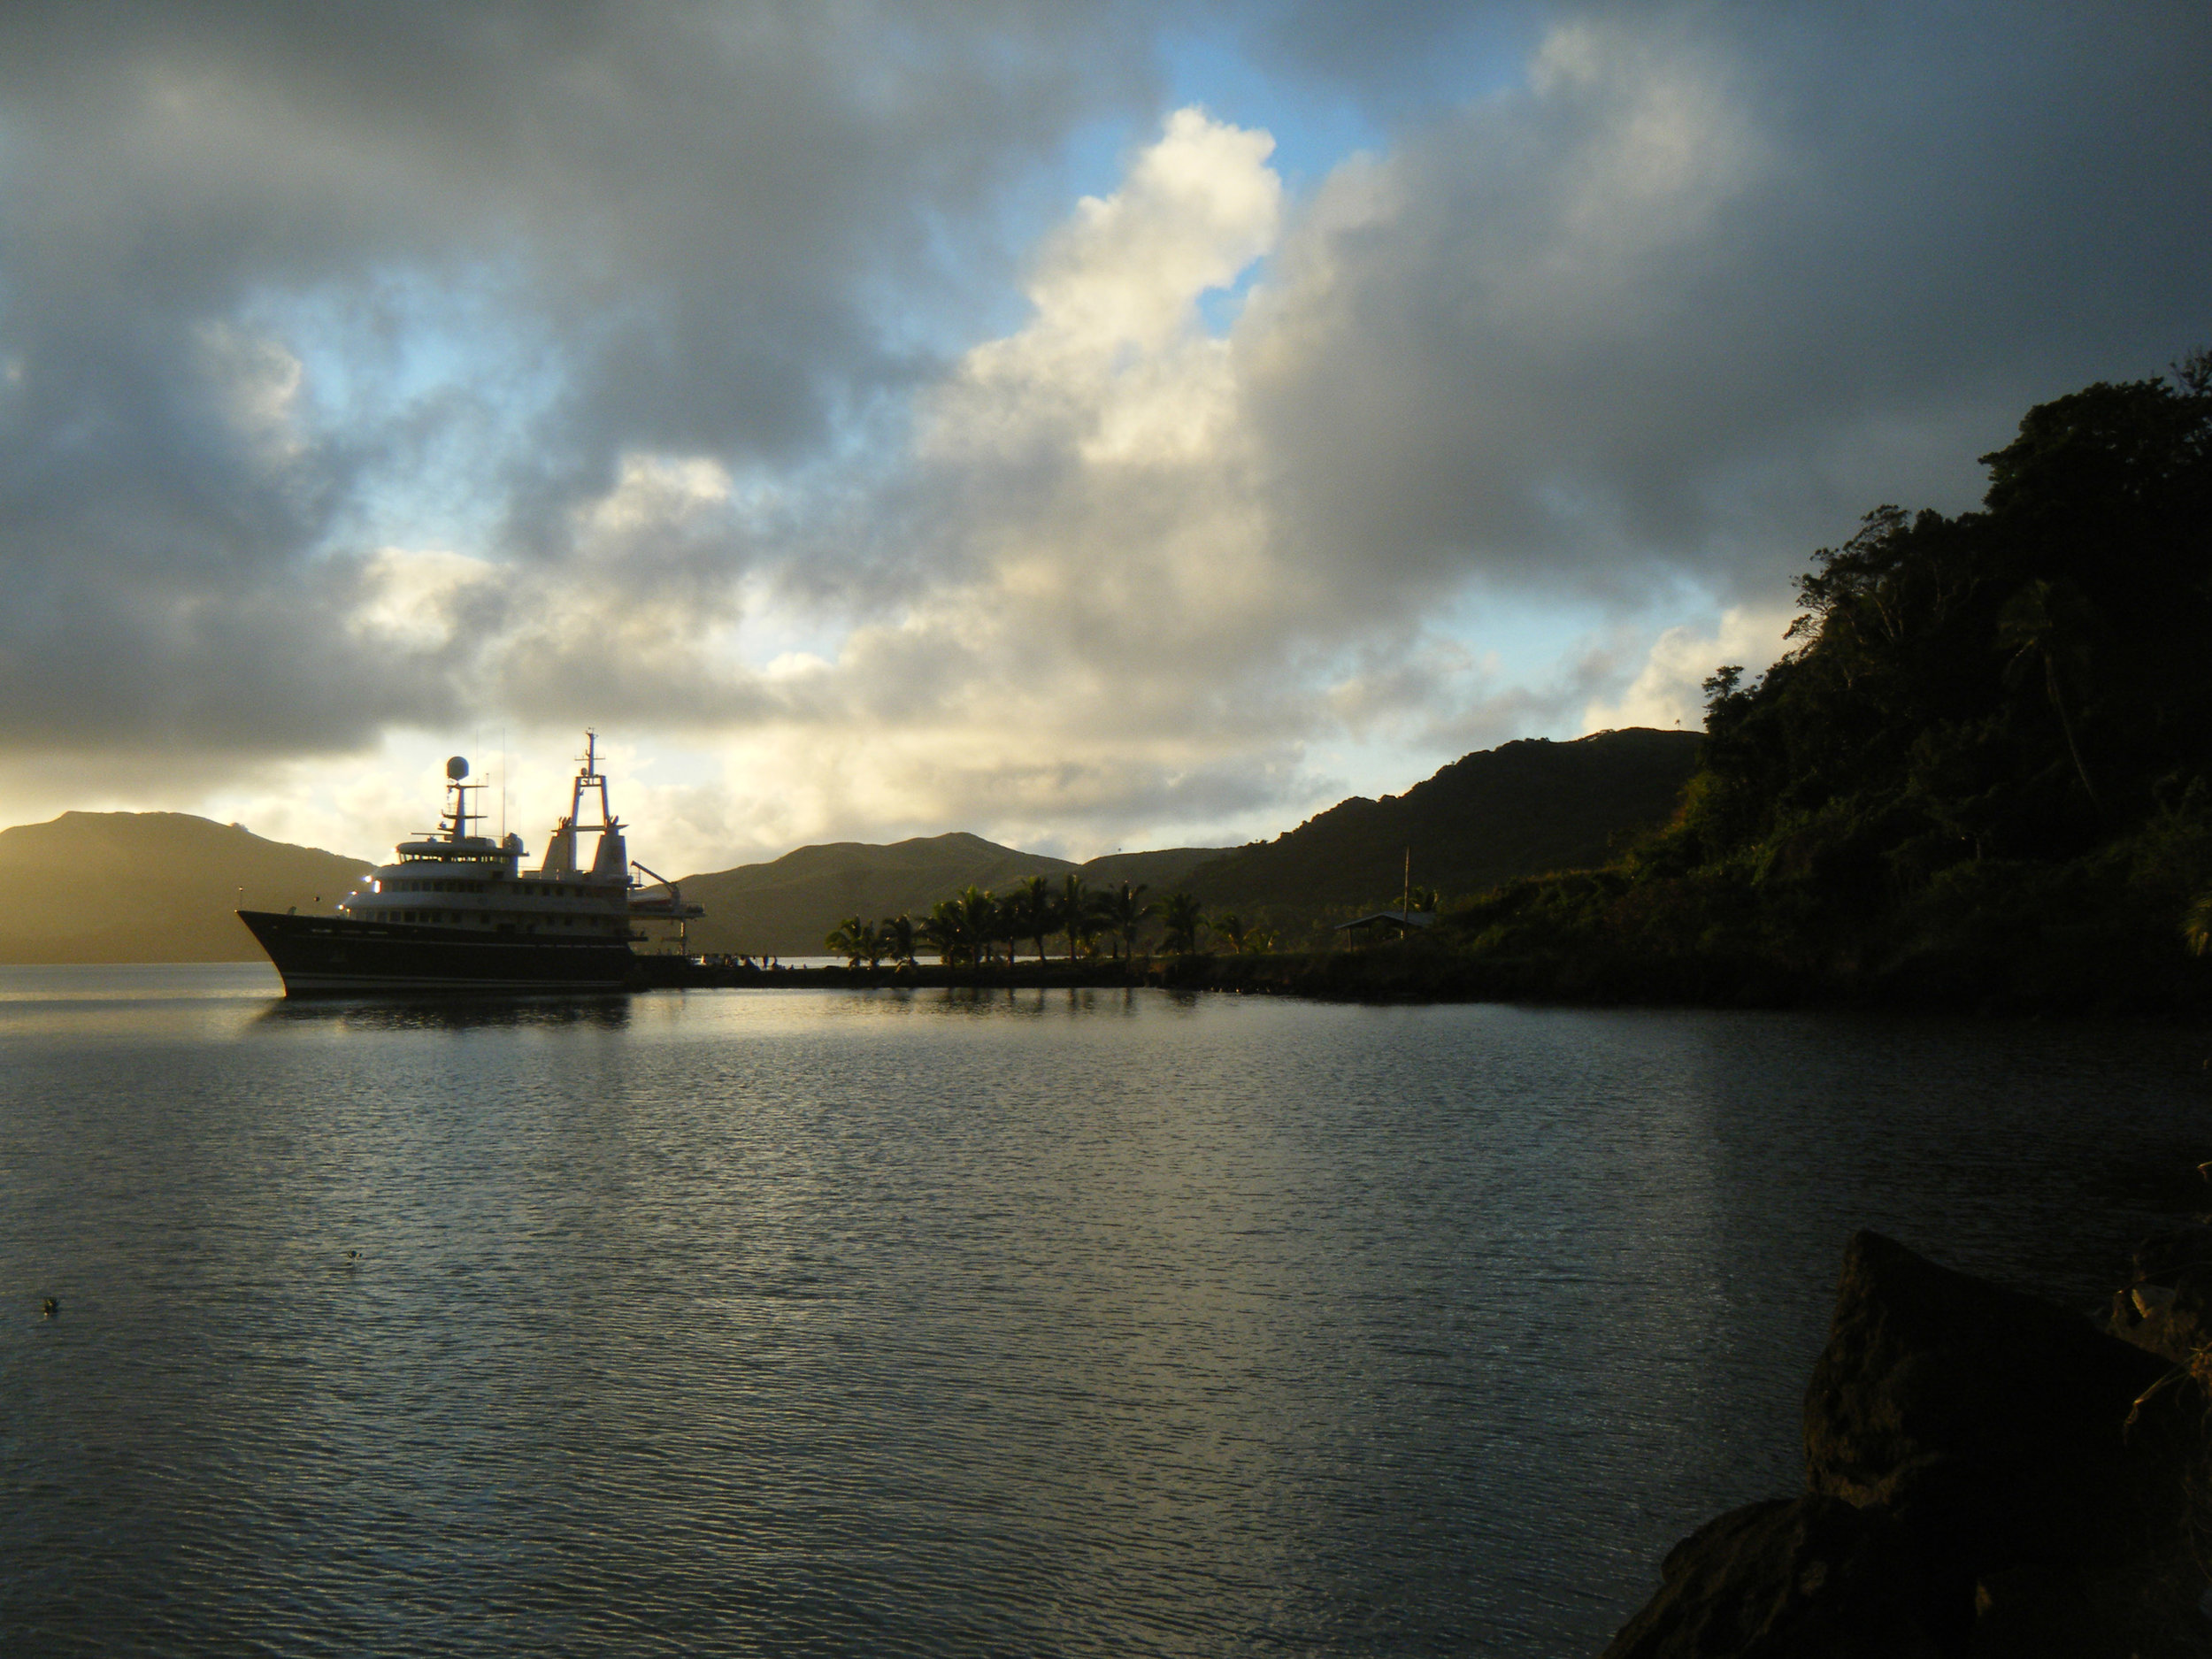
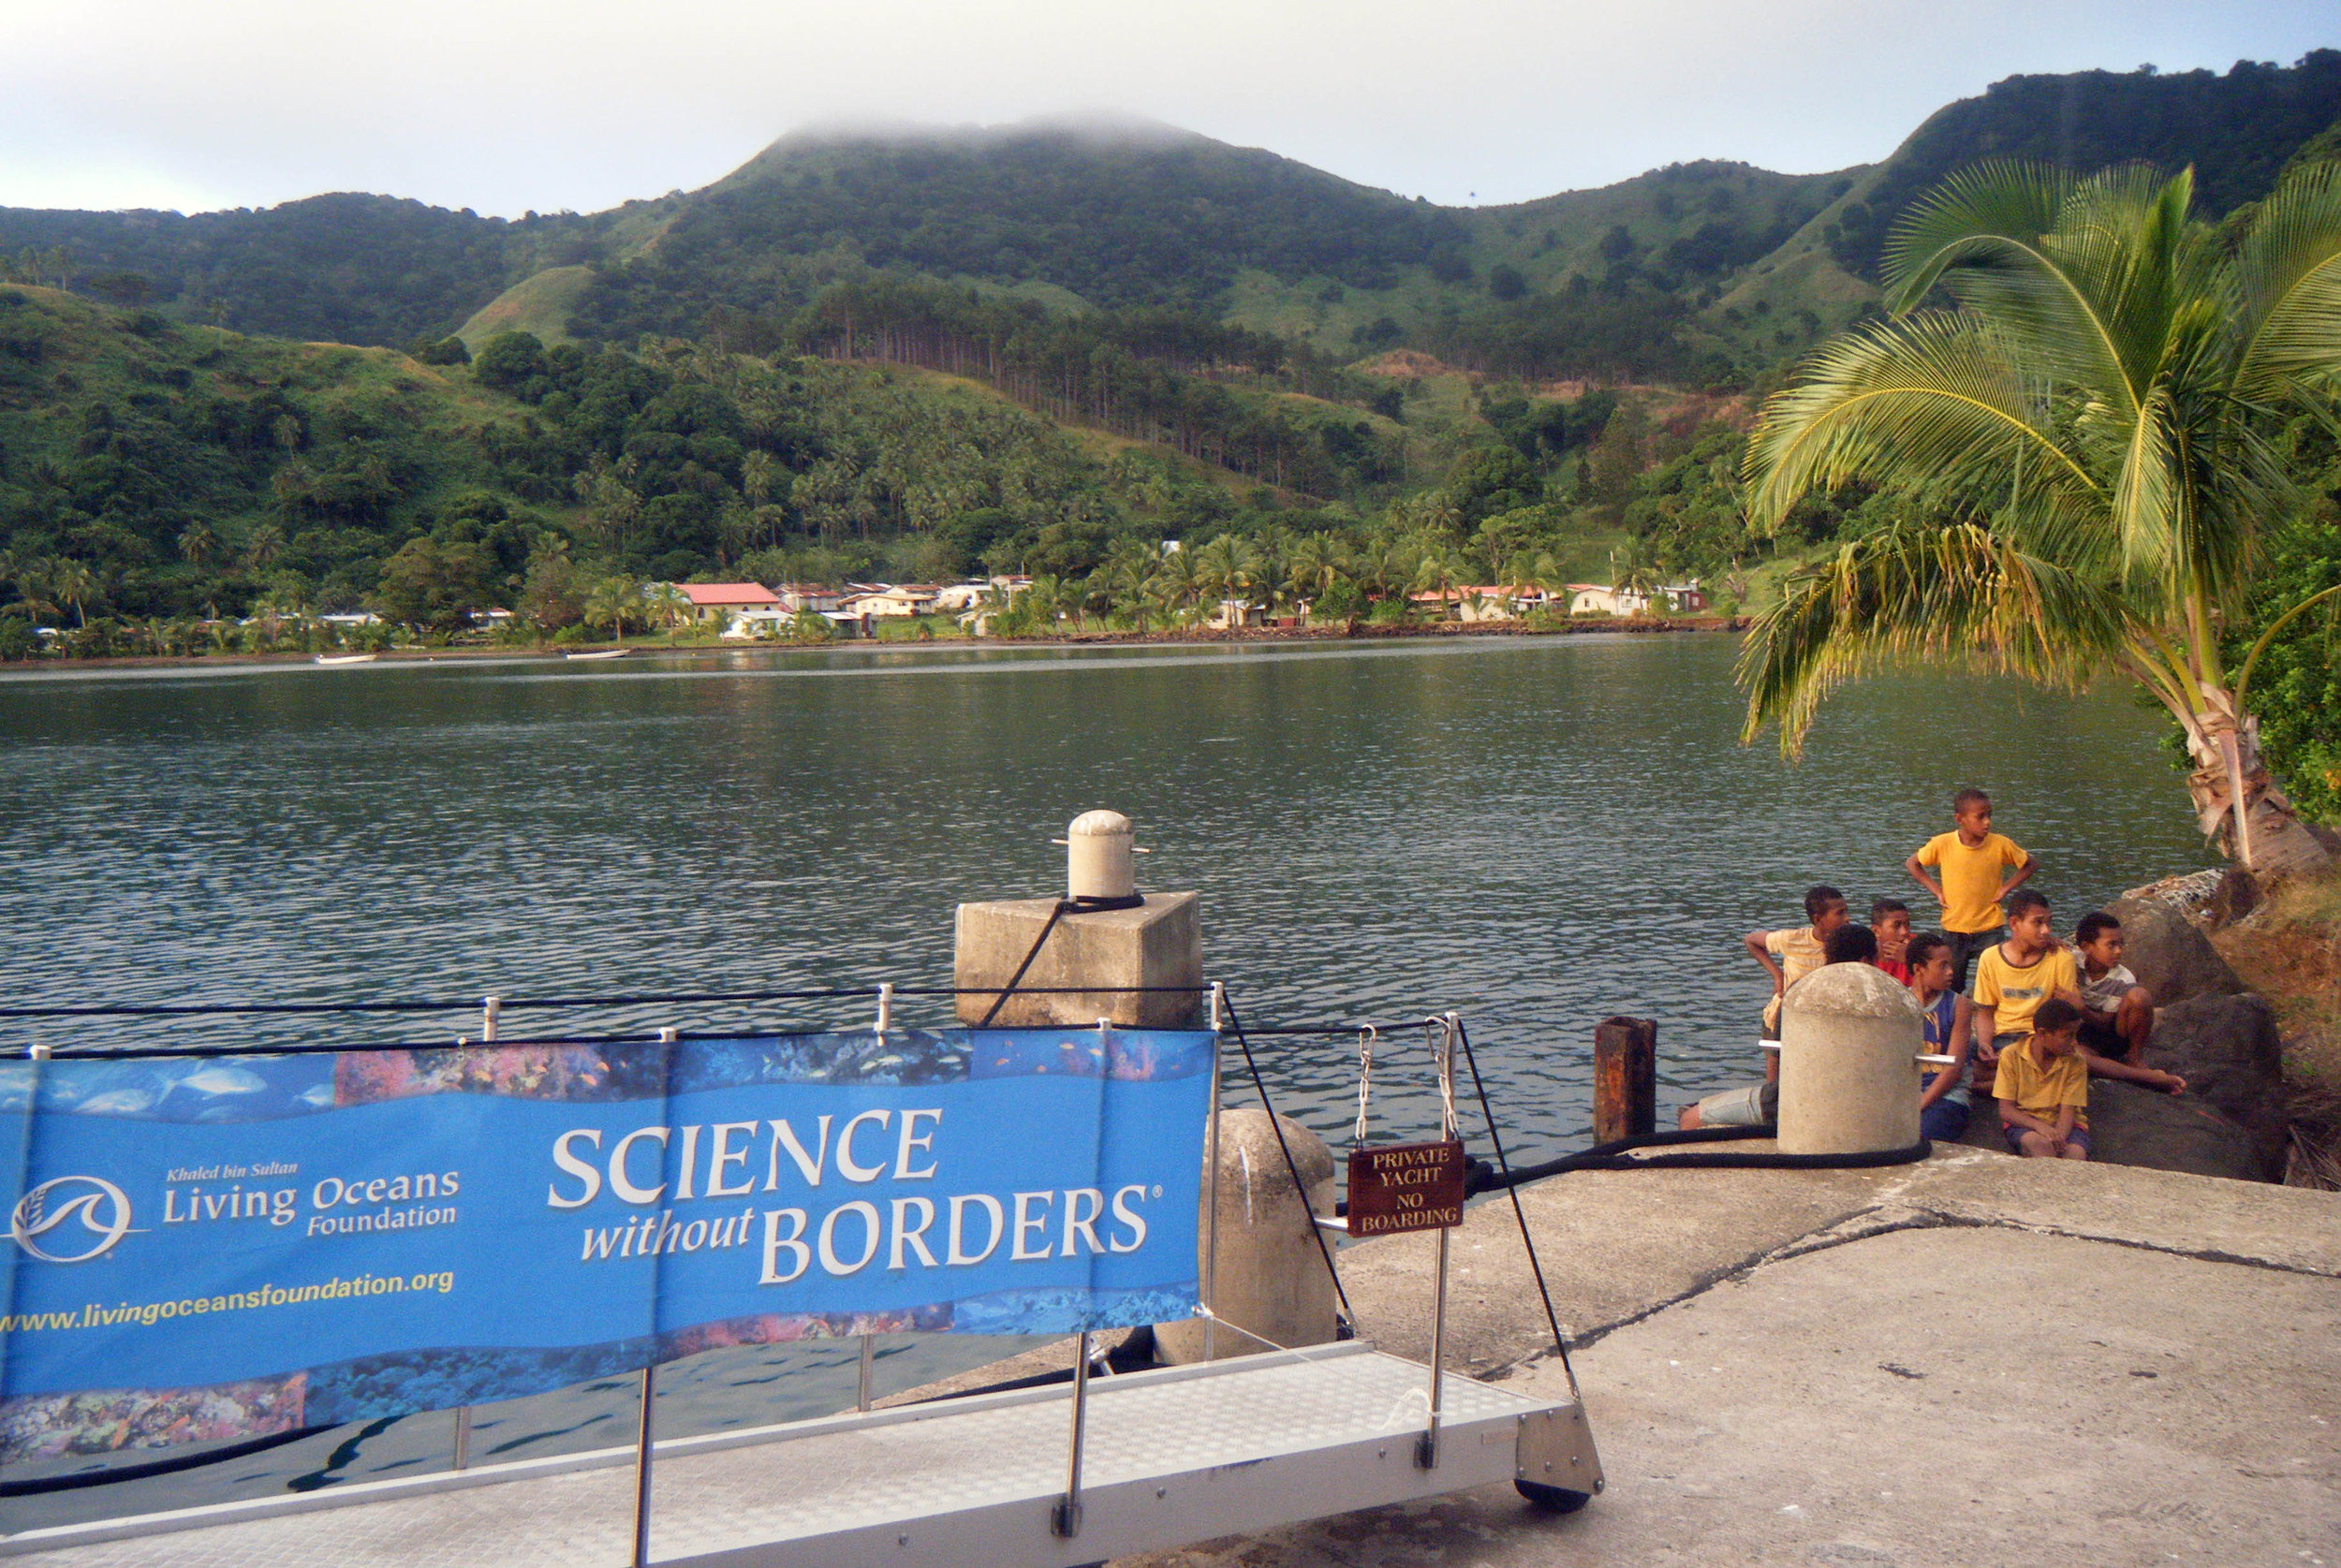
In June 2013 the Living Ocean Foundation's research vessel M.Y. Golden Shadow traversed Fiji's Lau Archipelago. For details, check out this project report. Lau has been plagued by over-harvesting of sea cucumbers, and so there was an emphasis on assessing holothu-rian diversity and abundance; see this report by Stacy Jupiter for details. Feel free to download images of the habitats and sampled corals if you do not want to go island-by-island on this website. For the NCBI accession numbers of the Pocillopora spp. colonies analyzed, consult this spreadsheet. Note that RNAs, DNAs, and proteins were extracted from a subset of all 153 sampled colonies. For the molecular data for a subset of these, click here. Otherwise, links to data files have been overlaid onto the coral images posted on the respective pages for each island visited.
In this manuscript, I used the Mahalanobis distance (amongst other means) to assign a level of aberrancy to each sample. This essentially ranks the colonies sampled in terms of how "weird" they are; although we can't know for sure at the moment, statistically oddly behaving colonies may be those that are ultimately found to also be of compromised resilience. I have now taken another look at this dataset to see which environmental parameters were most important in driving physiological variation between the sampled colonies. I had hypothesized previously that it was due to differences in light, but my data do not support this. It instead appears to be driven more by genetic variation in the host, a wholly unsurprising finding discussed in this second manuscript. Now, we want to profile the microbiomes of these valuable samples to see if they can resolve any of the remaining variation in stress levels and overall physiological performance.
For GPS coordinates of the 70 site surveyed, please click here. For information on the reefs (e.g., exposure, type, zone, & coral cover), please click here. Other environmental data can be found in this JMP file. Structural details of the reefs and remote sensing data can be found in Saul and Purkis (2015). All maps produced and underwater drop-camera footage are here. If you want to create the maps yourself, here are the shape files: name, X-Y
PD=Pocillopora damicornis, PA=P. acuta, PV=P. verrucosa, PM=P. meandrina, and PB=P. brevicornis
Other data available:
1. All coral sample data. For the gene expression data, please click here. Alternatively, I have overlaid links to individual data files on the images of the sampled colonies (found on the respective pages for the islands visited). If you use JMP, check out this file.
2. Mitochondrial open reading frame (mORF) sequences of the sampled colonies. Alternatively, hyperlinks to the NCBI pages hosting the mORF sequences have been overlaid on the images of the sampled colonies (found on the respective pages for the islands visited).
3. For details on the 11 outliers only, click here.
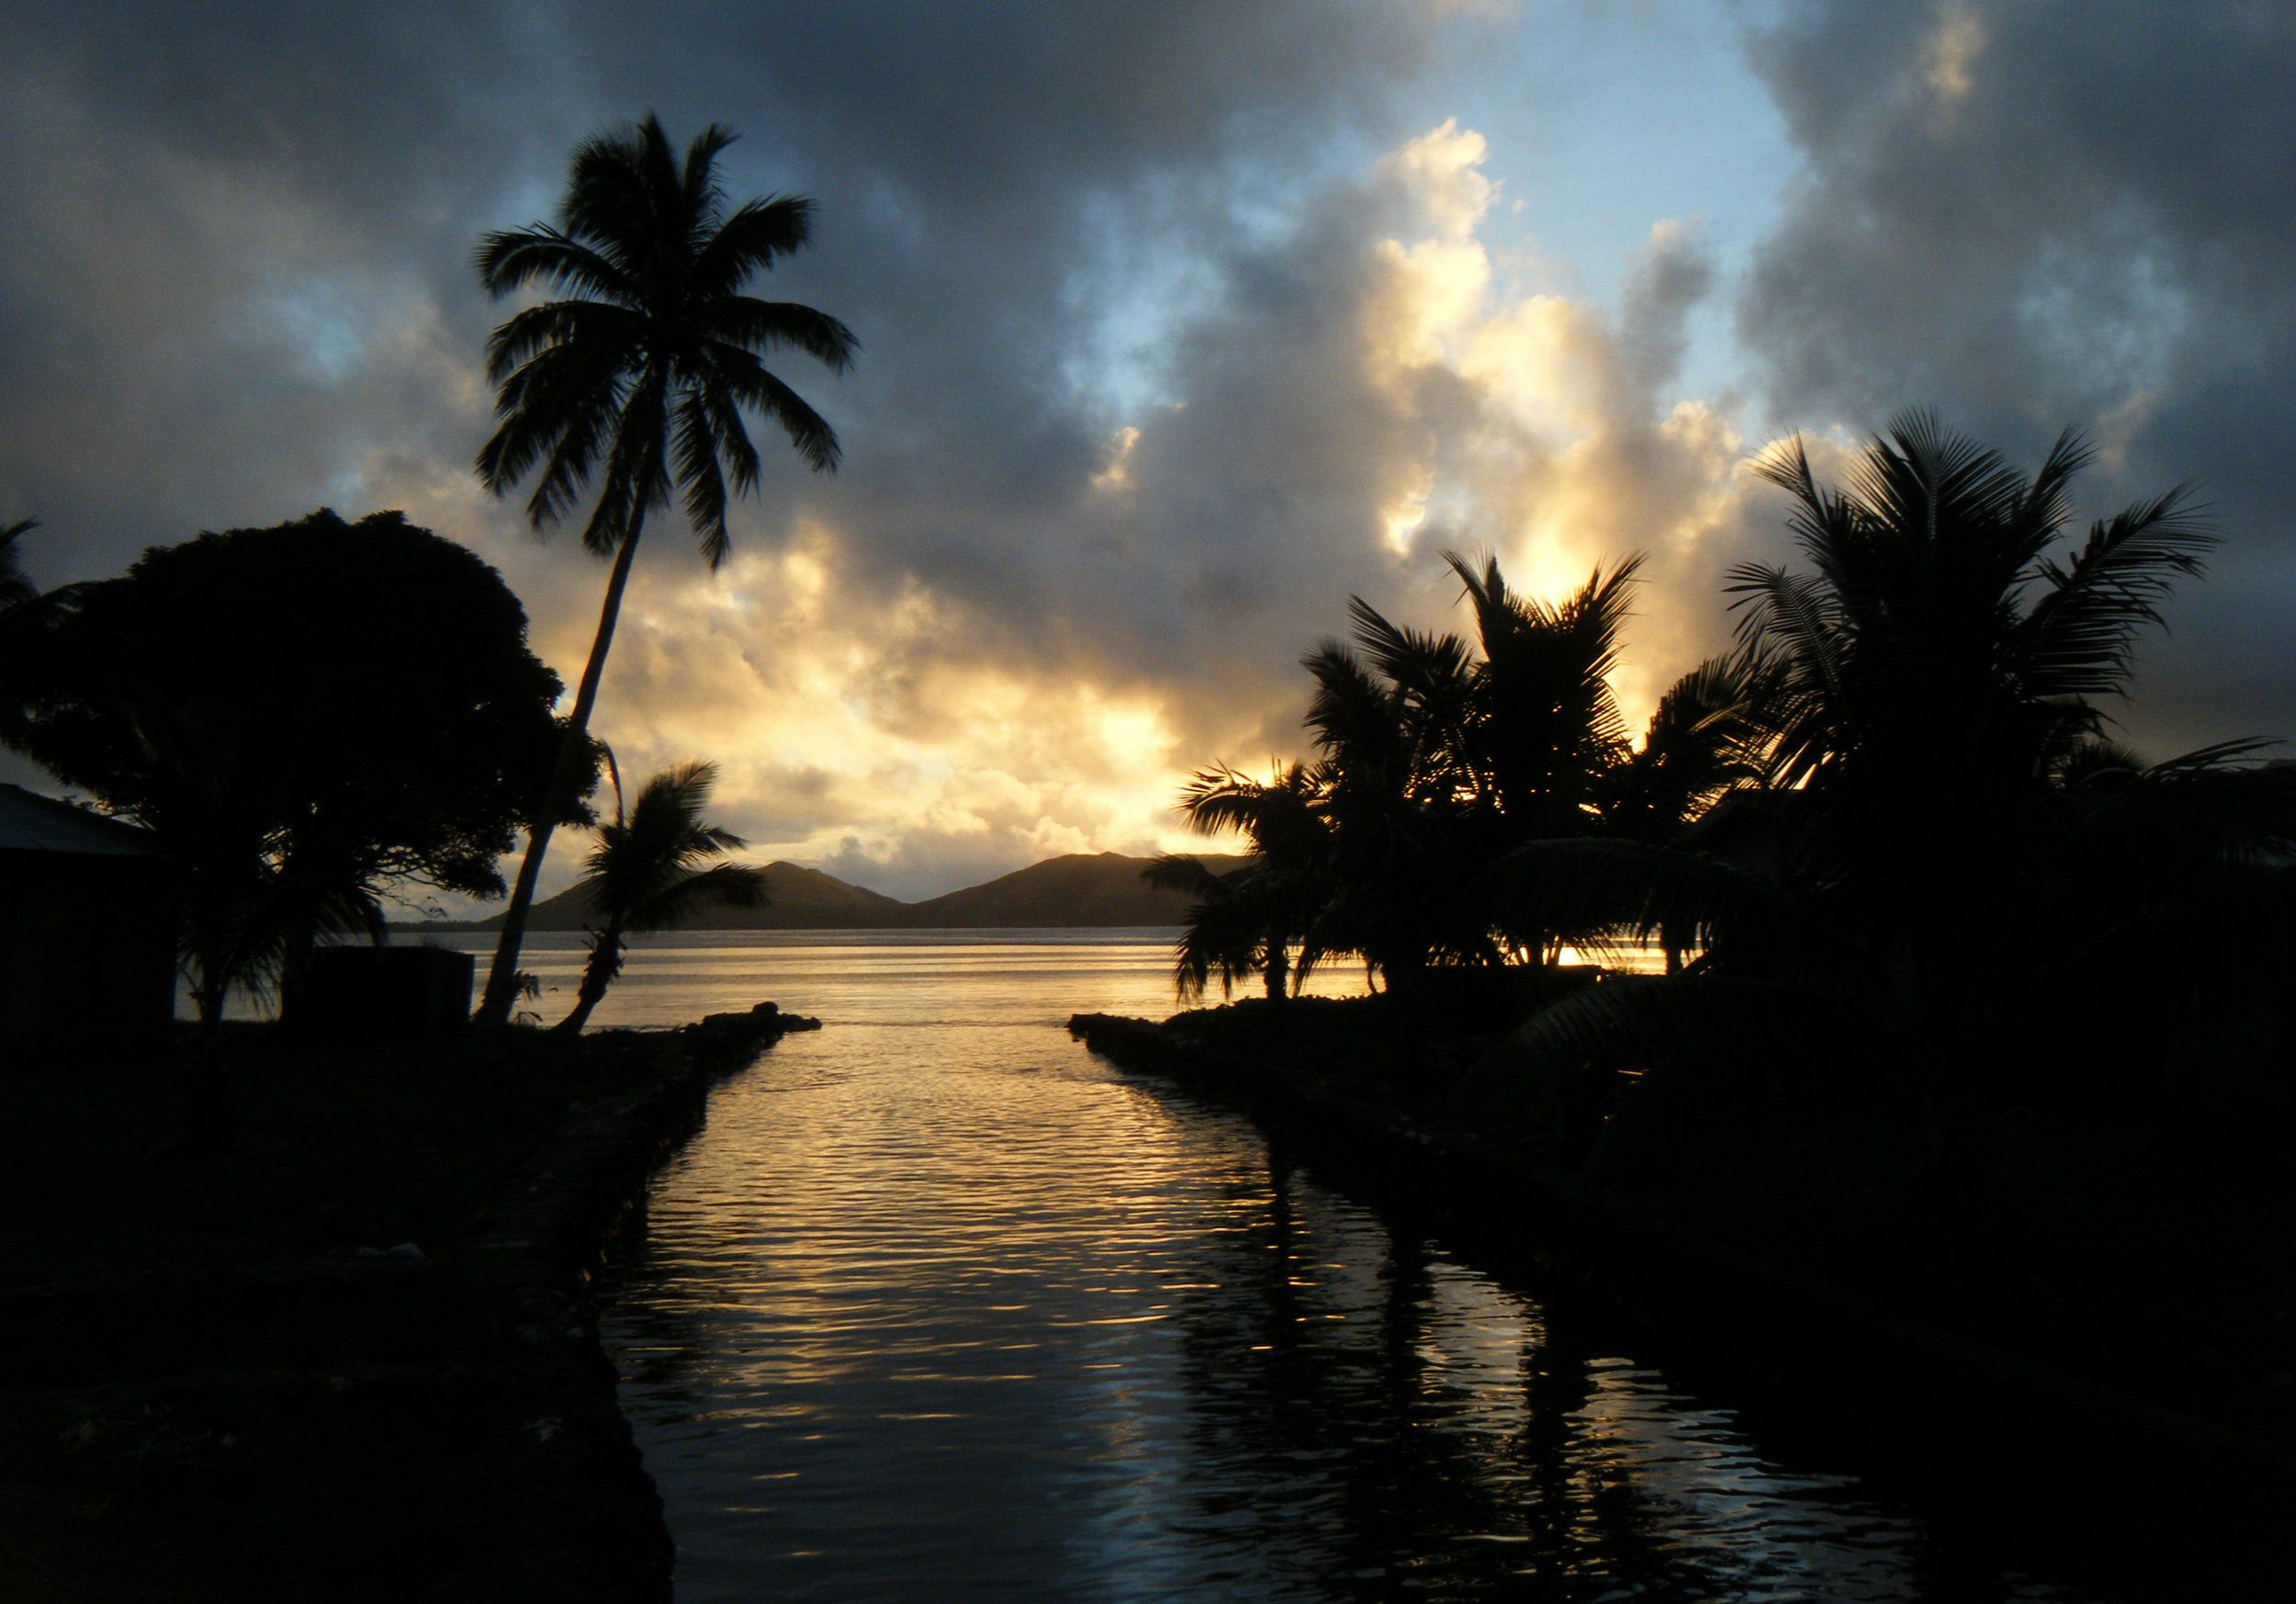
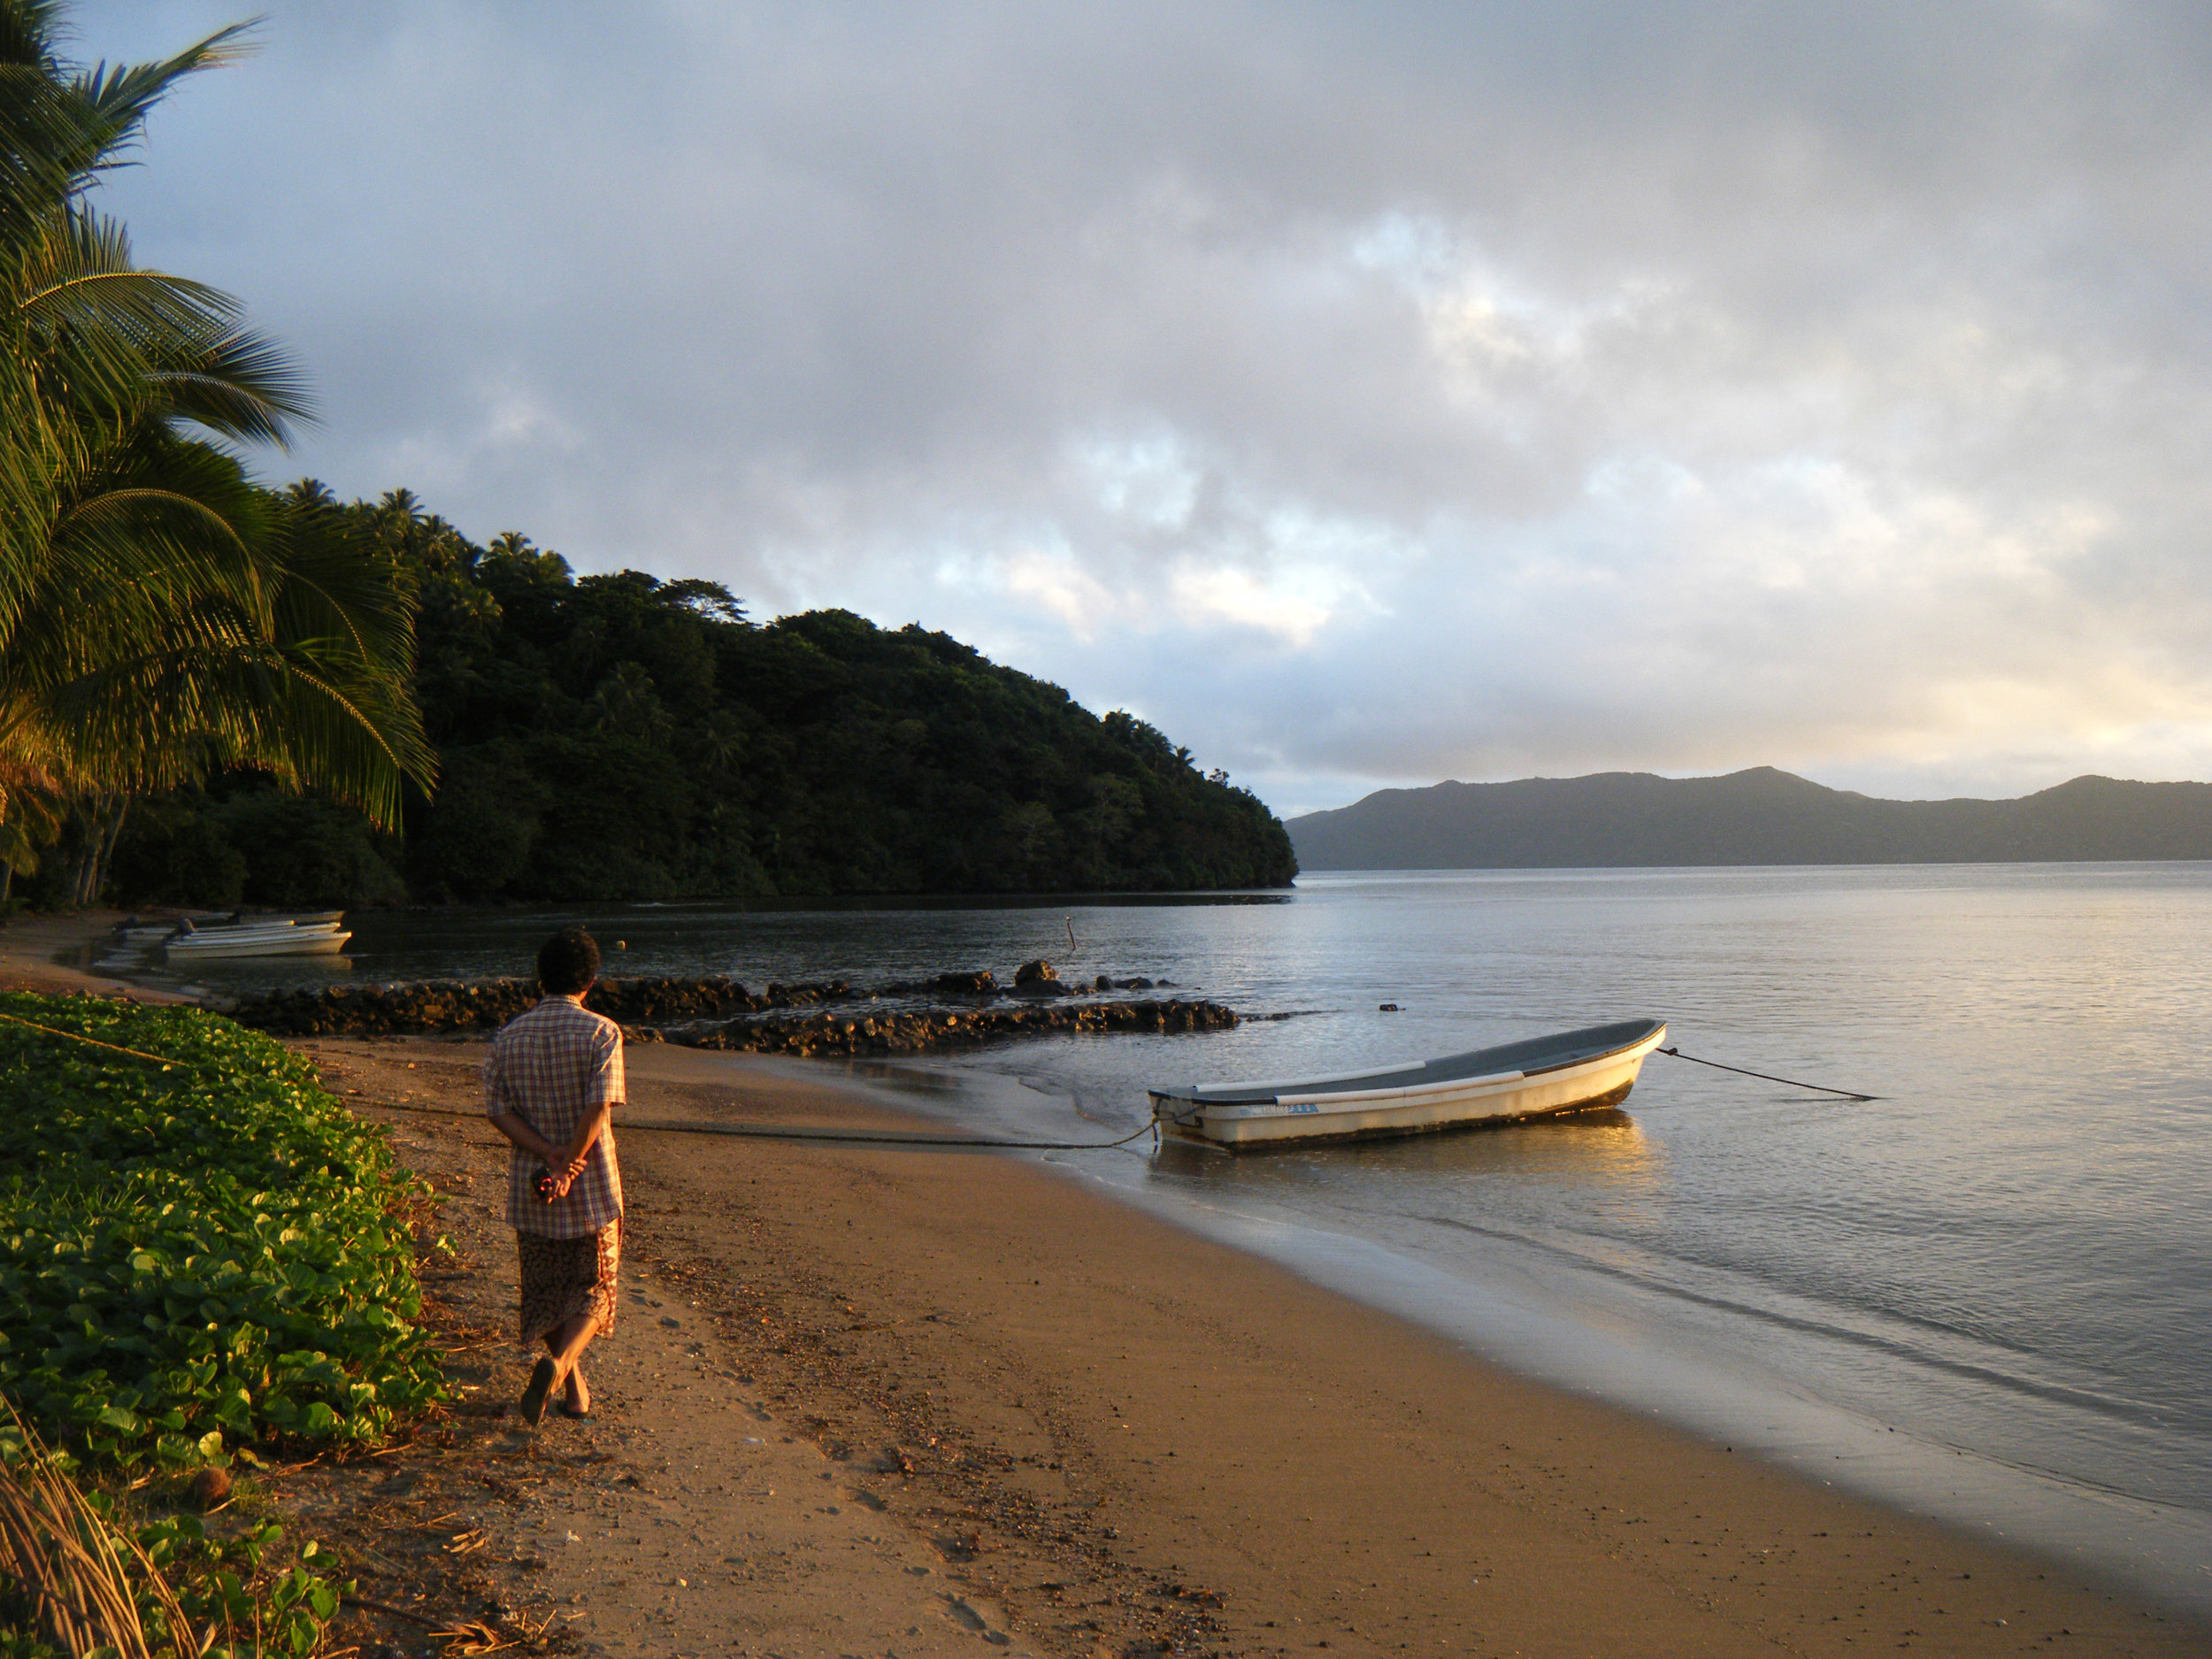
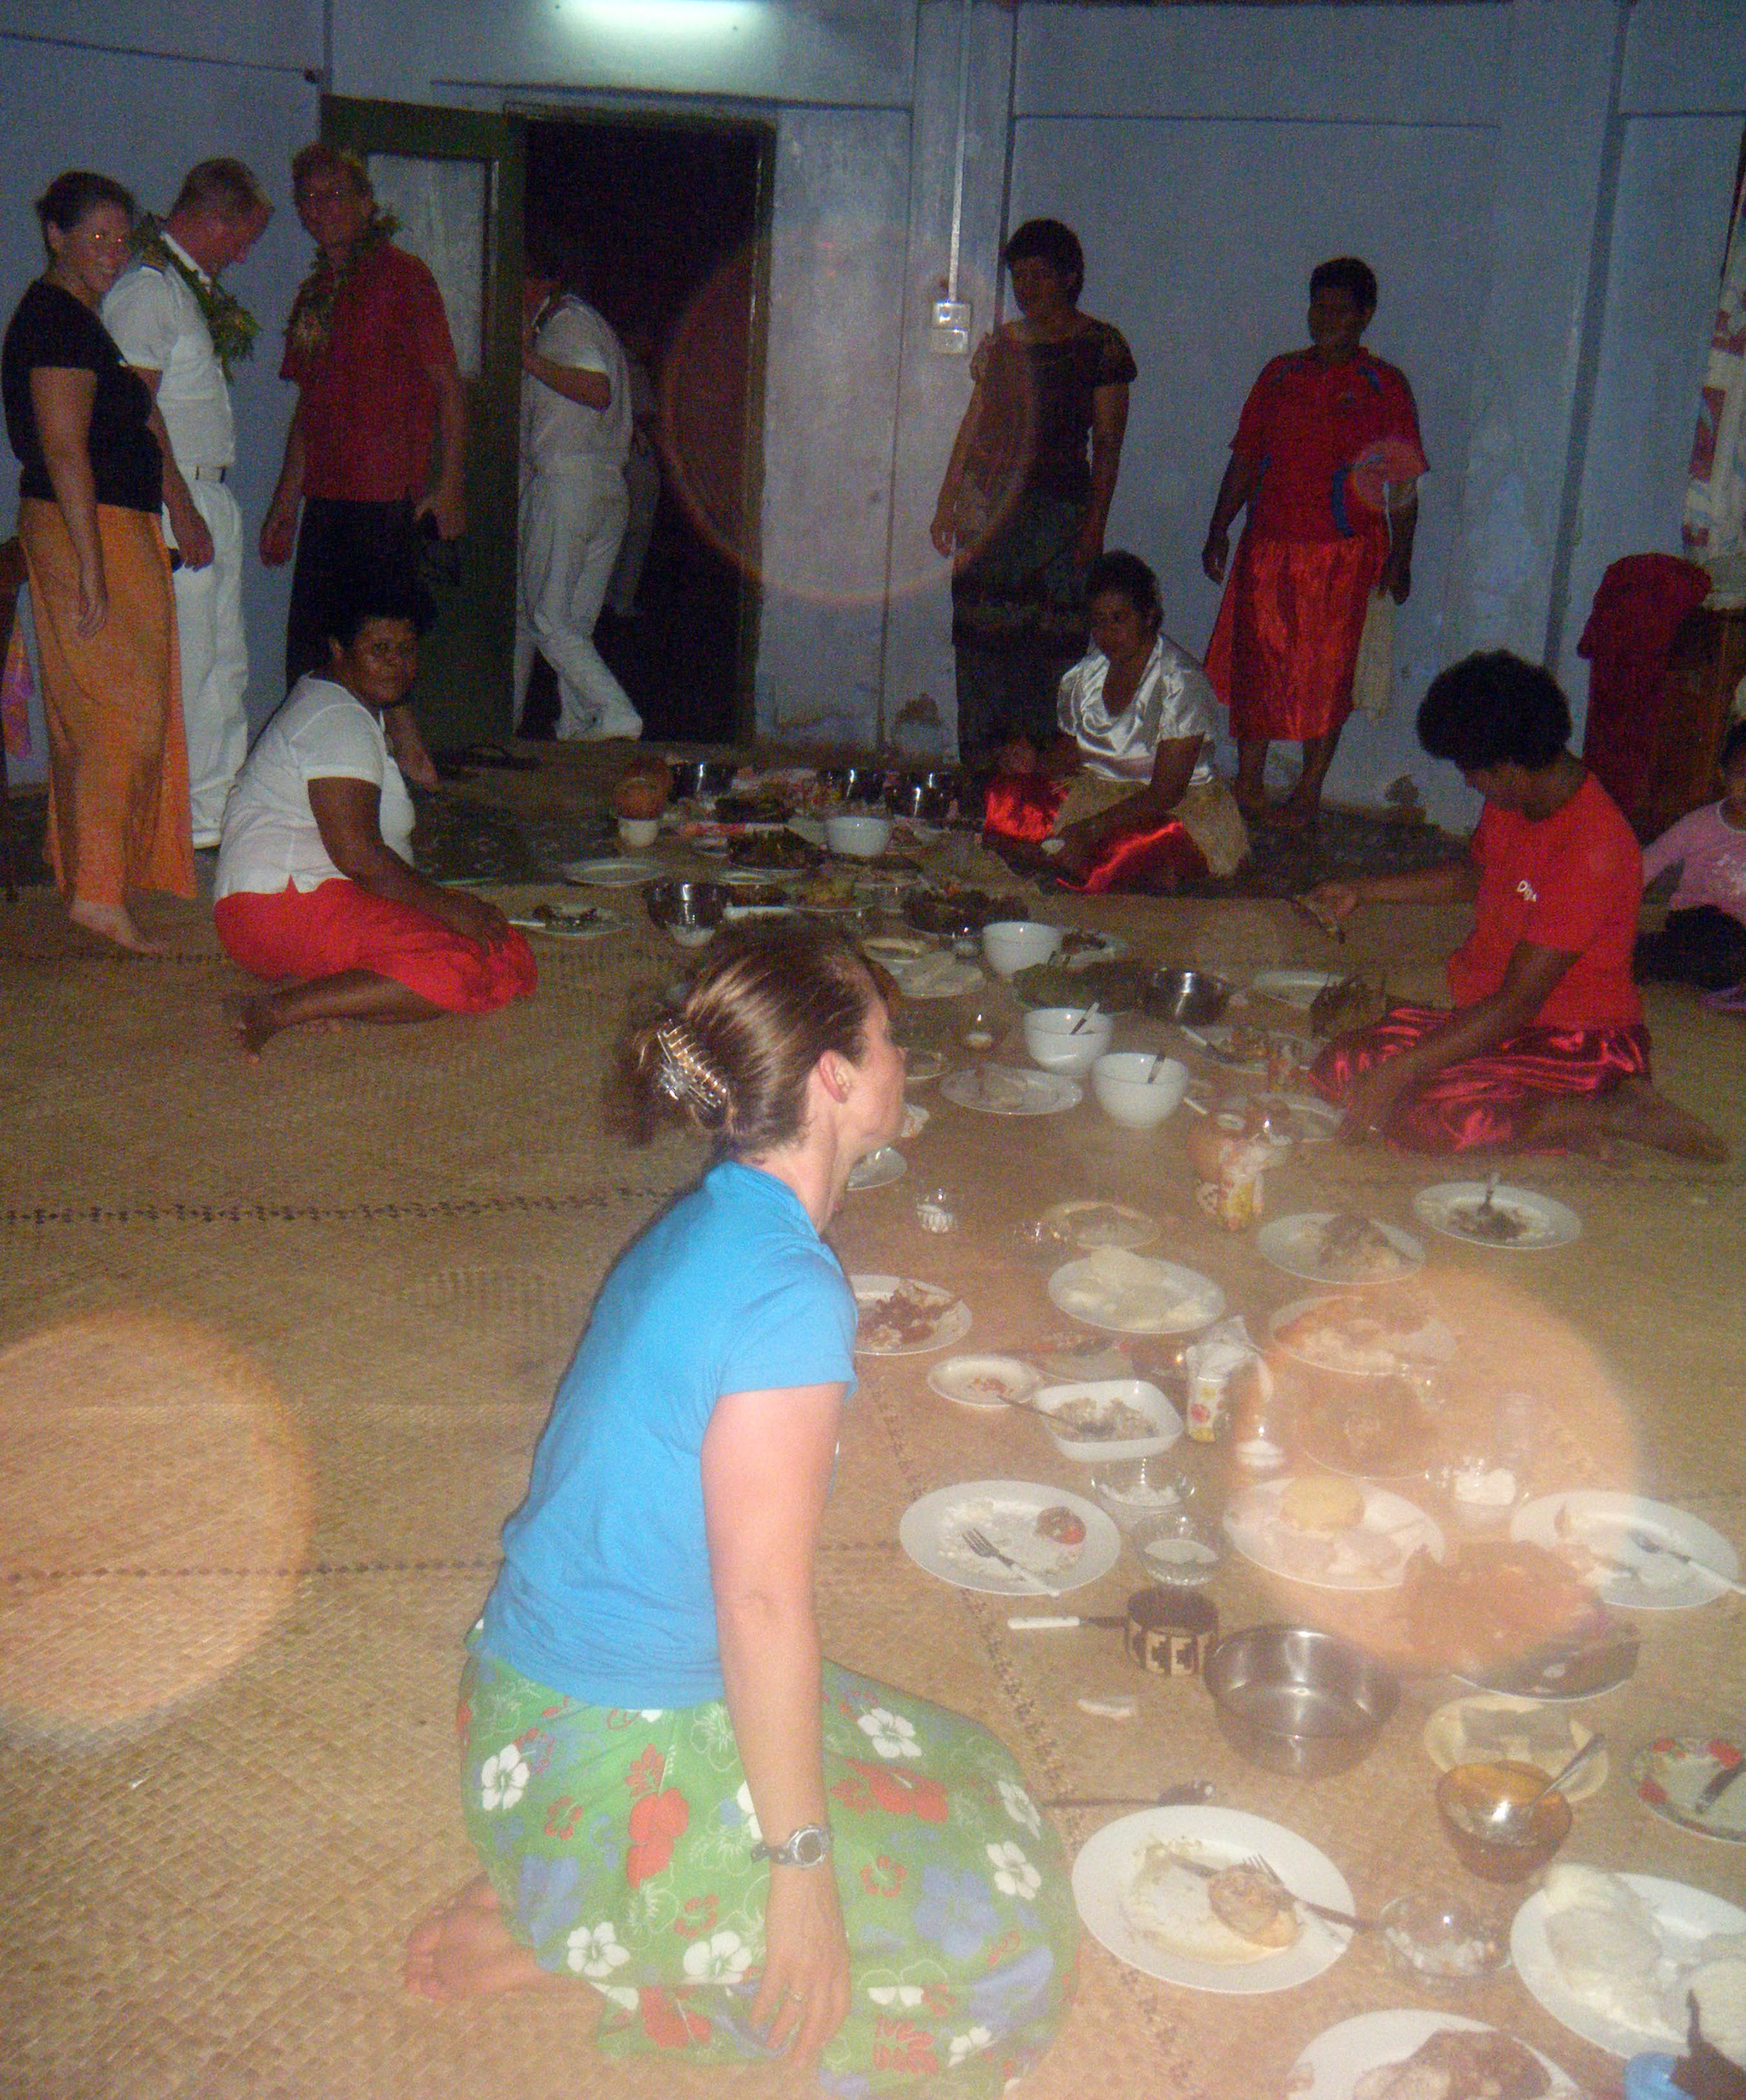
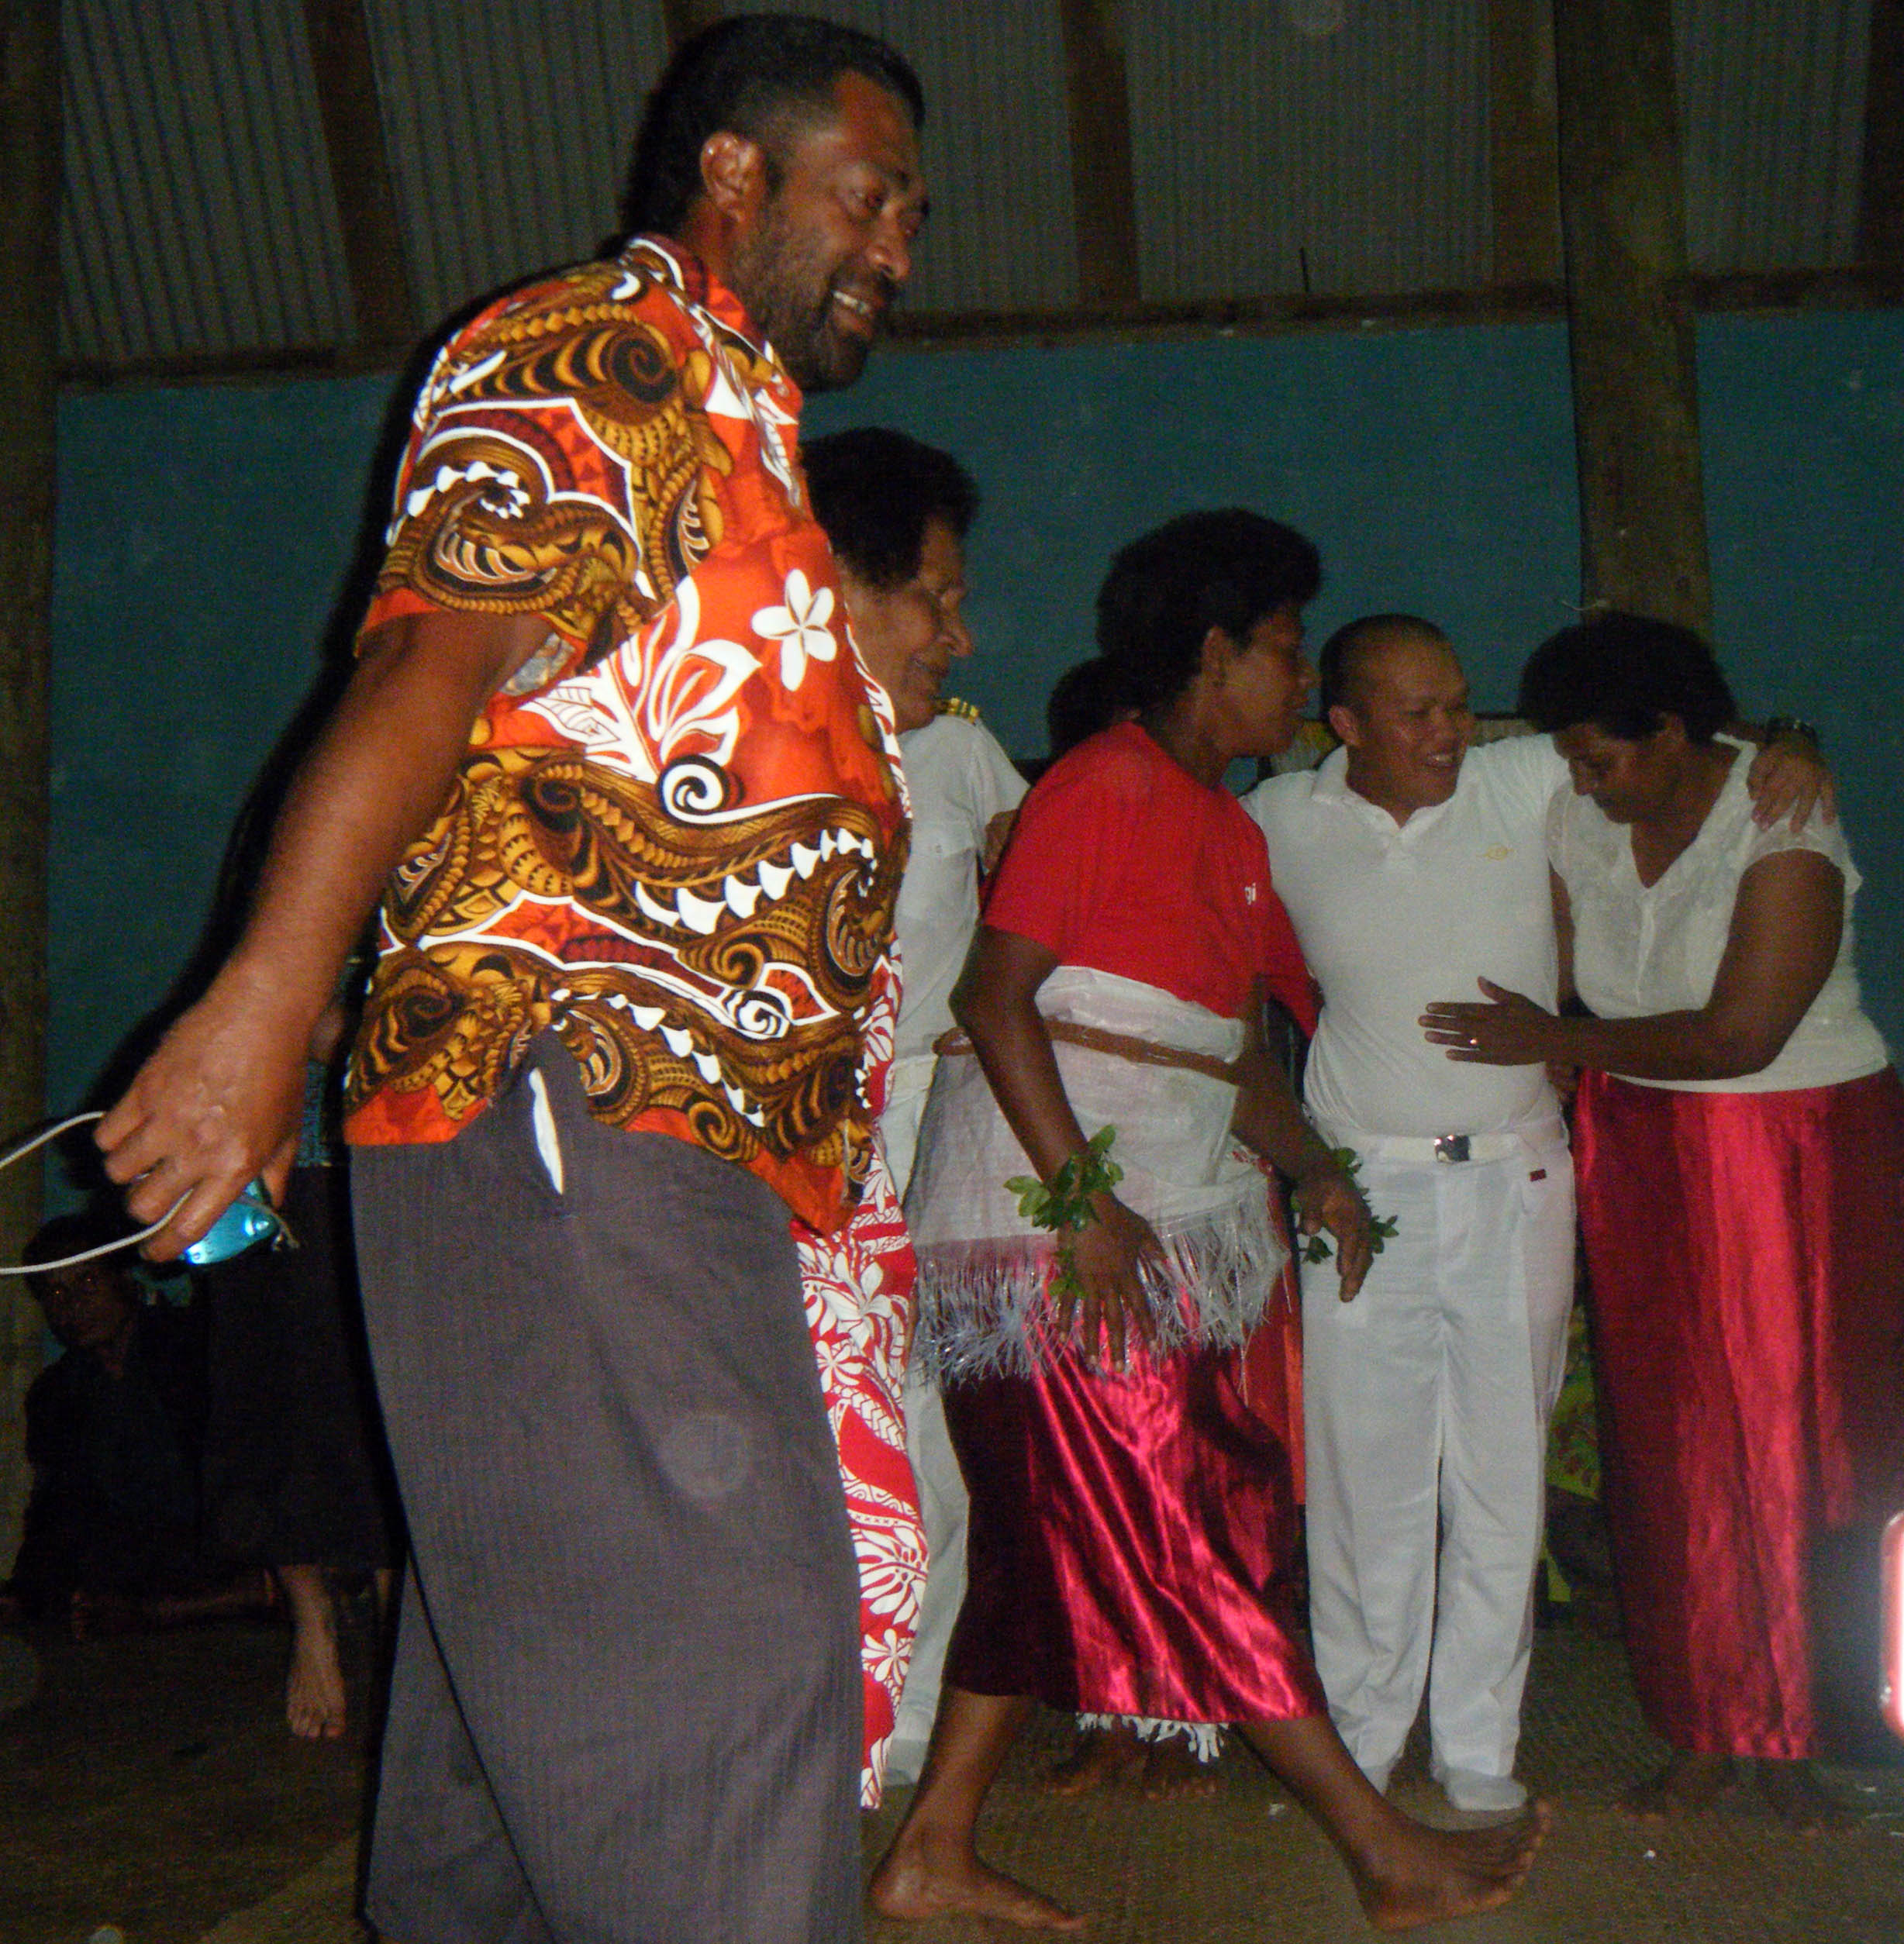
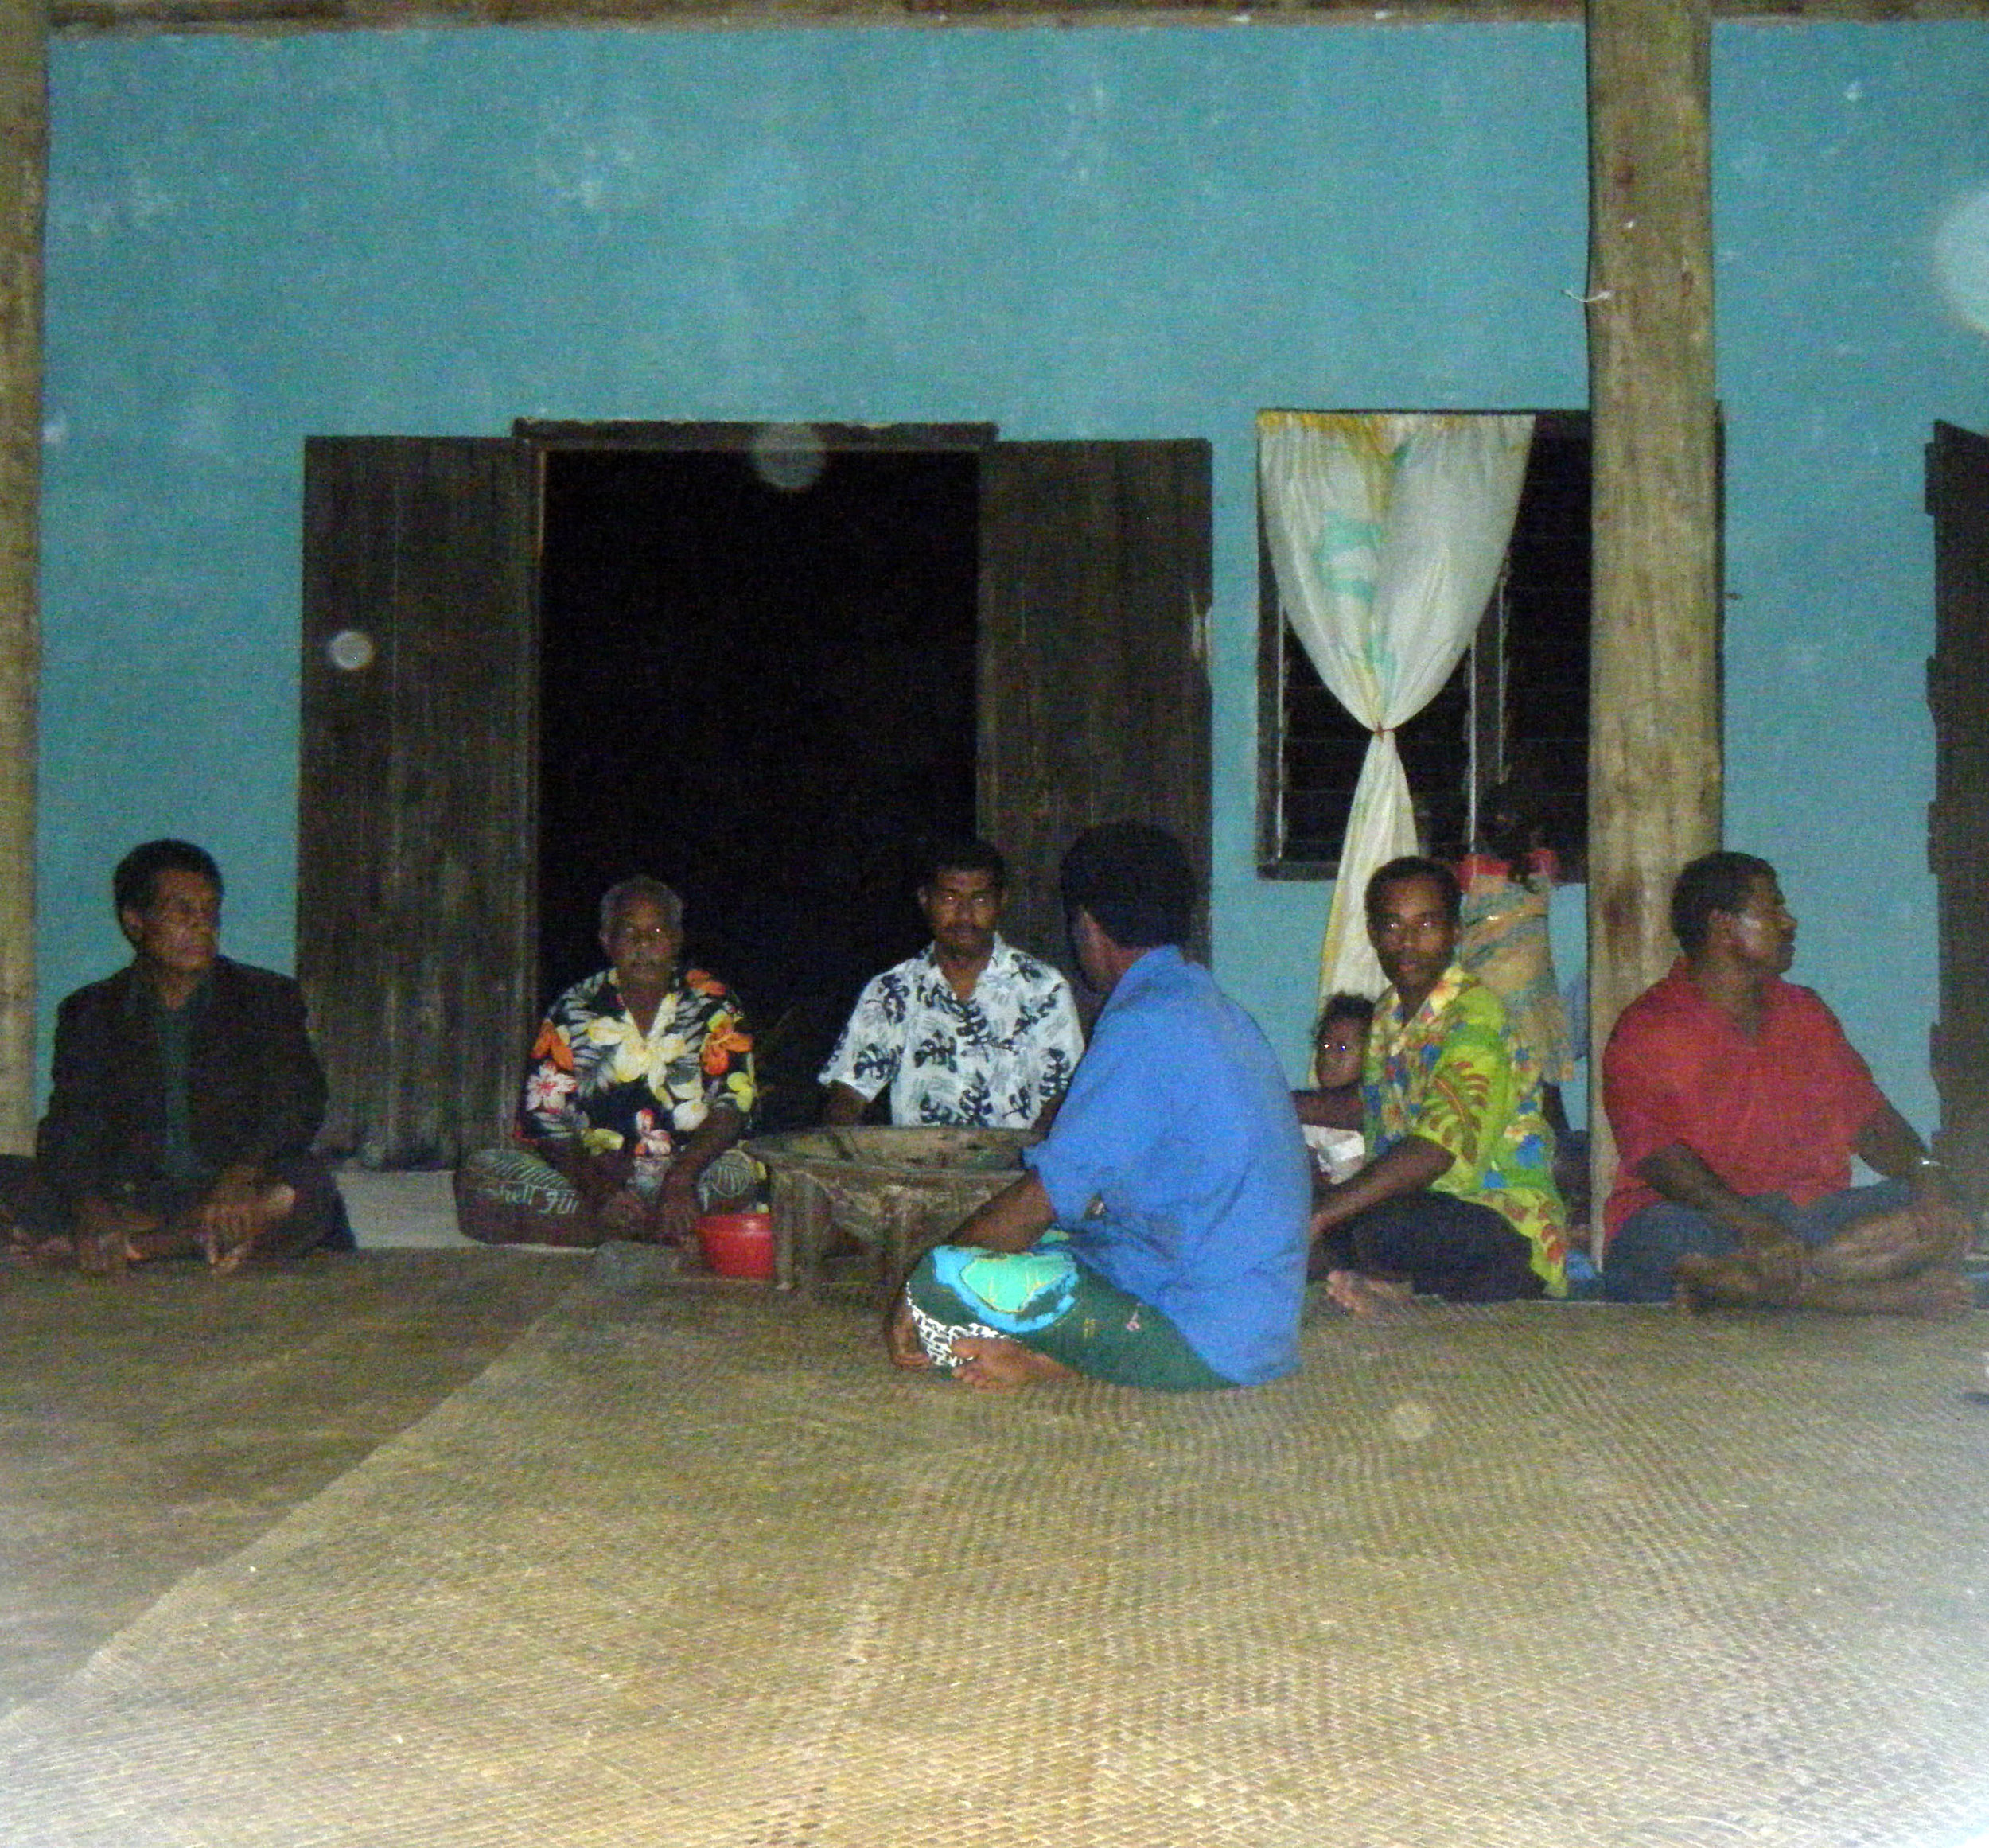
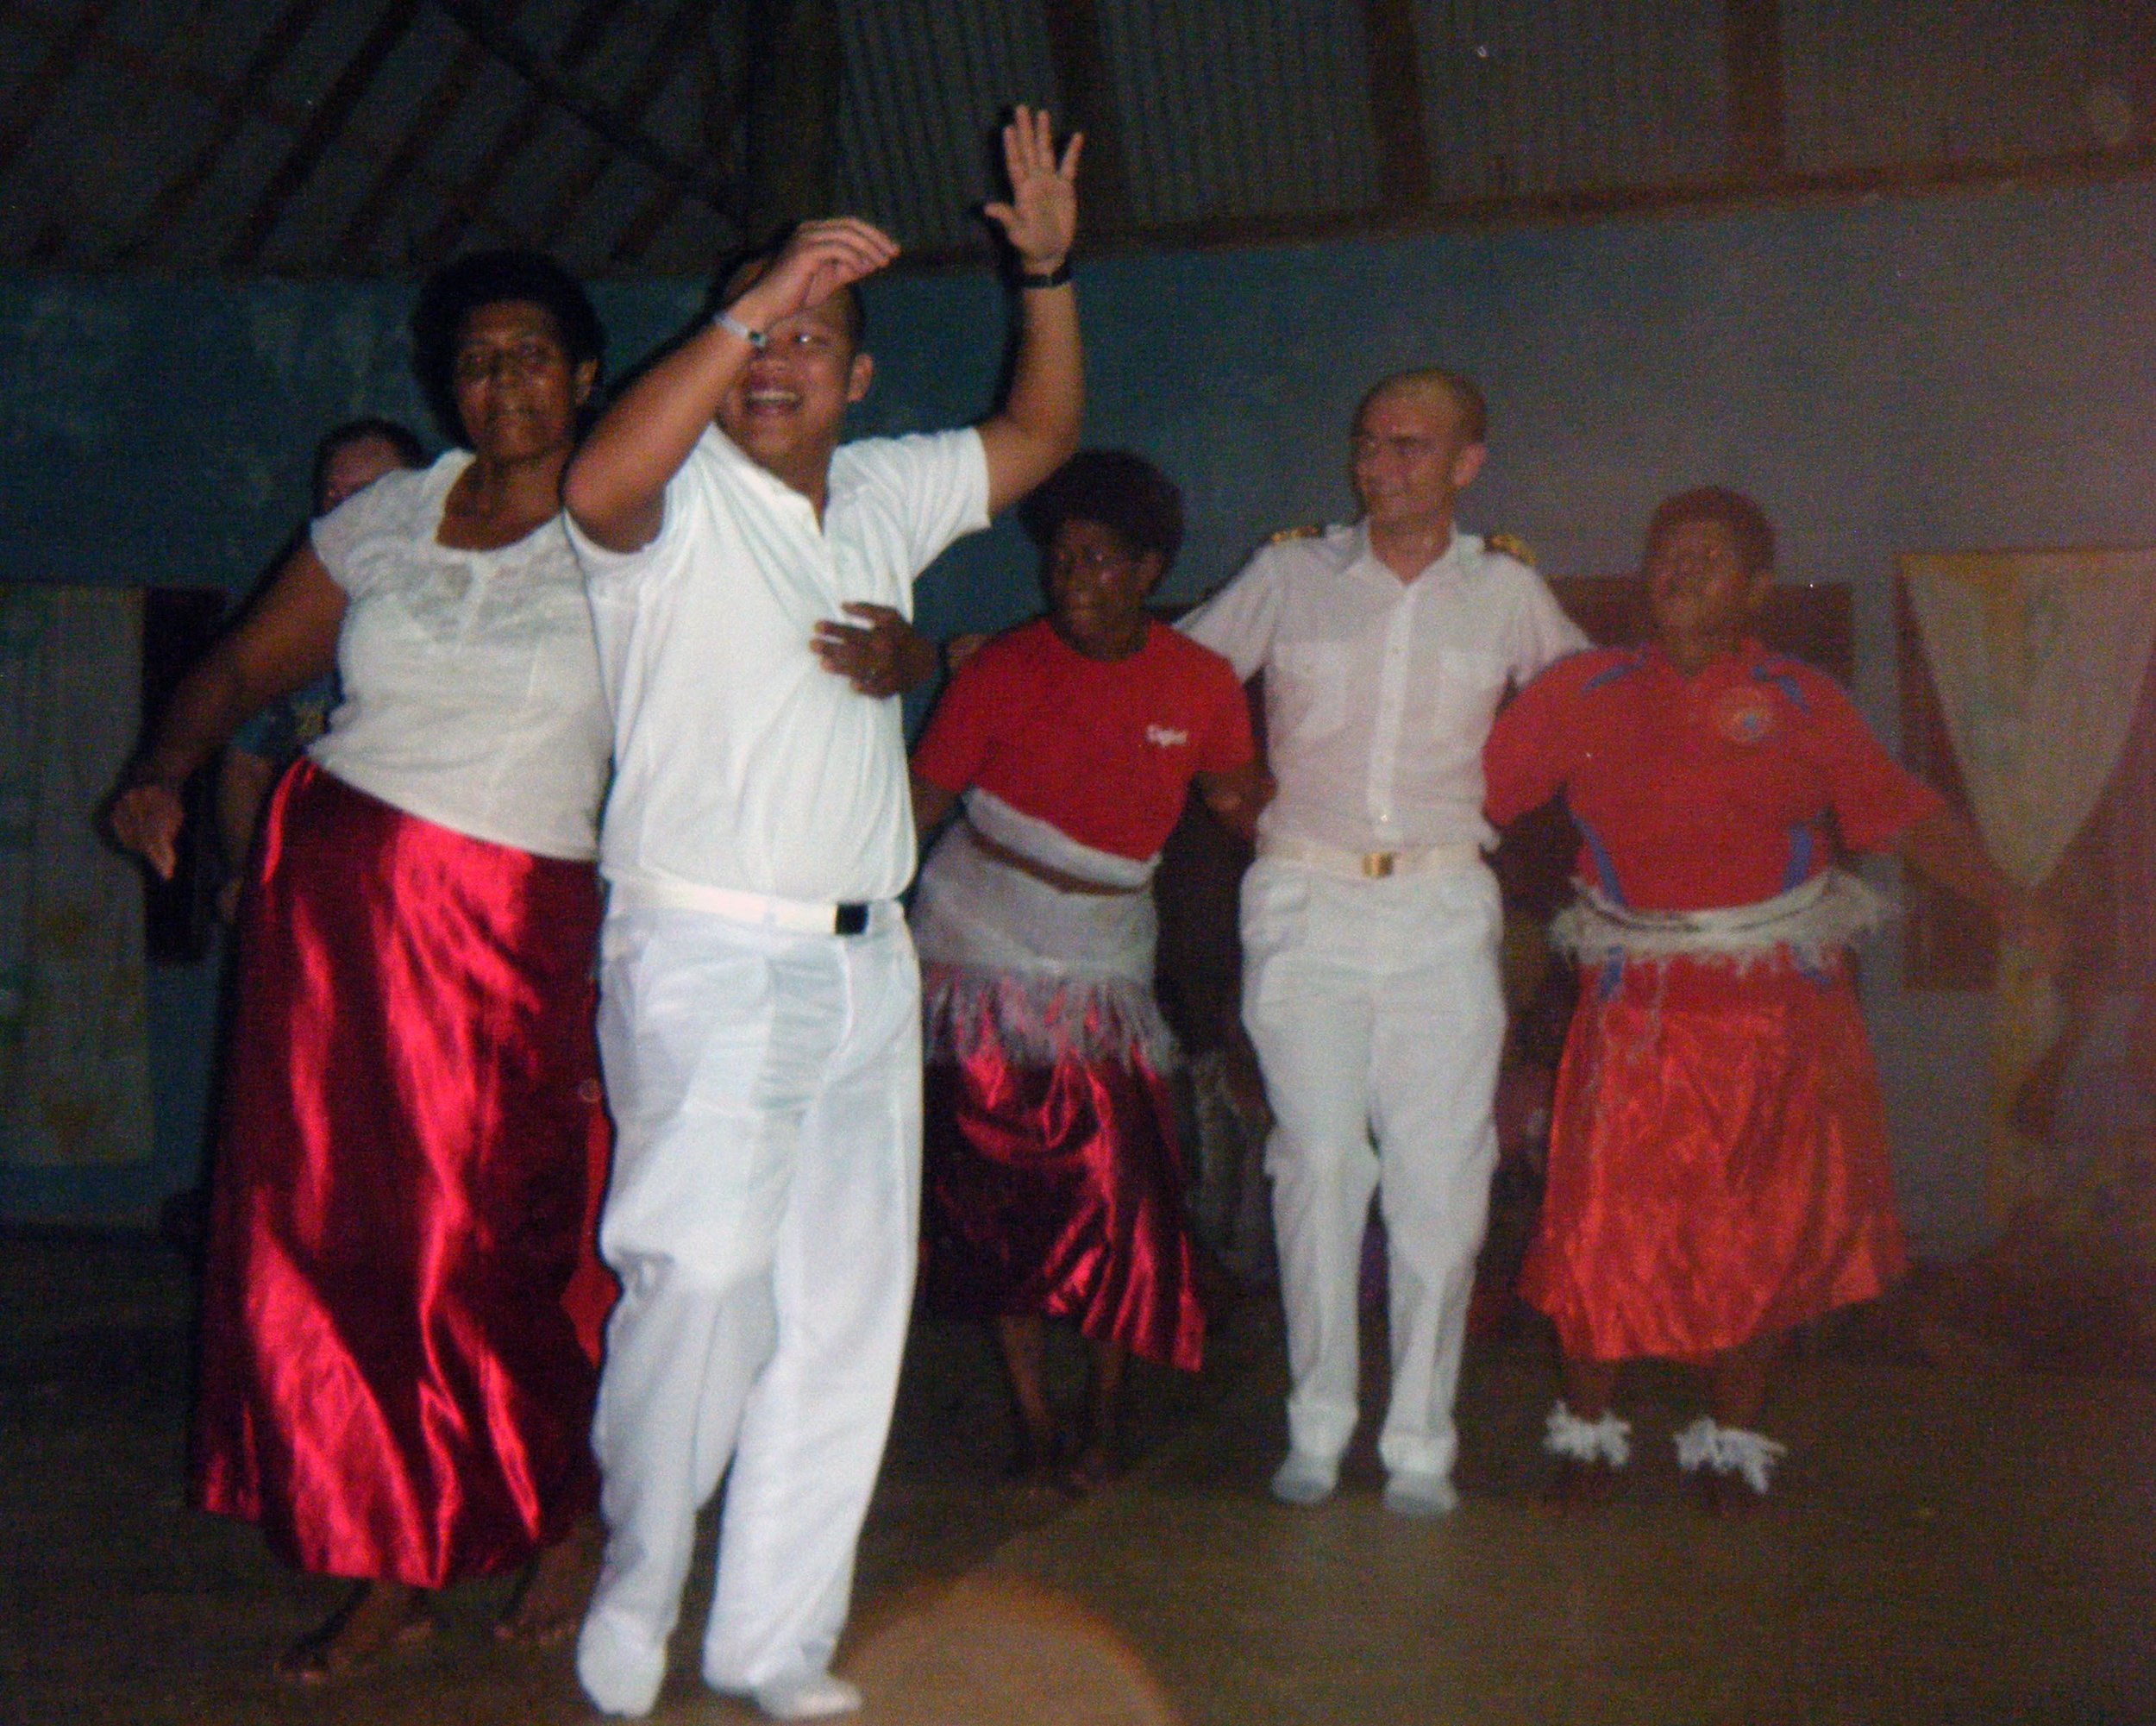
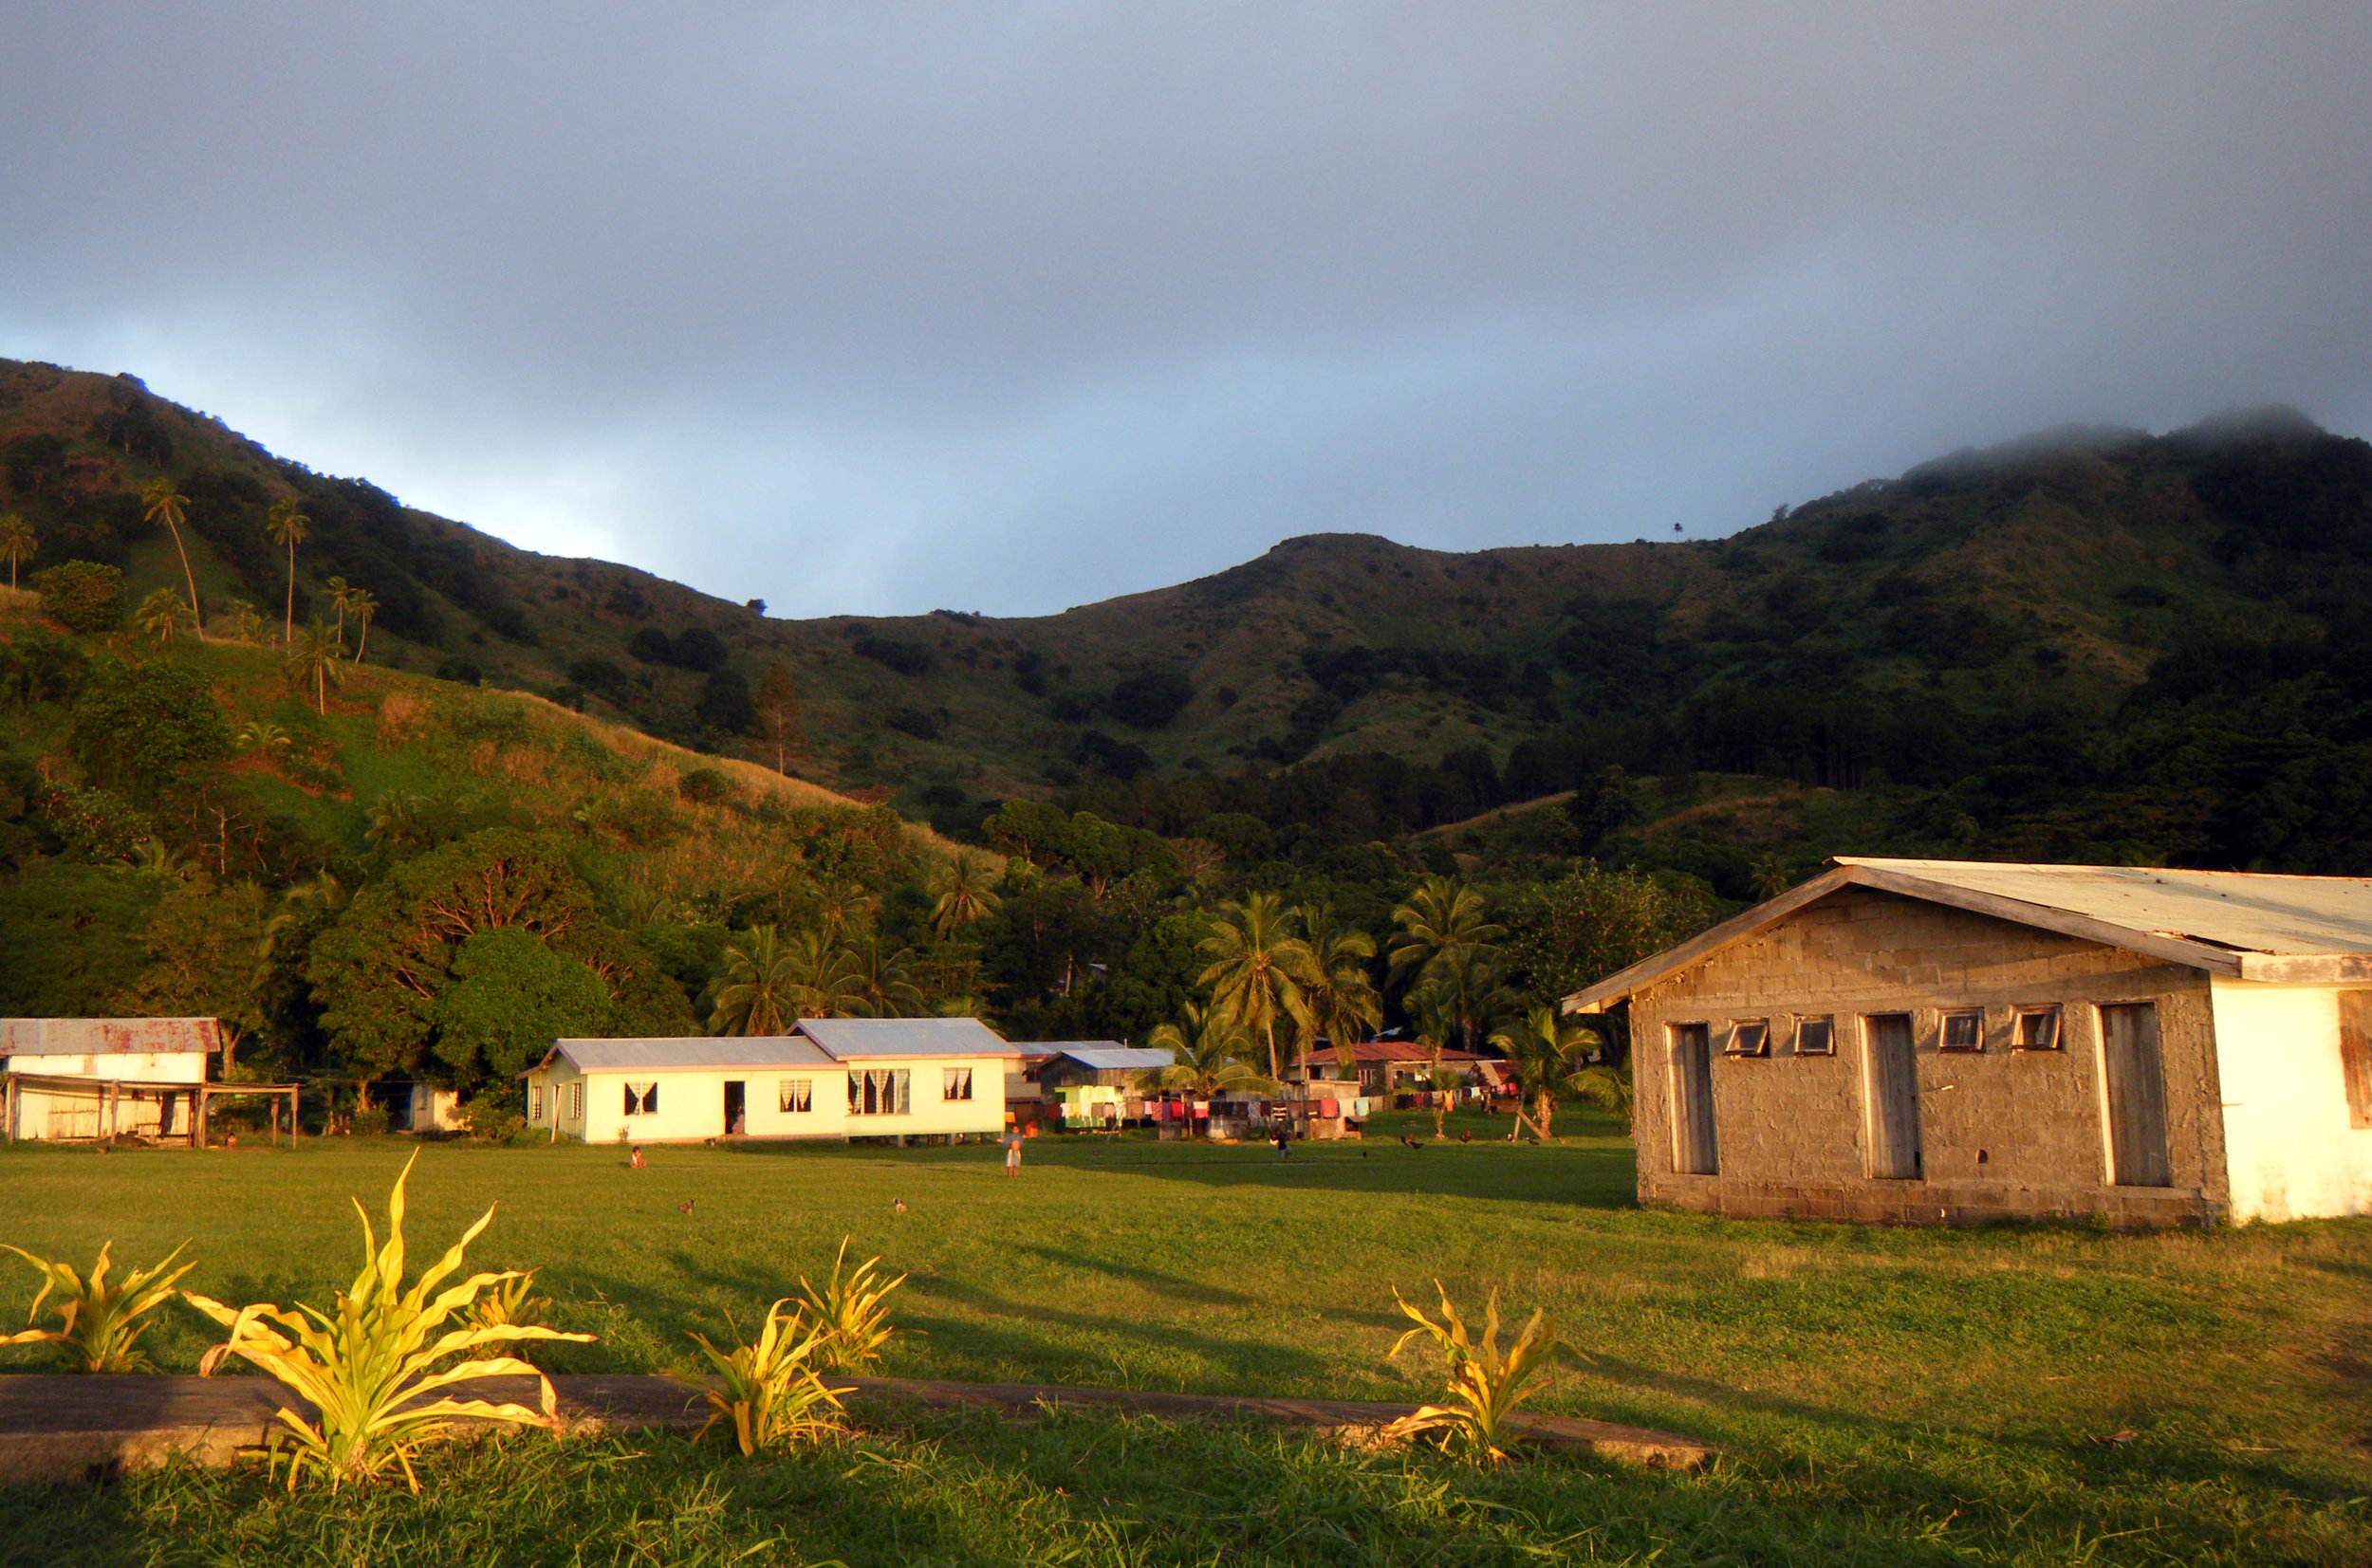
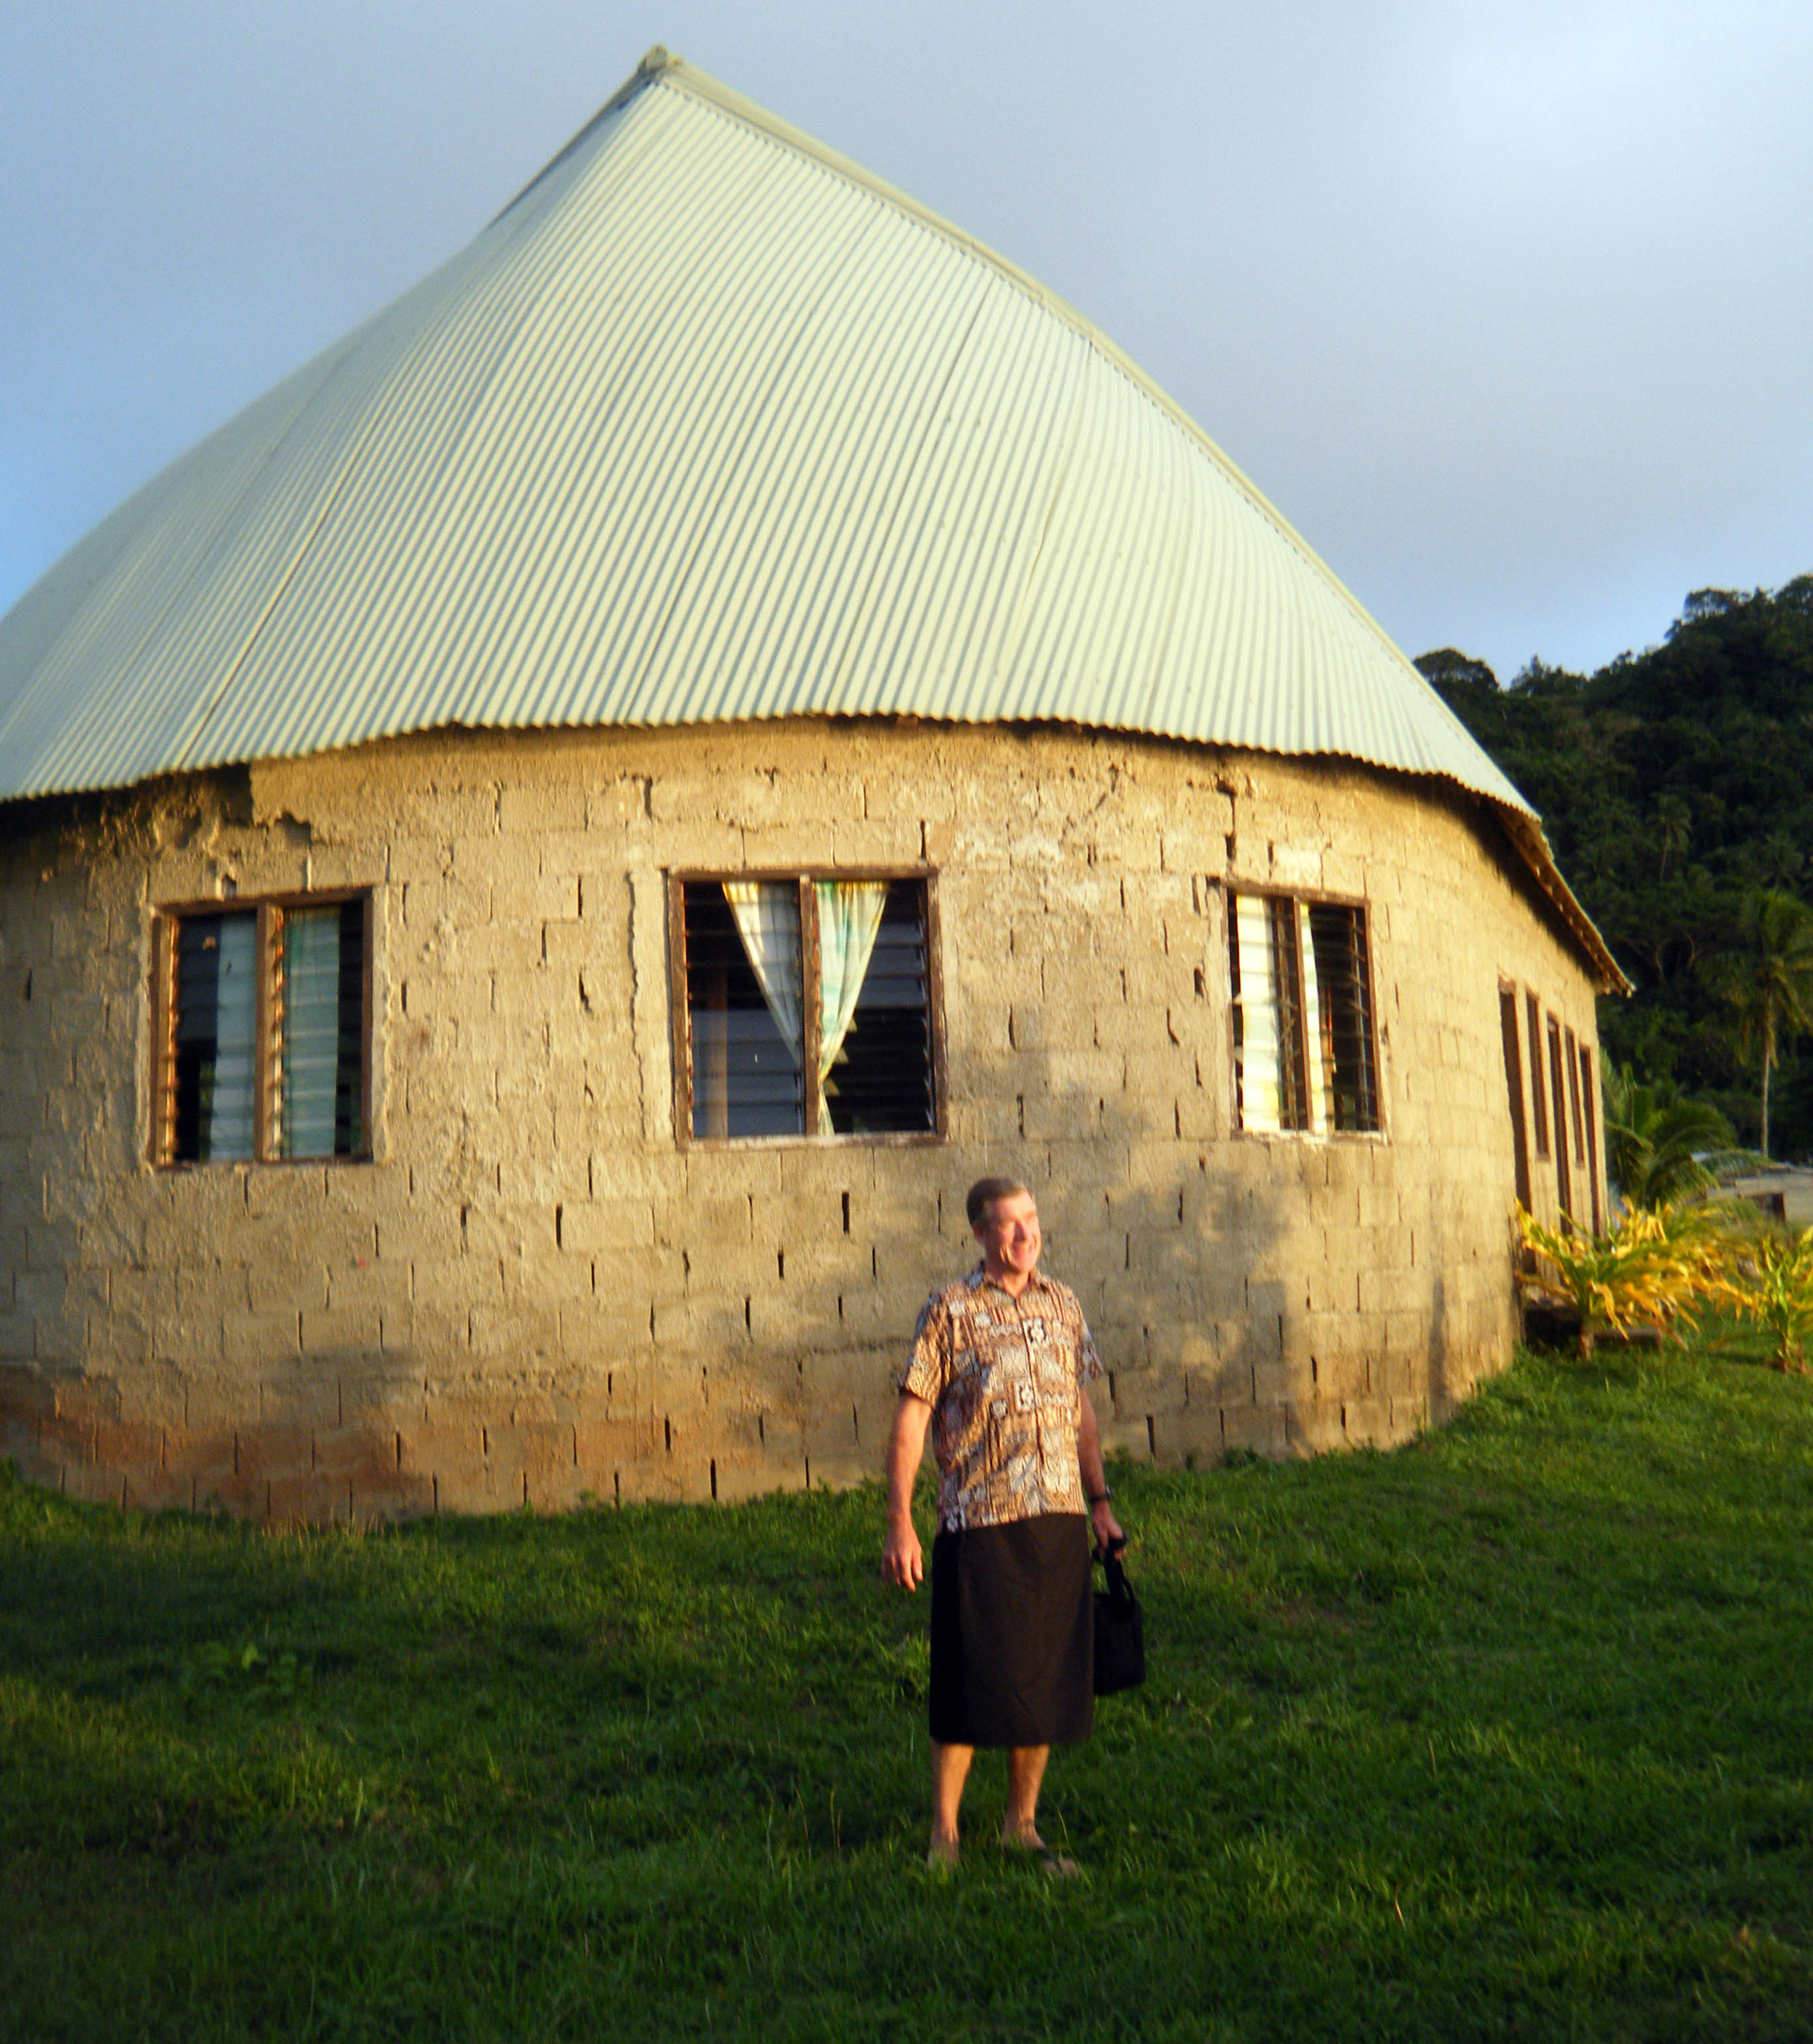
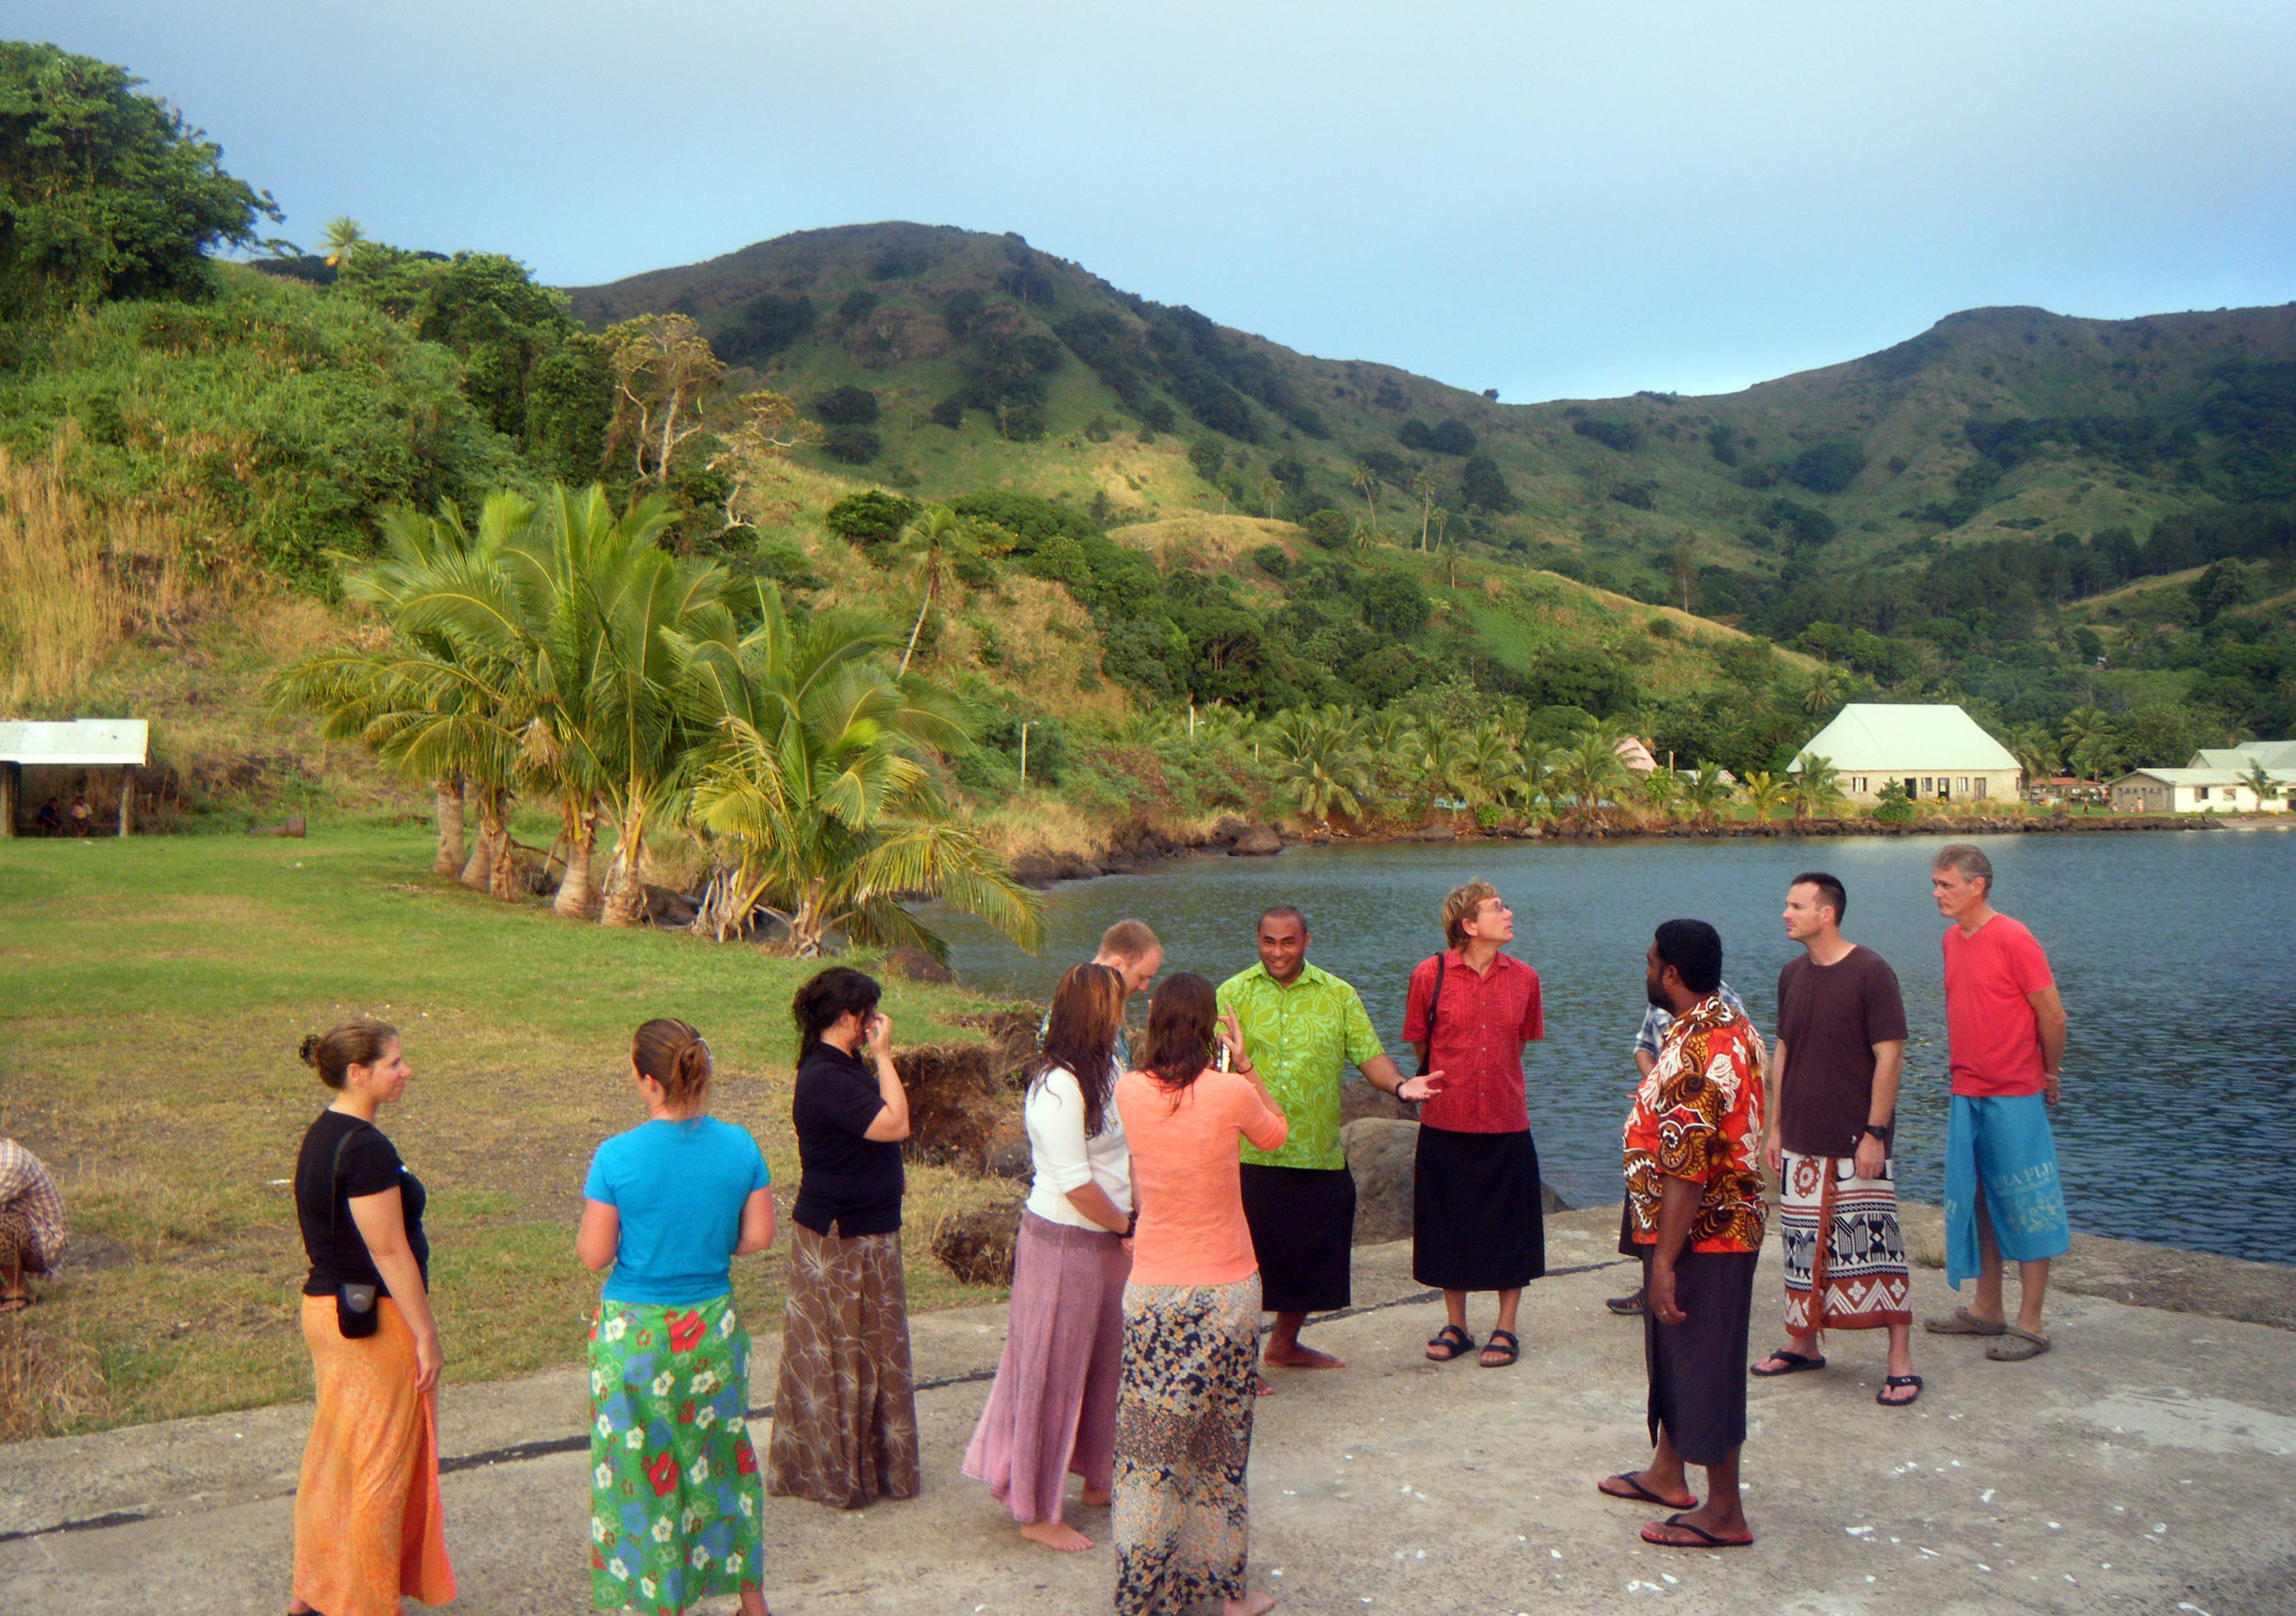
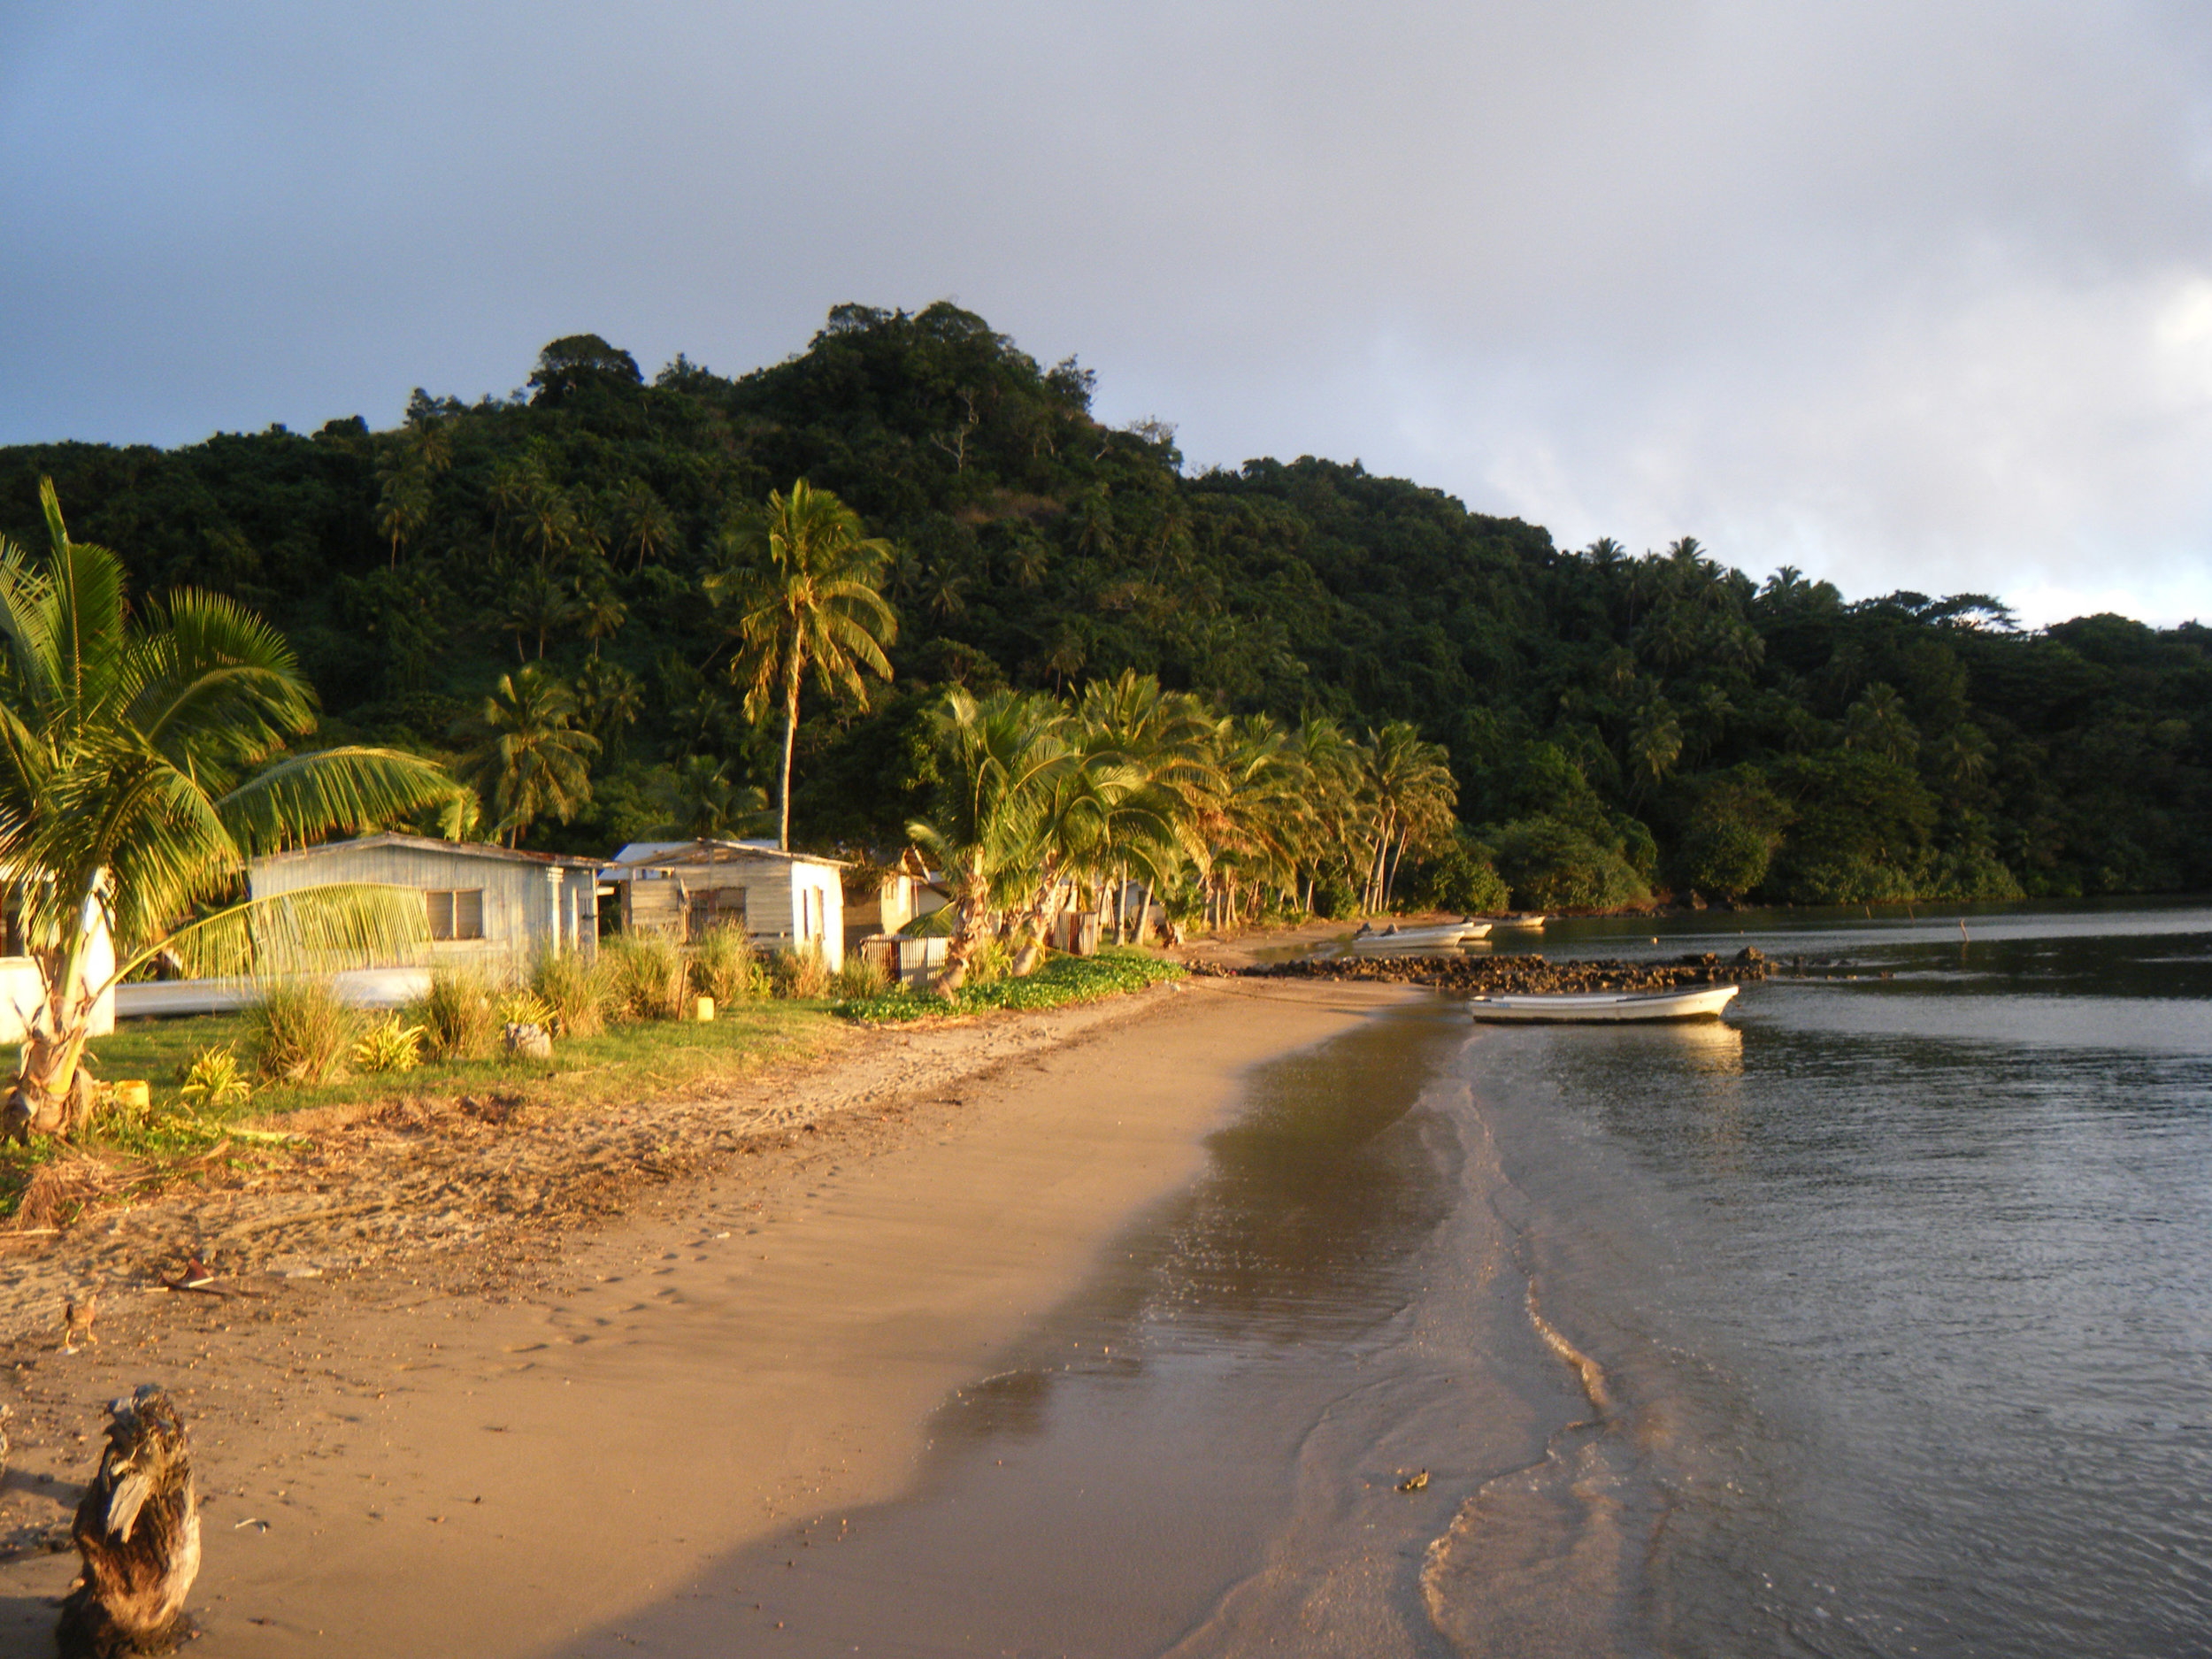
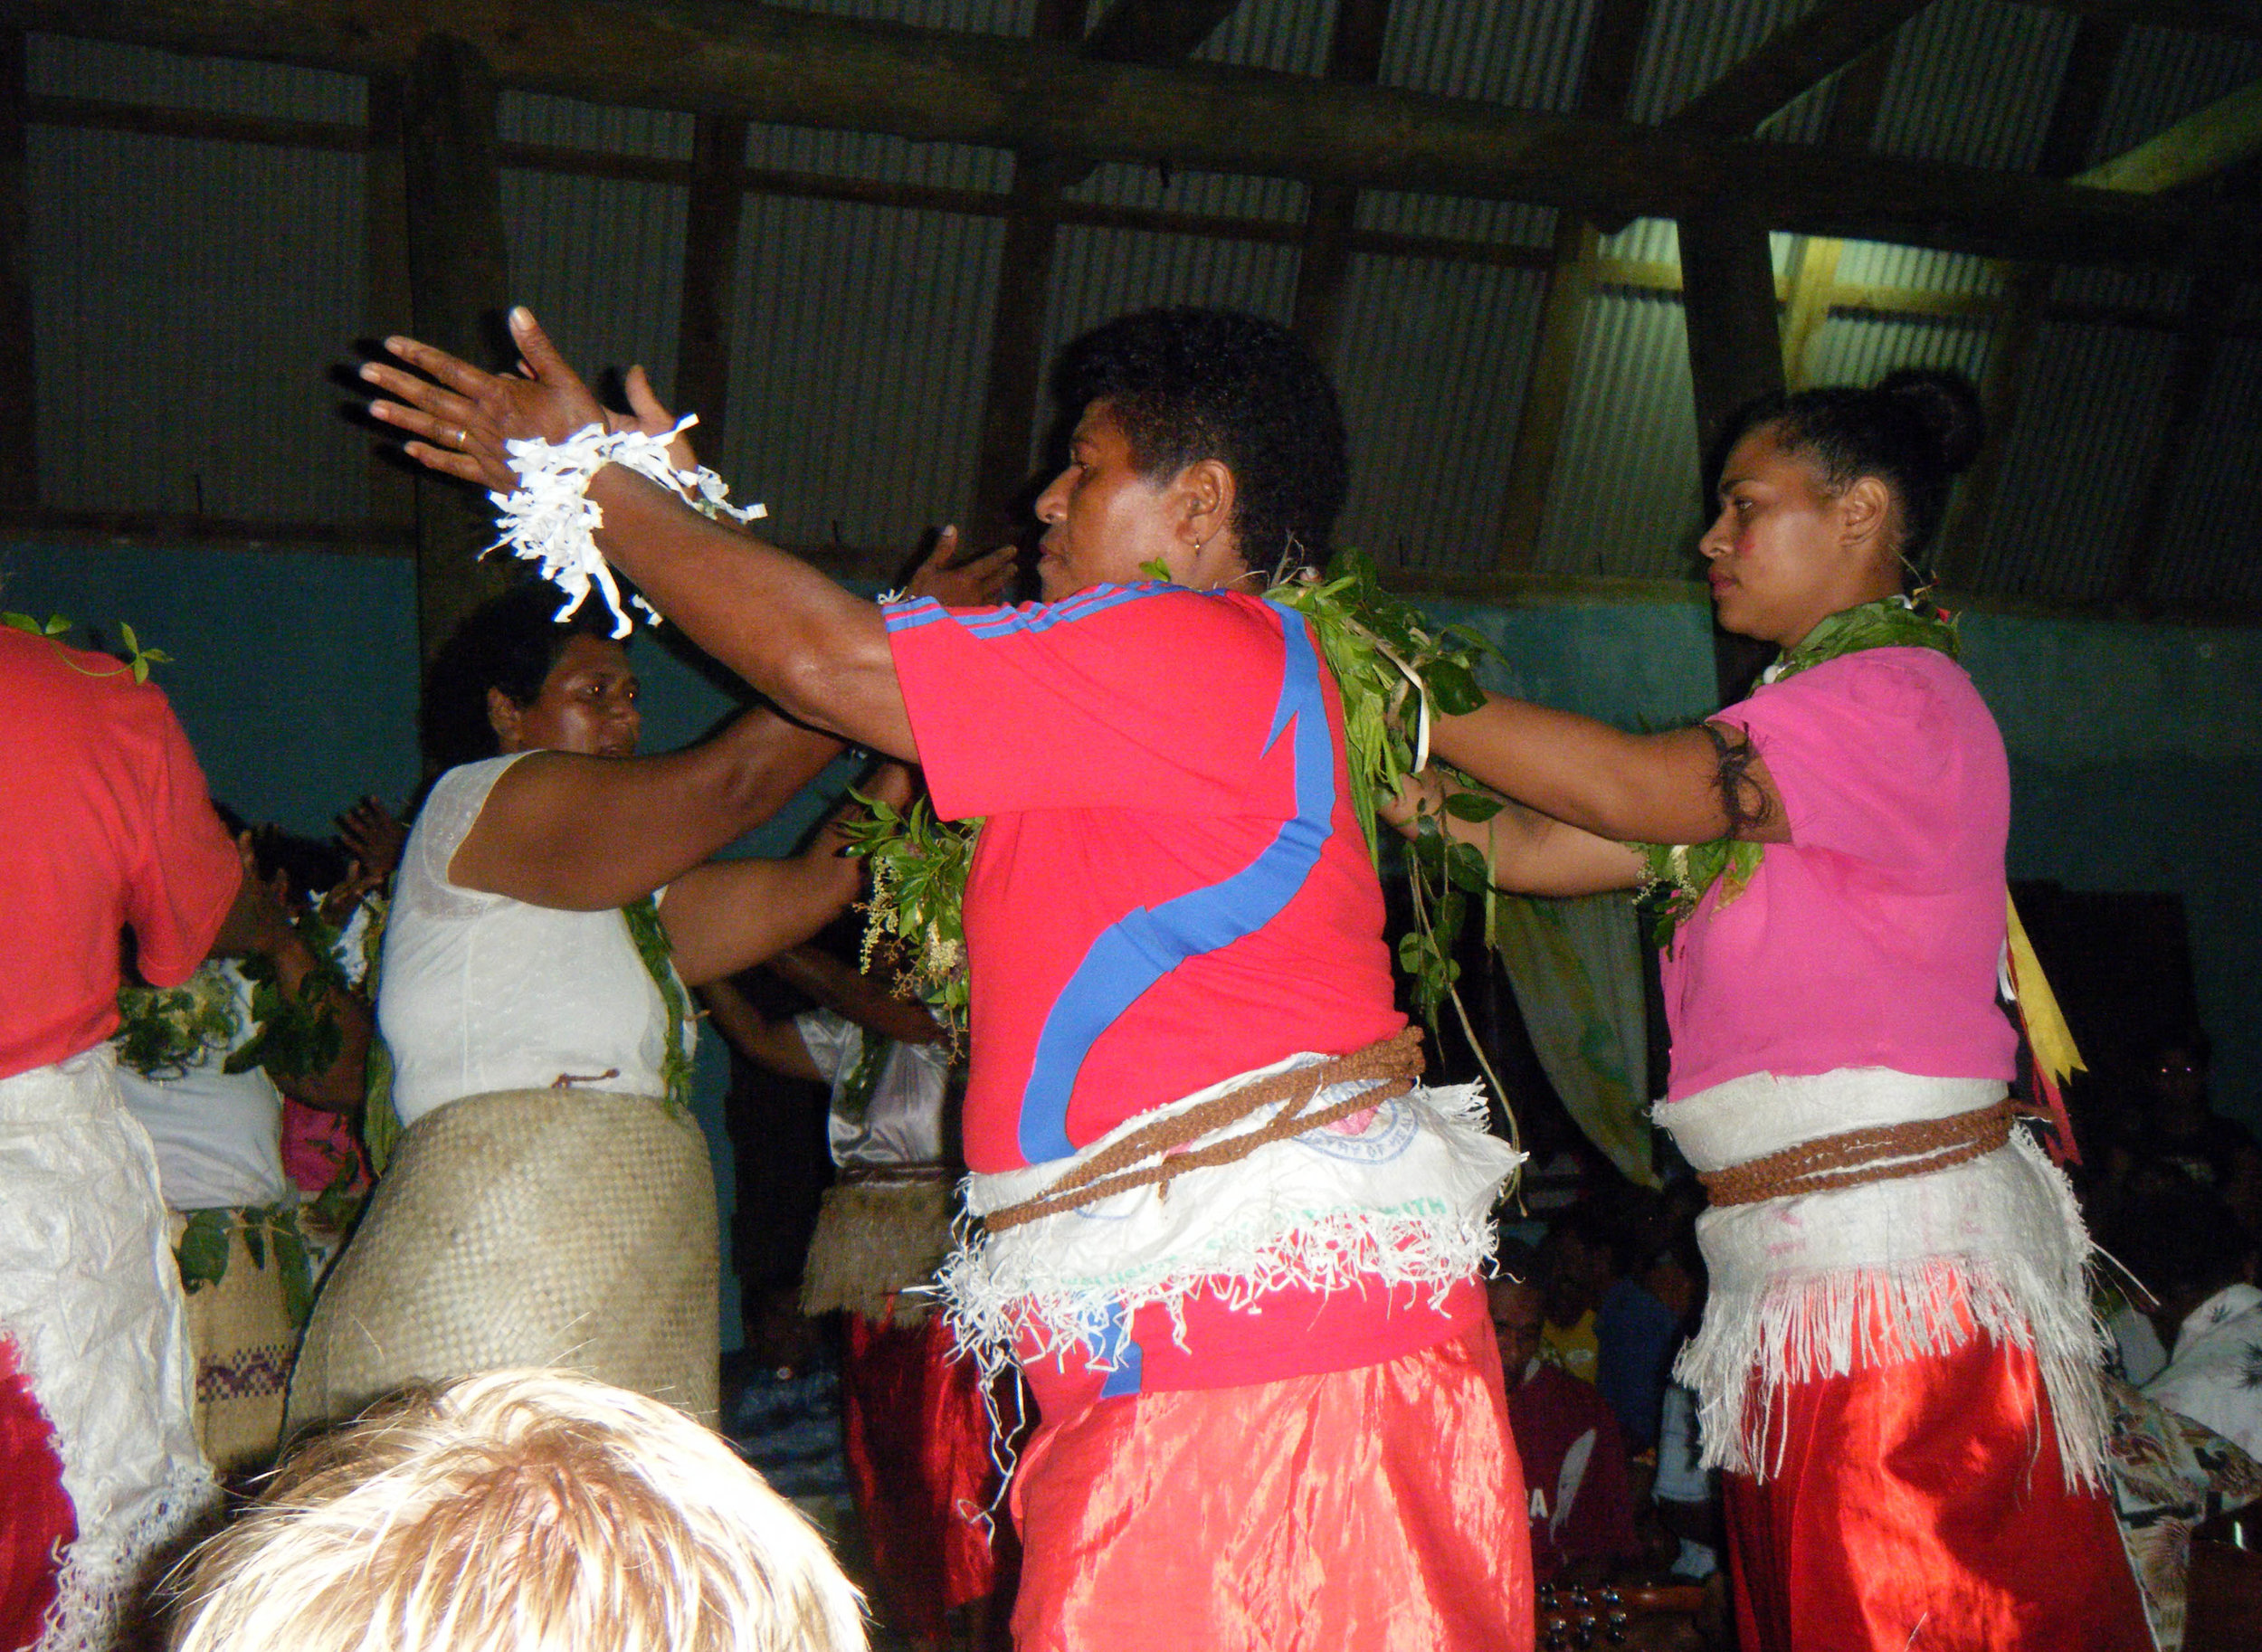
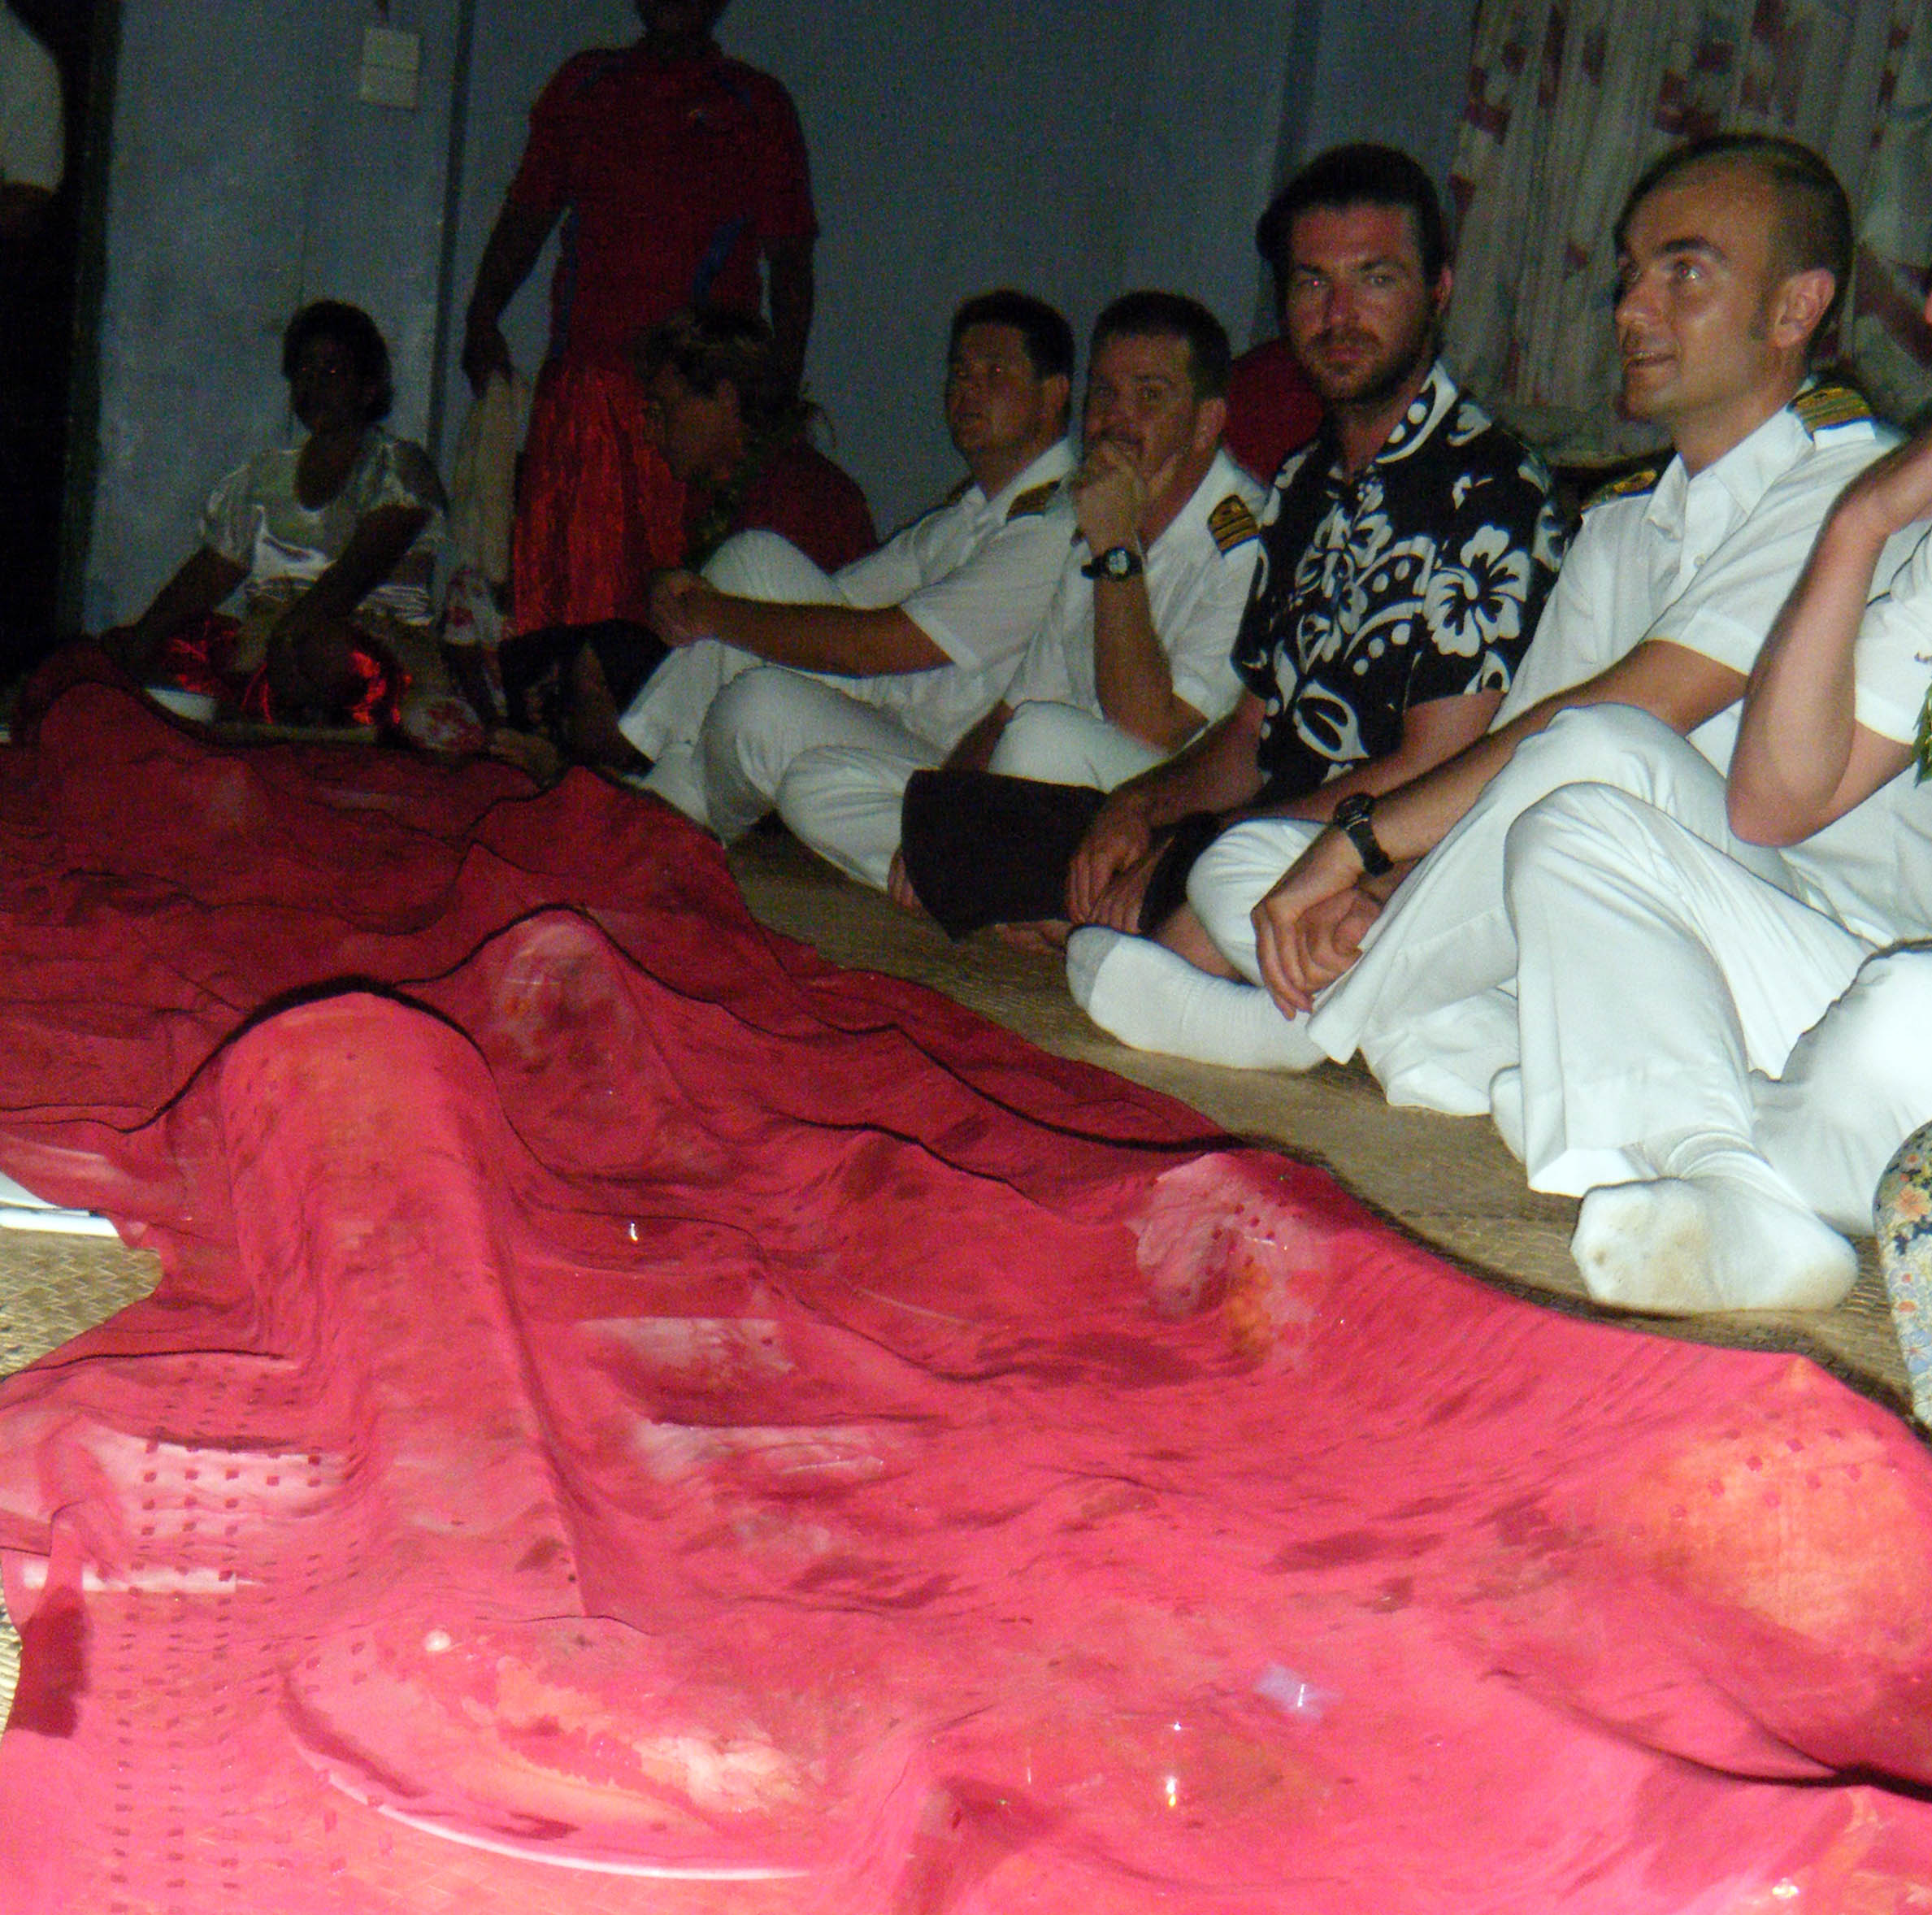
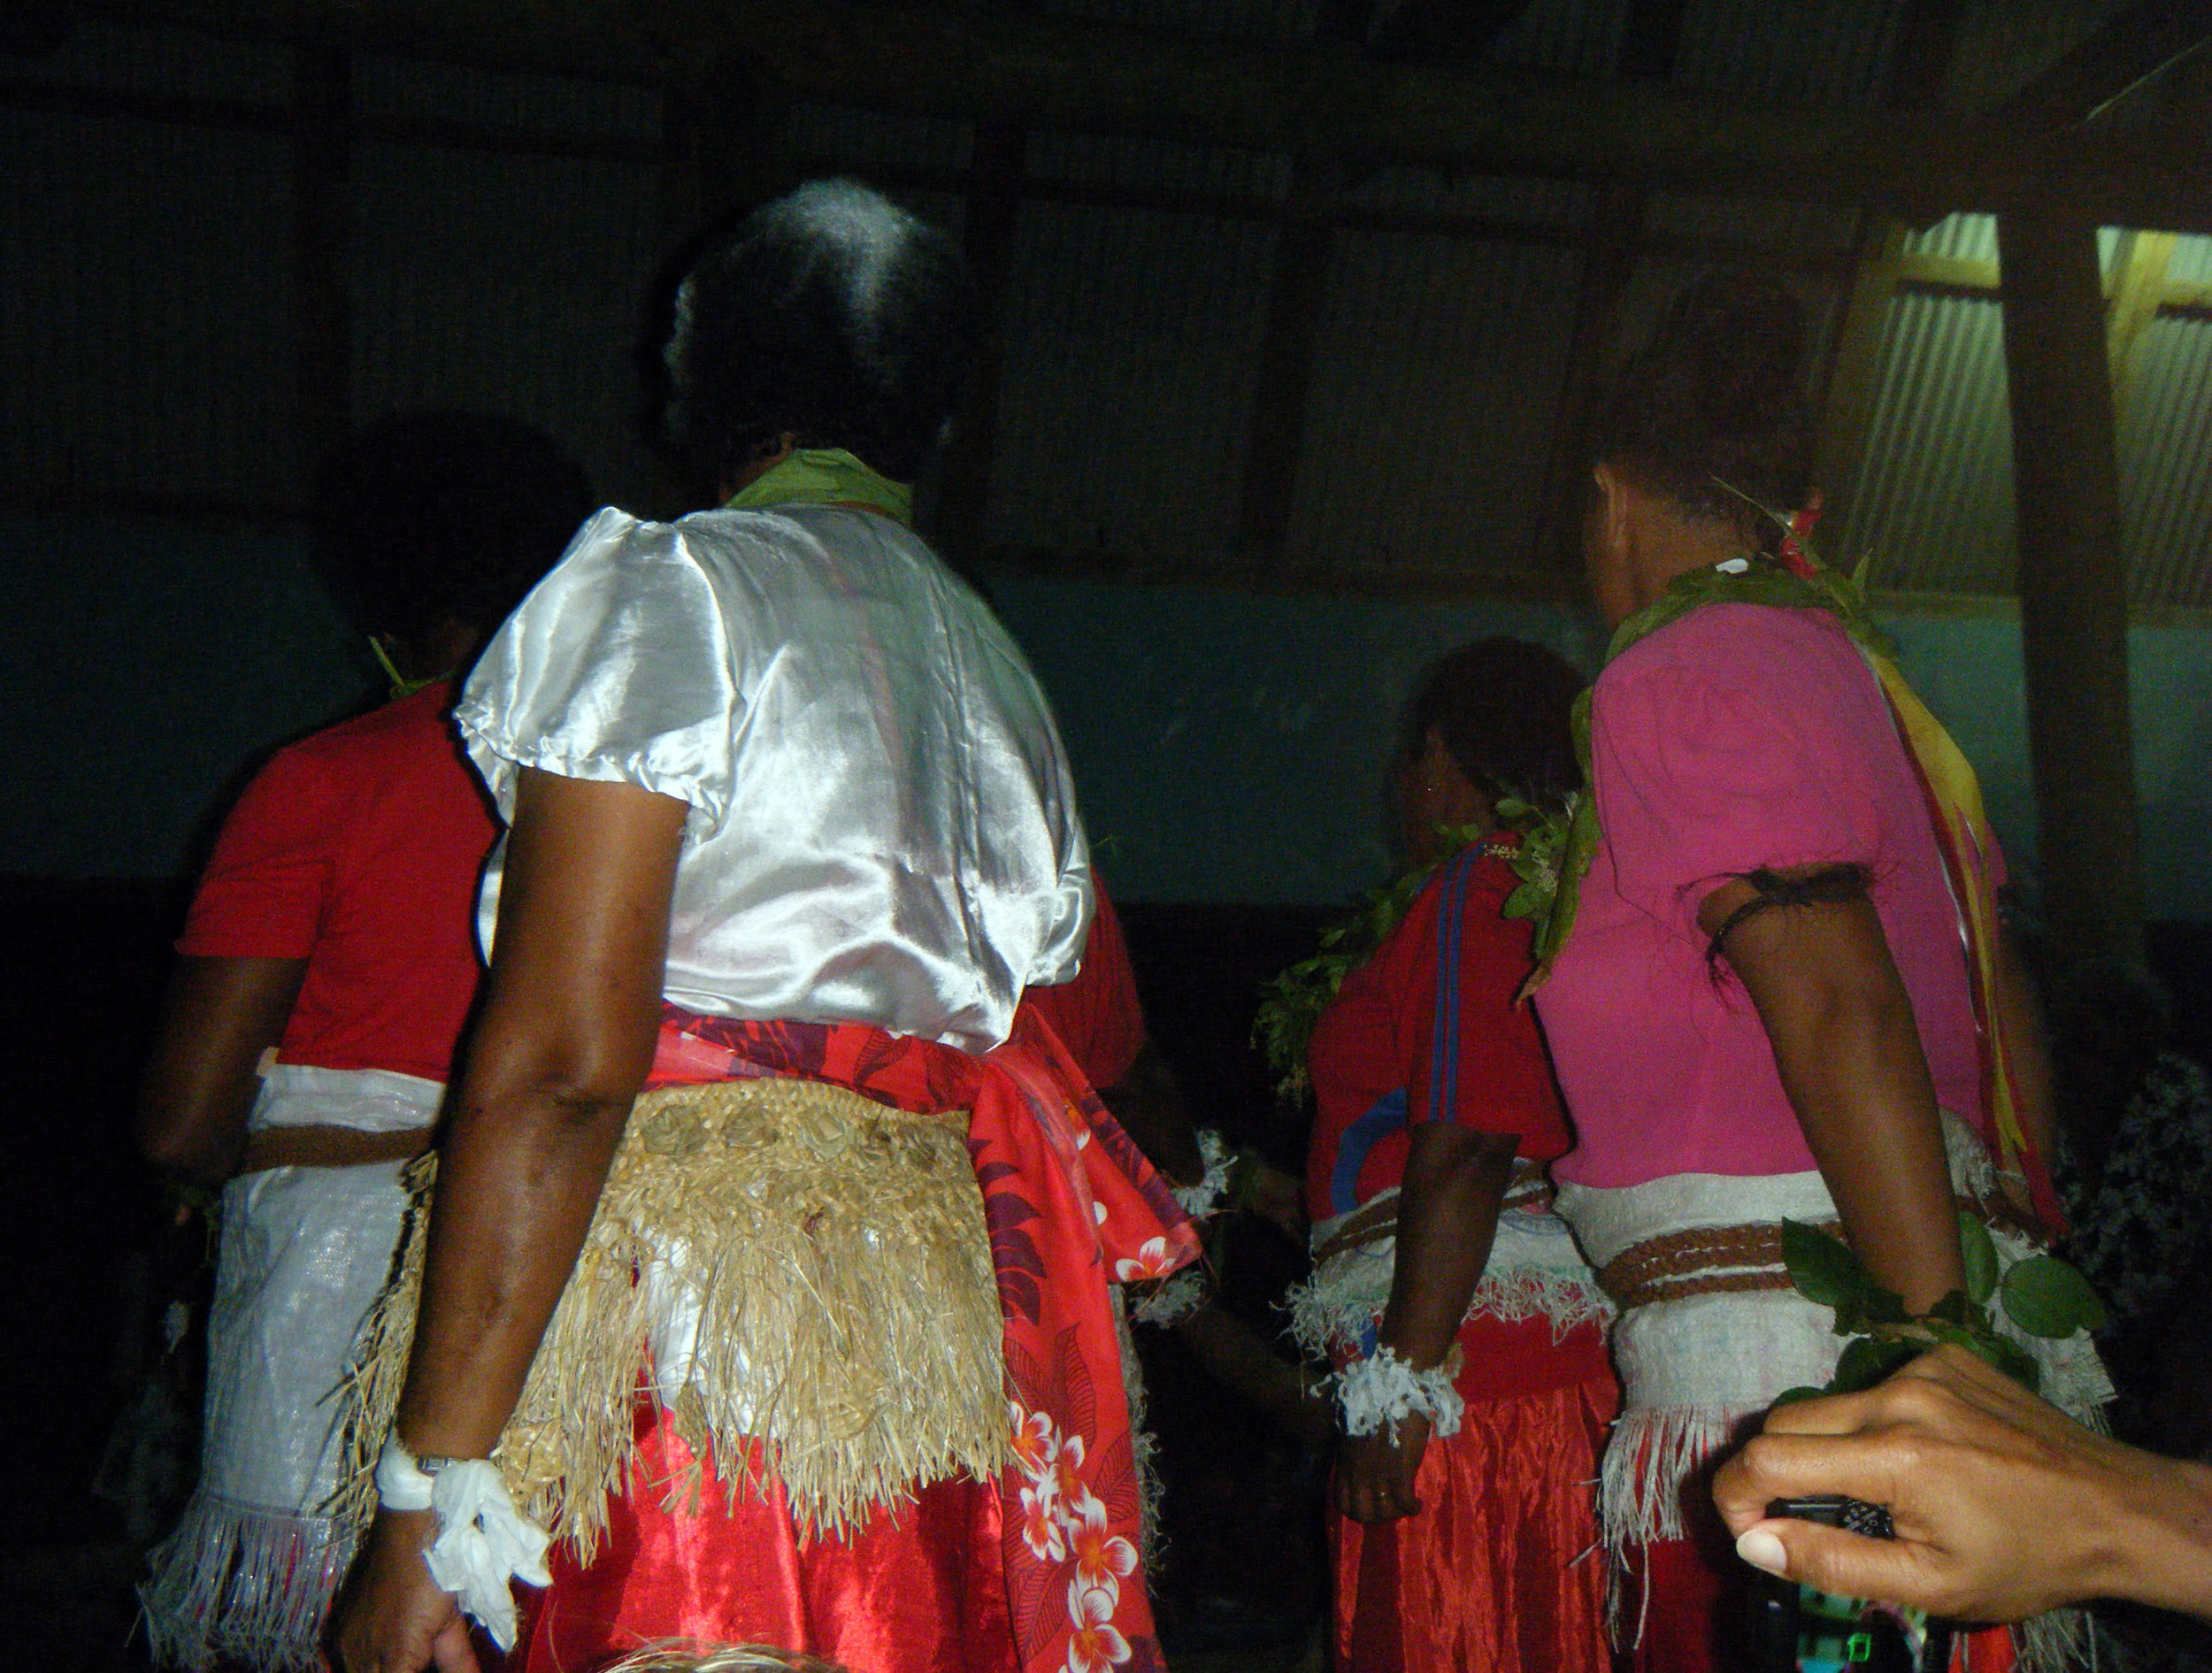
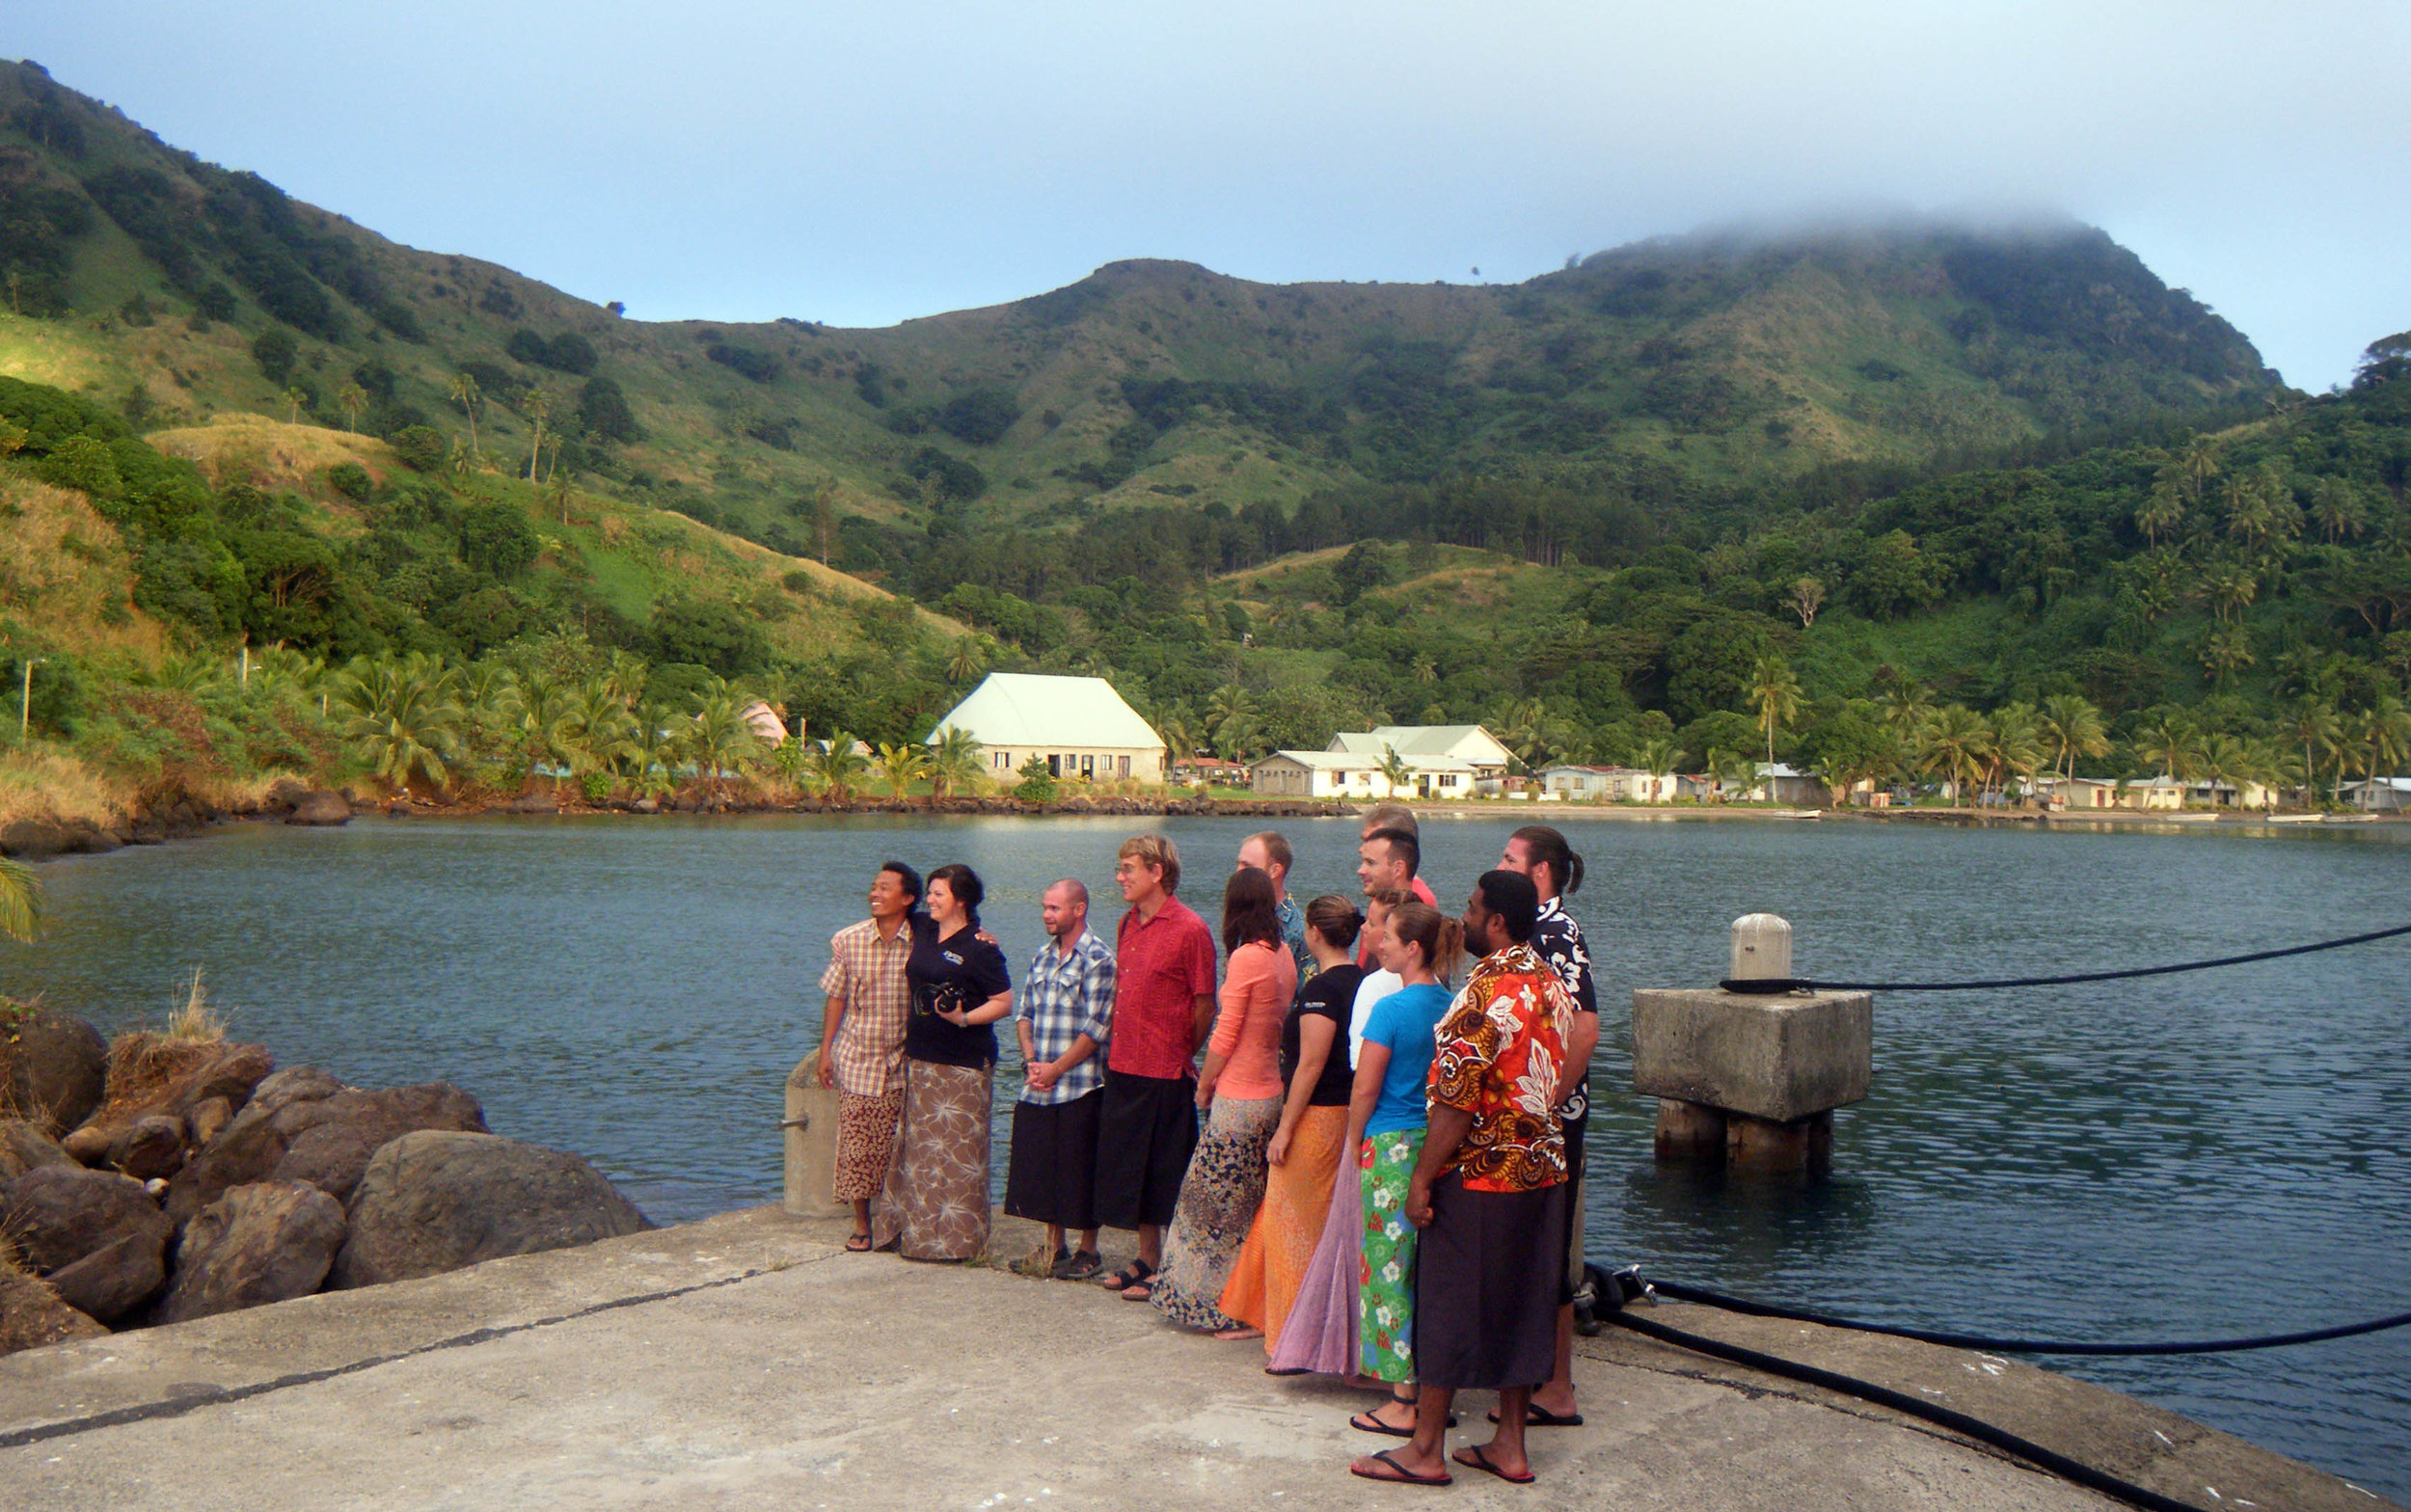
Below I have posted some shots of our land excursions (namely to drink kava with friendly locals).


