

Pocillopora damicornis long-term temperature experiment.

In this experiment, I took corals from an upwelling site in South Taiwan known as “Houbihu” (see adjacent map with temperature plot) and exposed them to either a control temperature of 26.5°C or an elevated one of 30°C for nine months. In fact, I had intended for this to be a “bleaching” experiment, as 30°C is higher than the mean annual summer temperature in Nanwan Bay, Taiwan (where Houbihu is located); however, all corals ultimately acclimated! These results were first published in this 2013 Coral Reefs manuscript. If you are interested in the transcriptomic data that emerged from this project (2- and 36-weeks only), please see this manuscript, as well as this interactive website. Upon later analyzing the proteomes of the same samples whose transcriptomes were also analyzed, we found virtually no congruency between gene expression and protein concentration (as was also documented in another study with Seriatopora hystrix); these results are detailed in this manuscript. Since we cannot reliably use gene expression levels to predict protein behavior in coral or Symbiodinium cells, it is doubtful that I will undertake additional transcriptomic analyses in the future. Unfortunately, I feel the field will be slow to follow given the large amount invested in NGS and other such transcriptome profiling technologies…..In any event, please read below for more details on this experiment, as well as data files. For a spreadsheet featuring all data (minus the transcriptome data, which can be found on the aforementioned website), please download this file.
TANK CONDITIONS
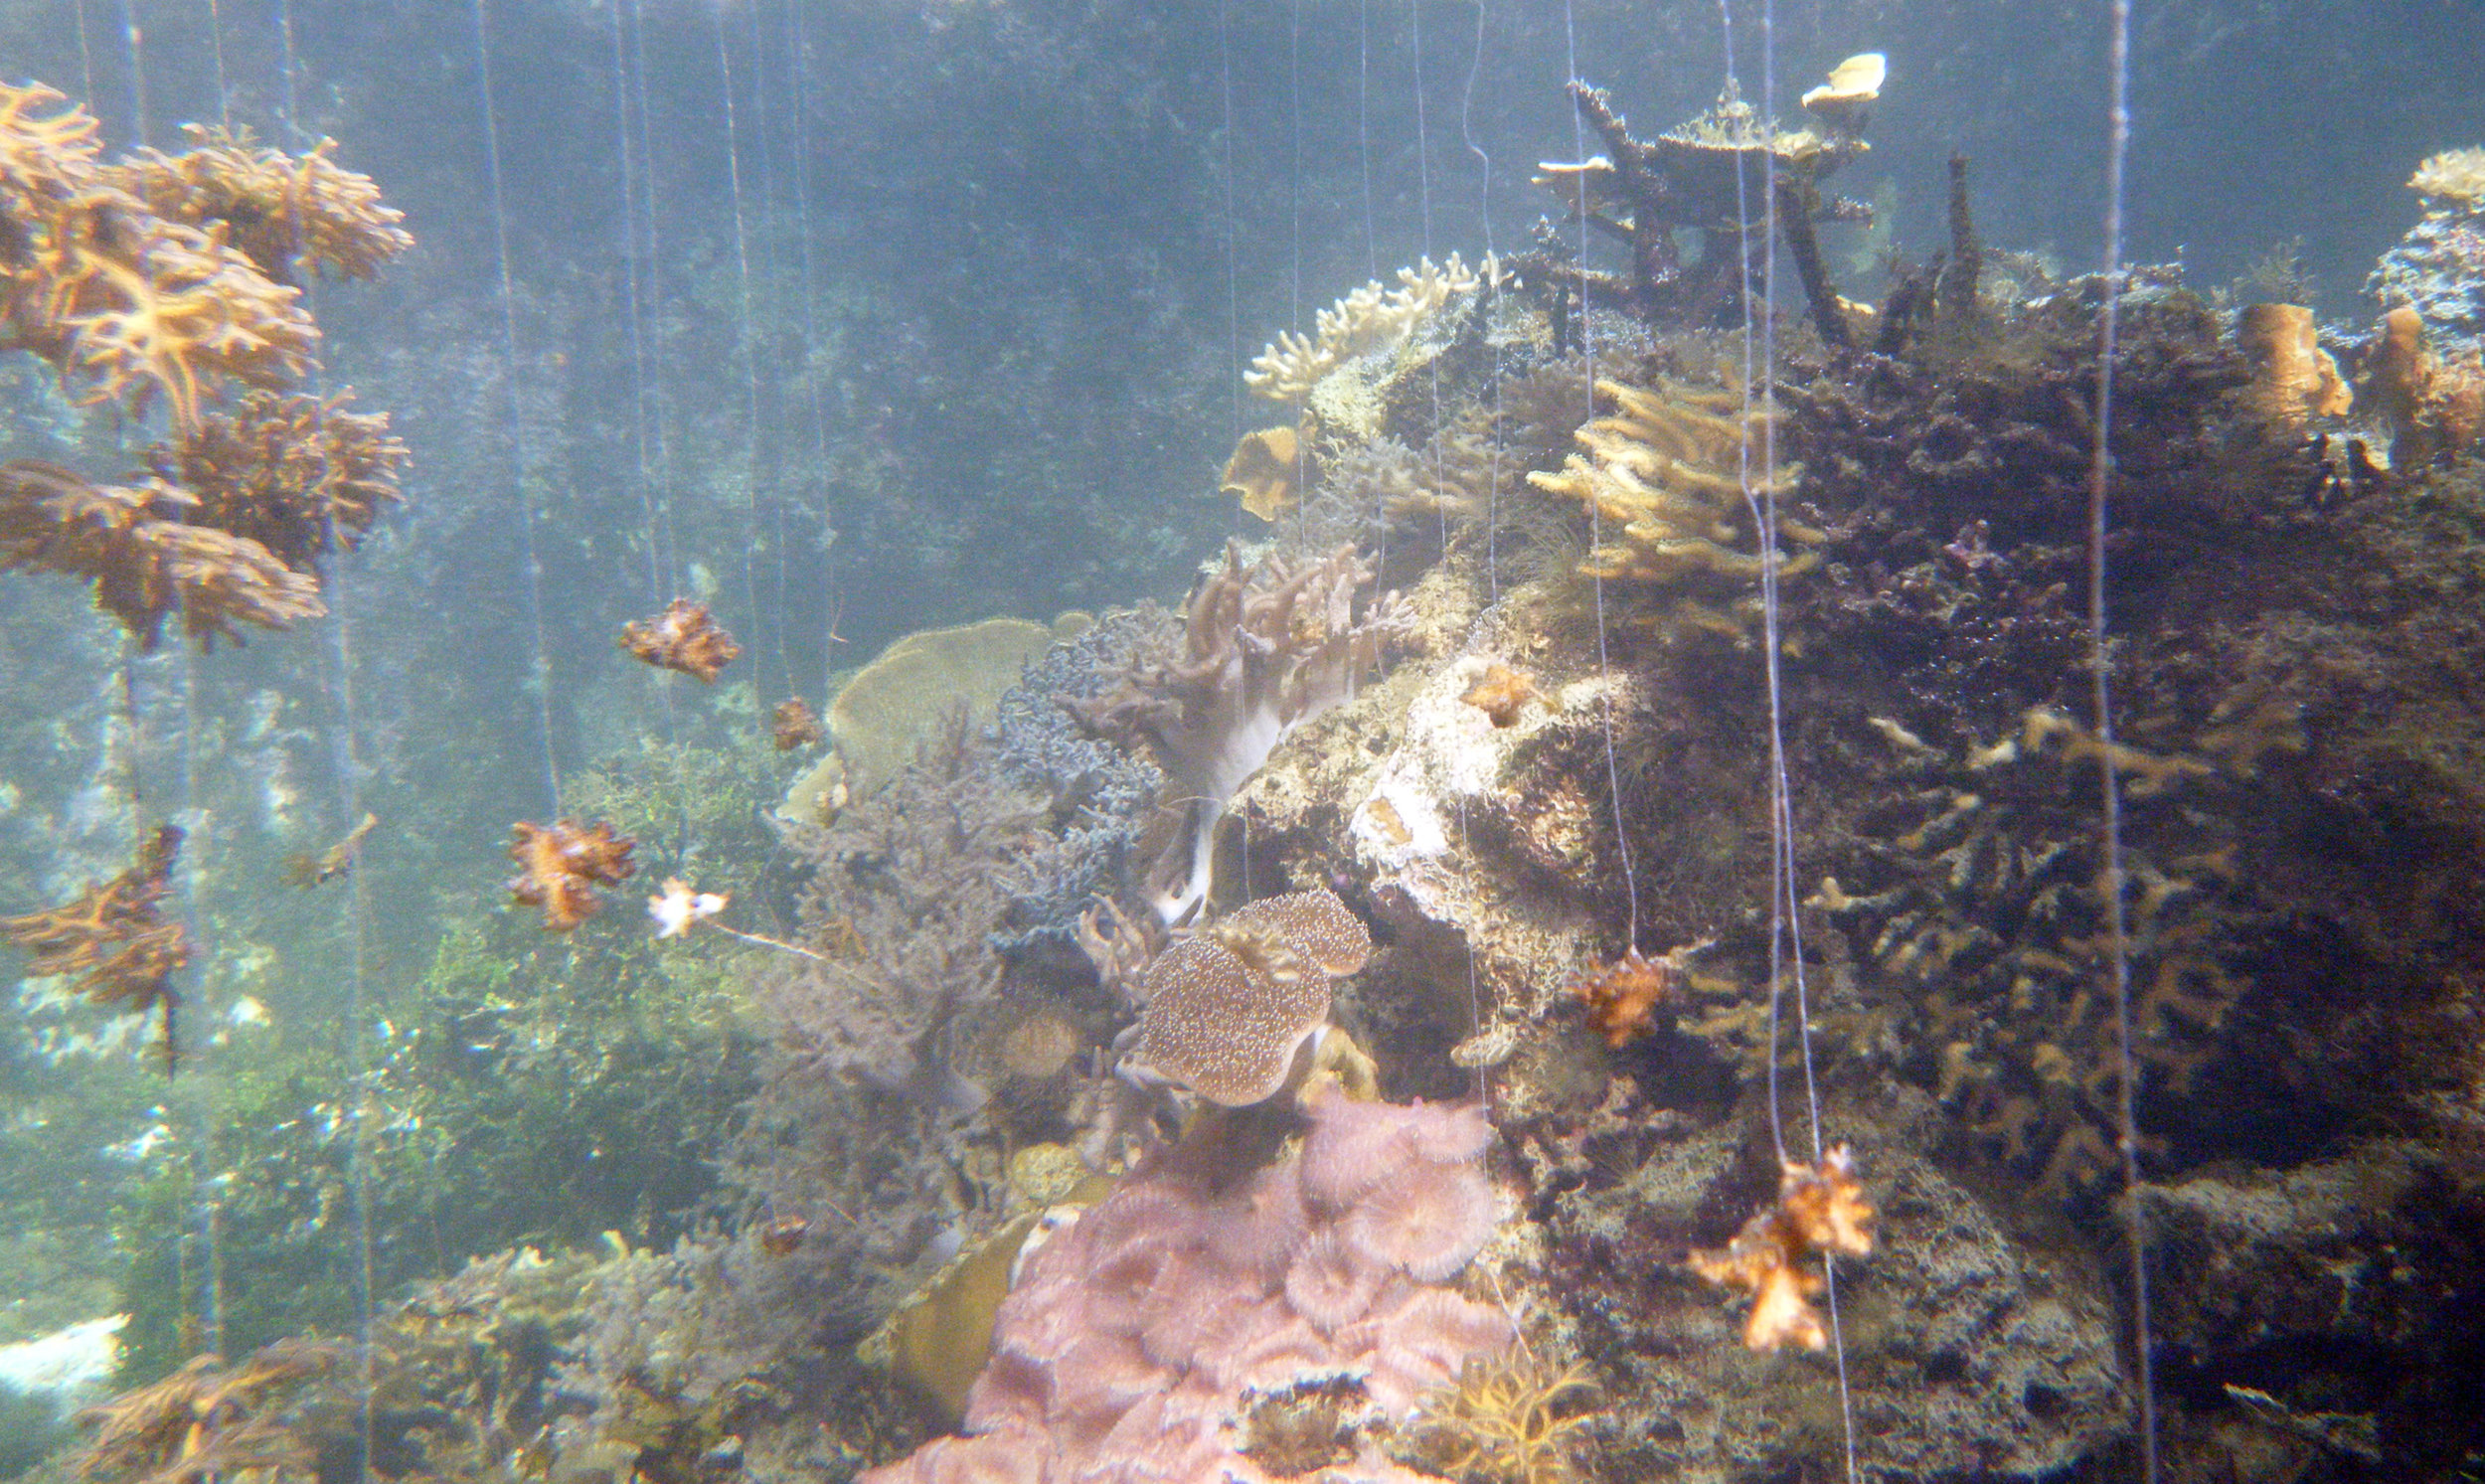
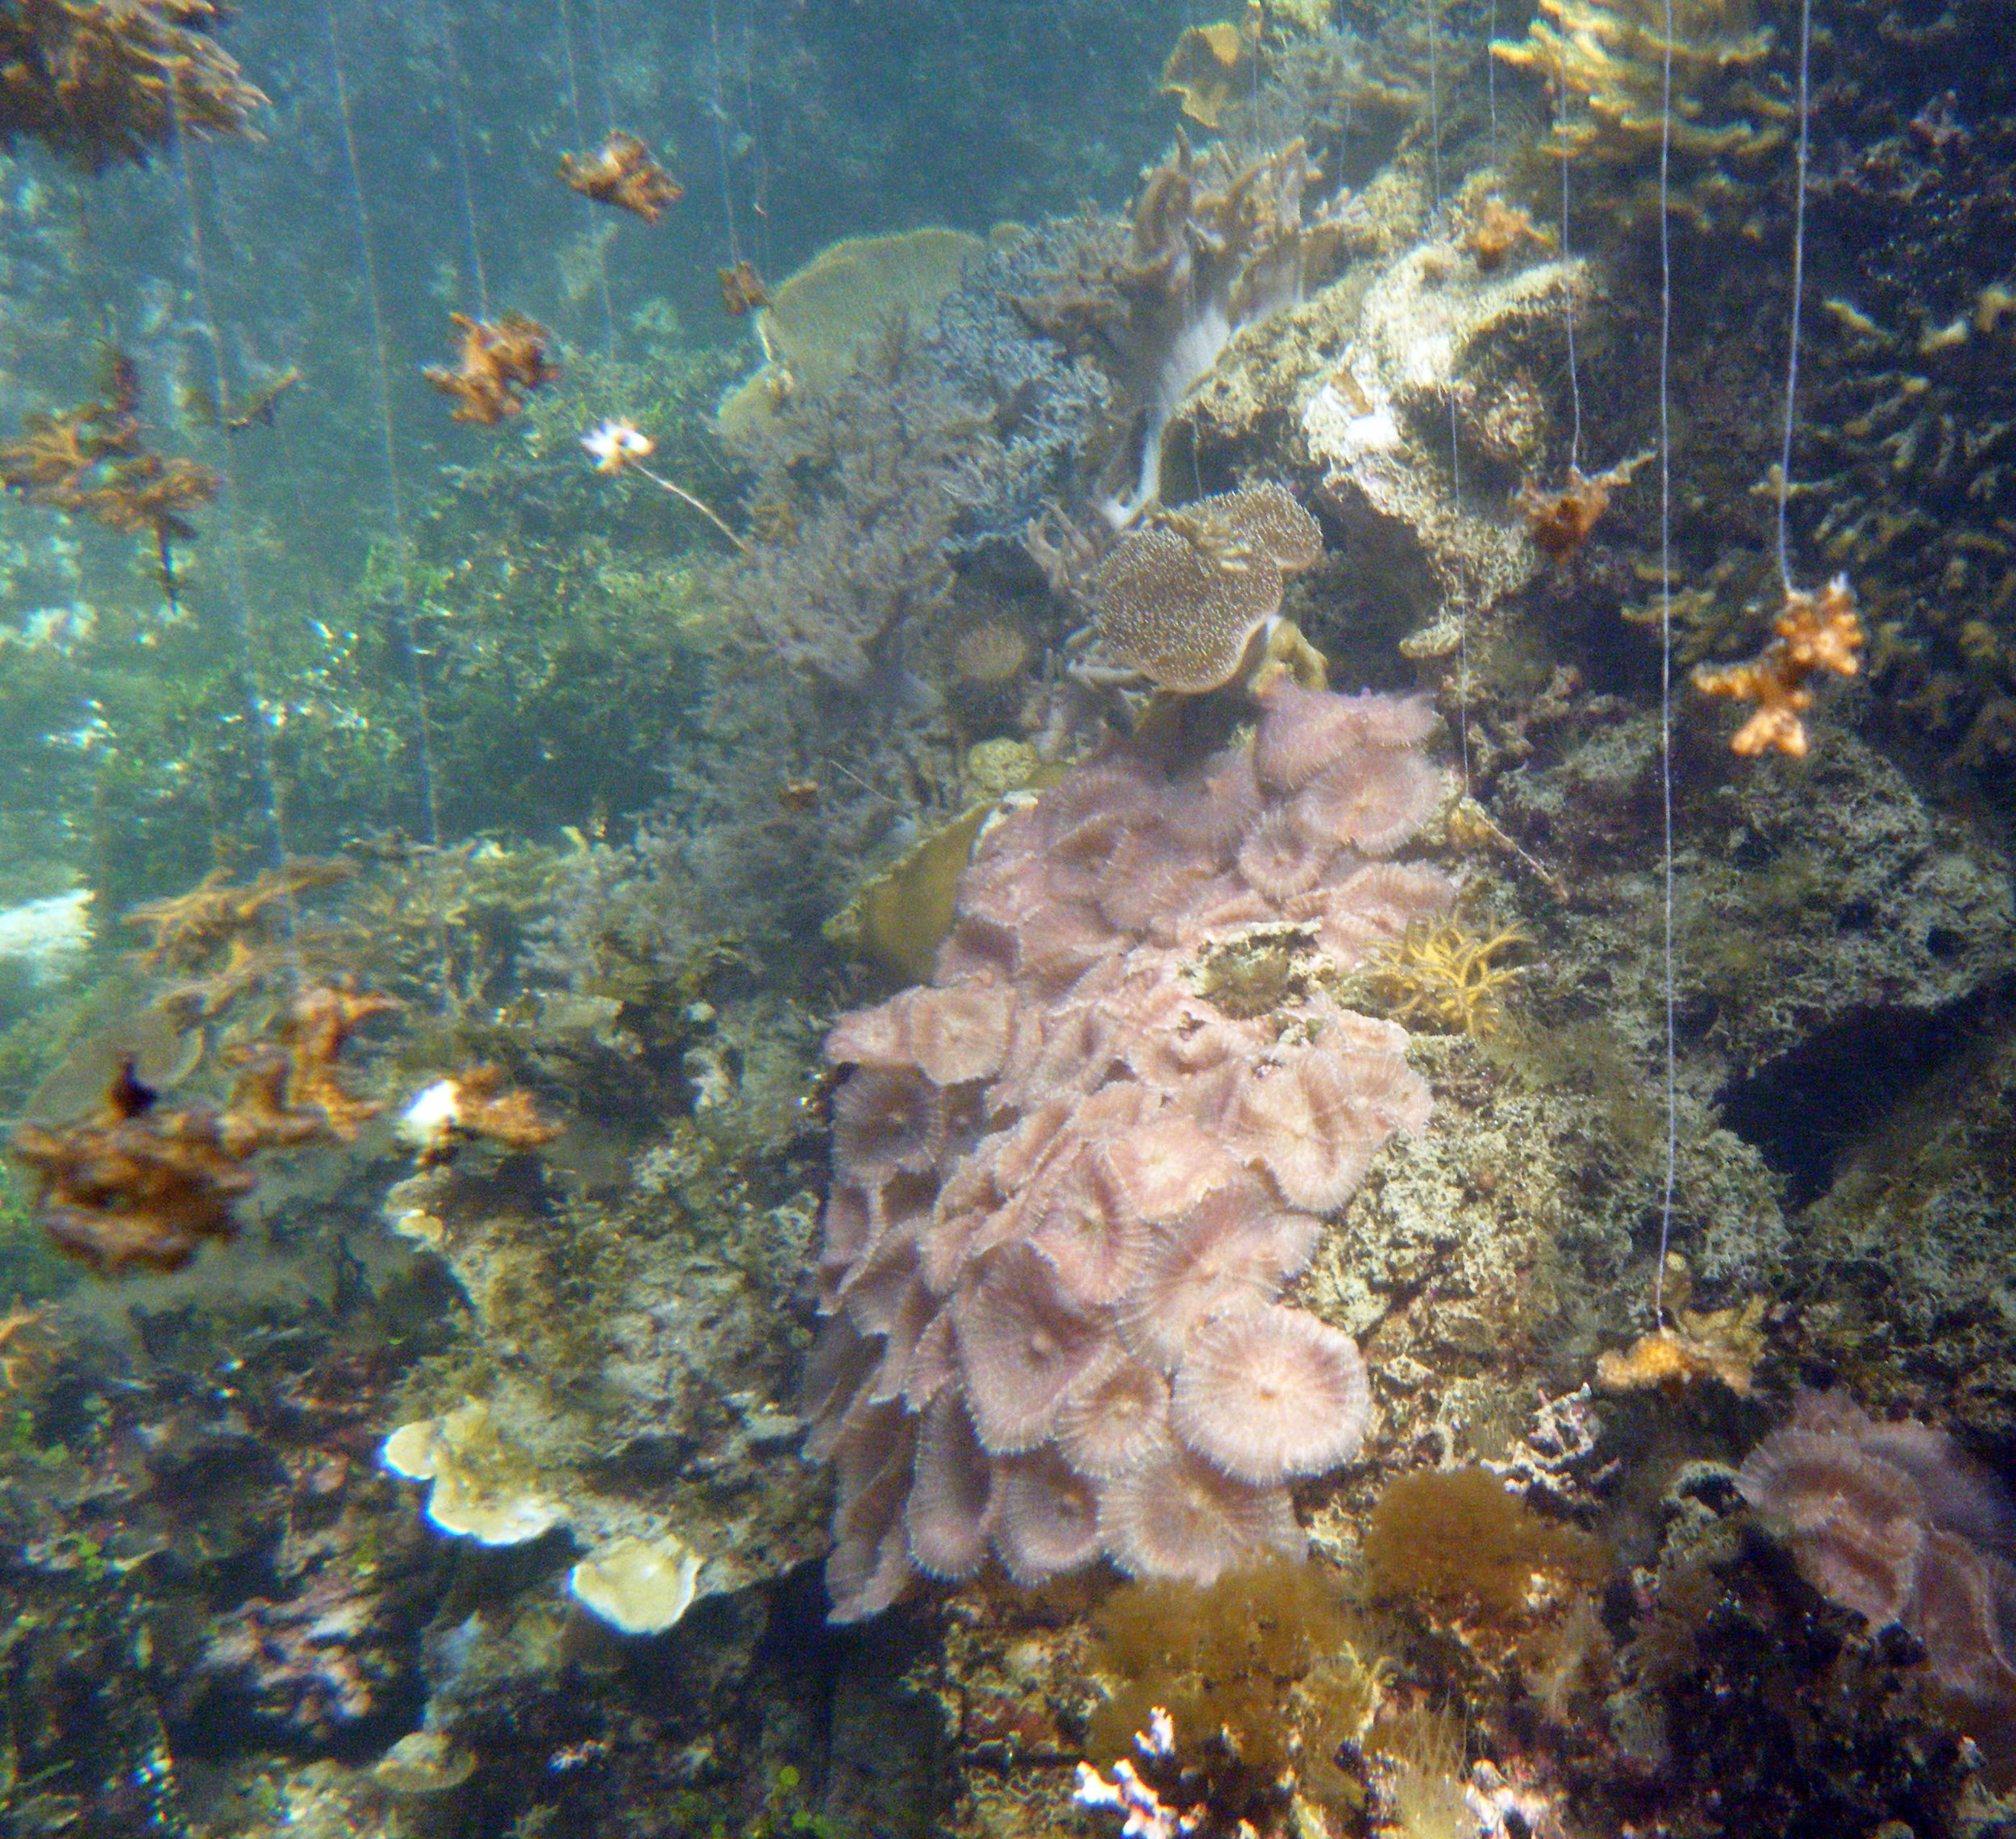
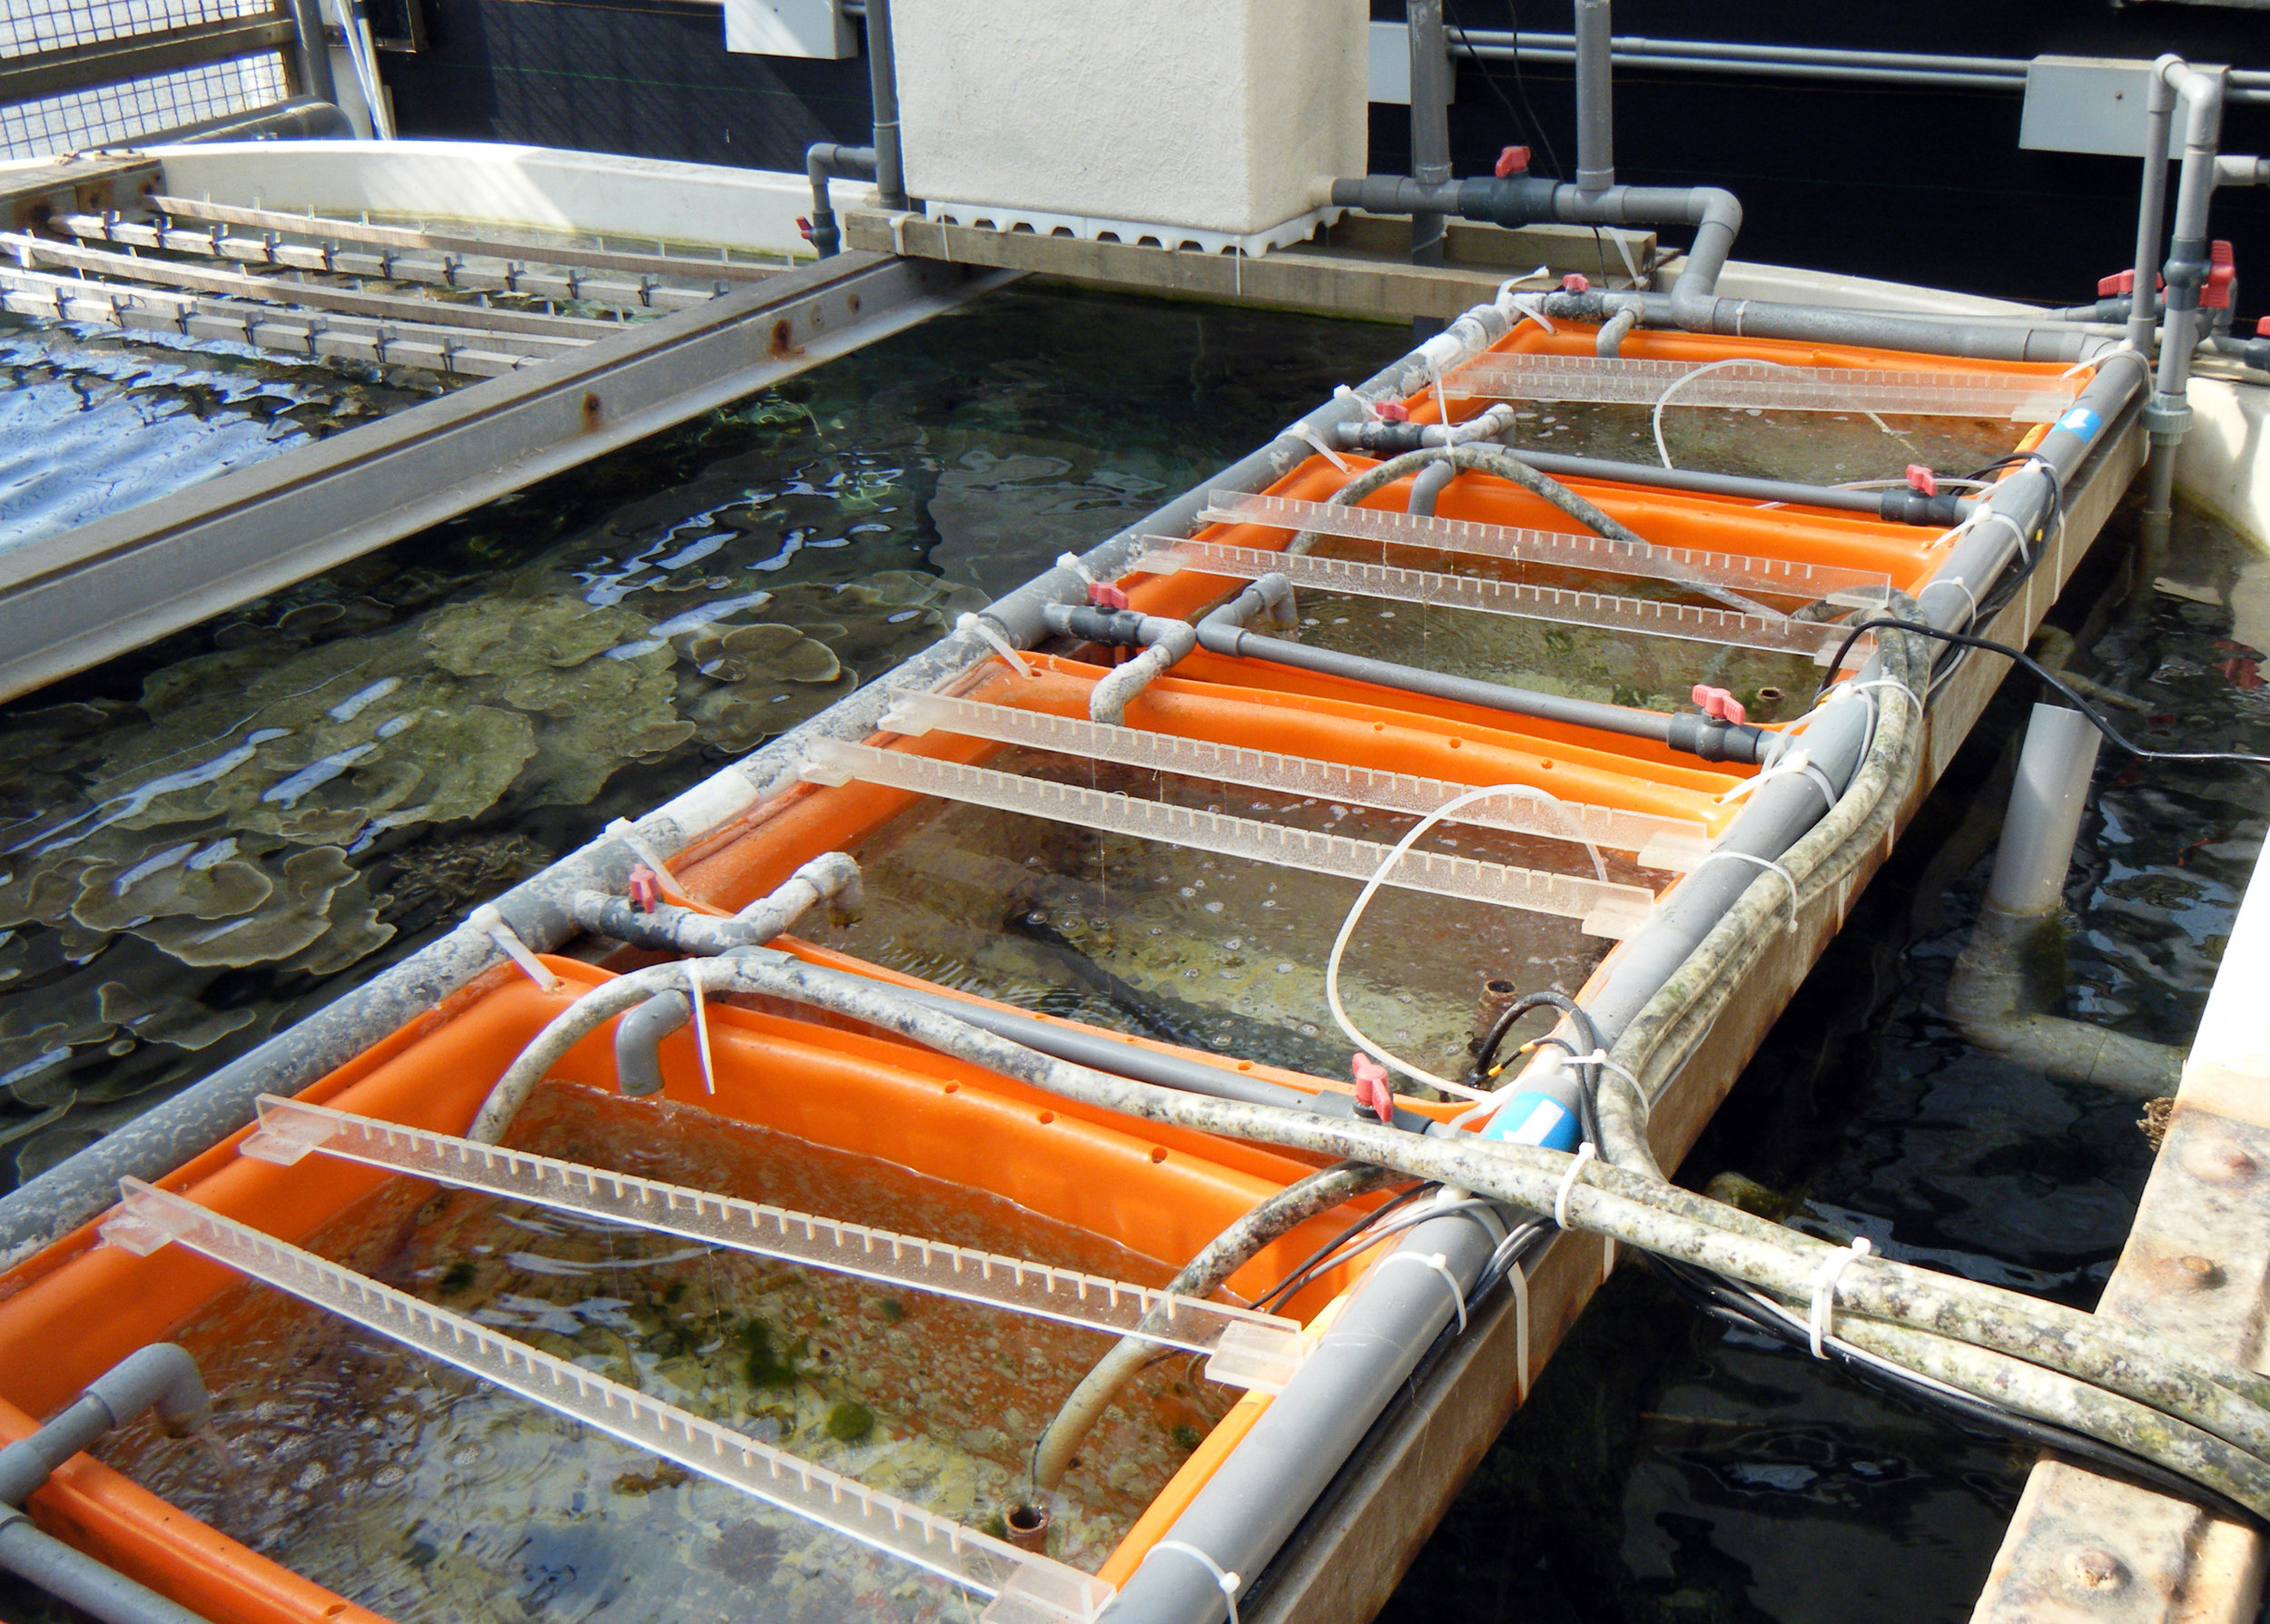
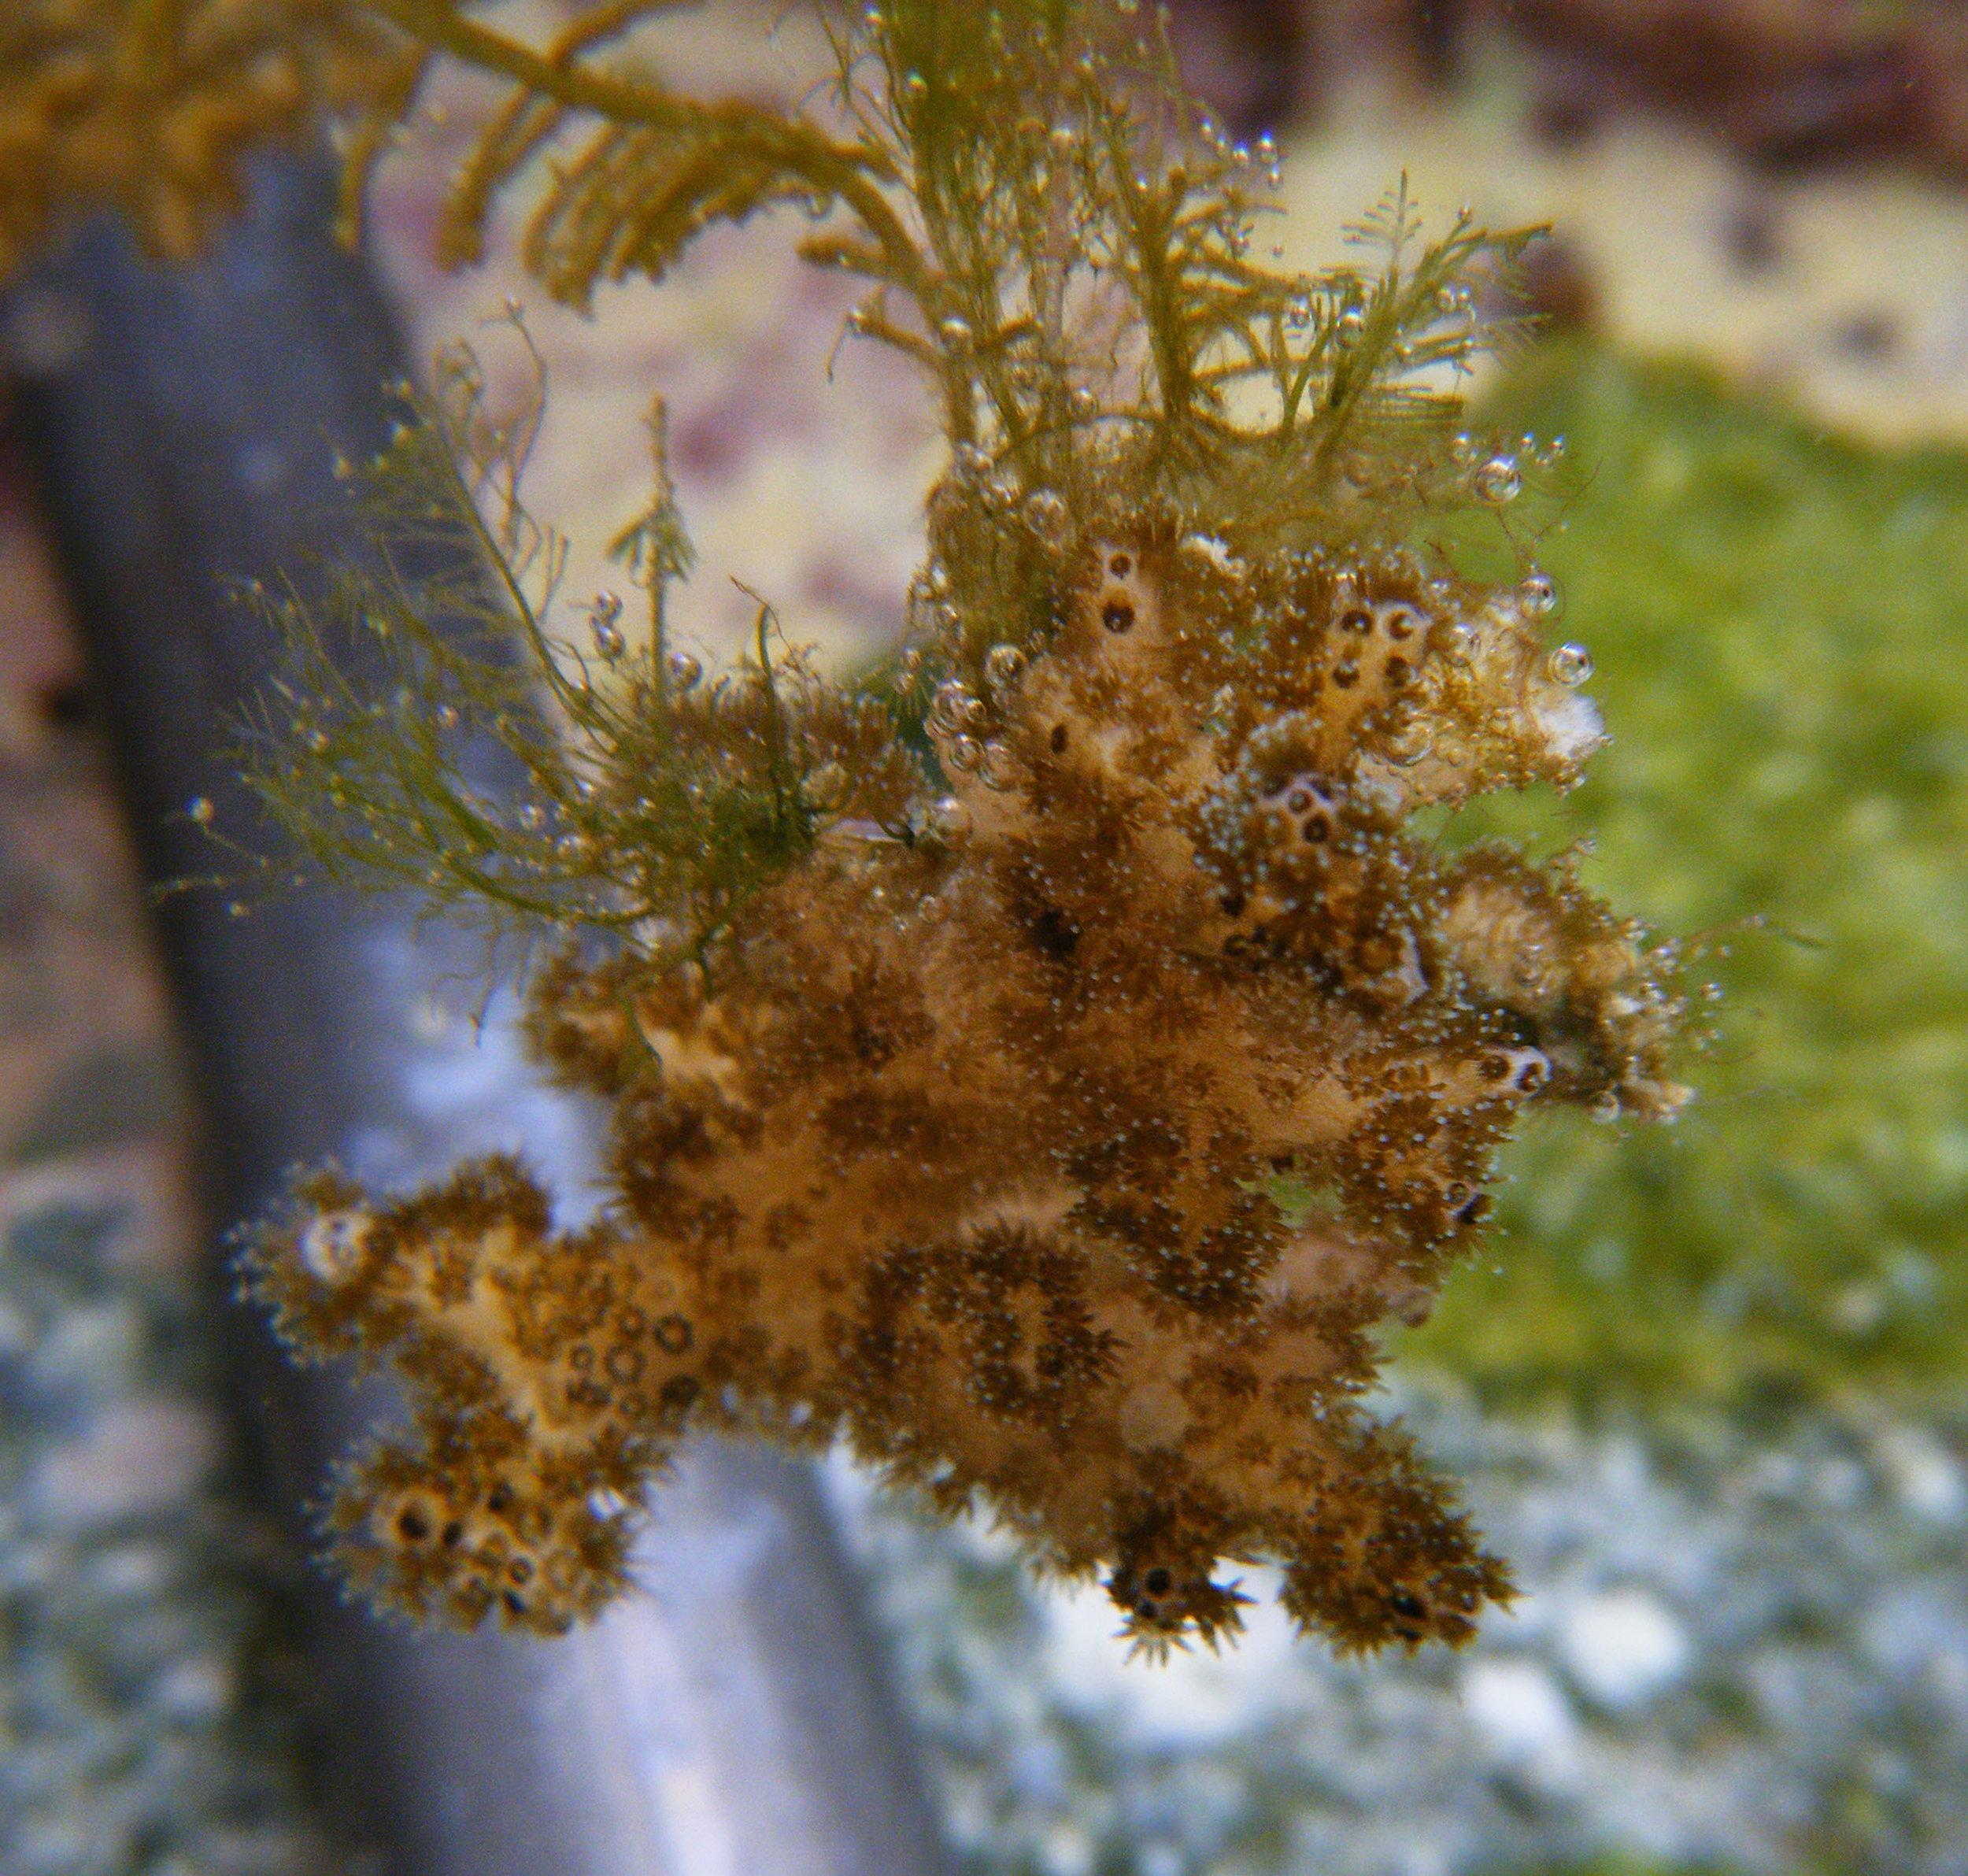
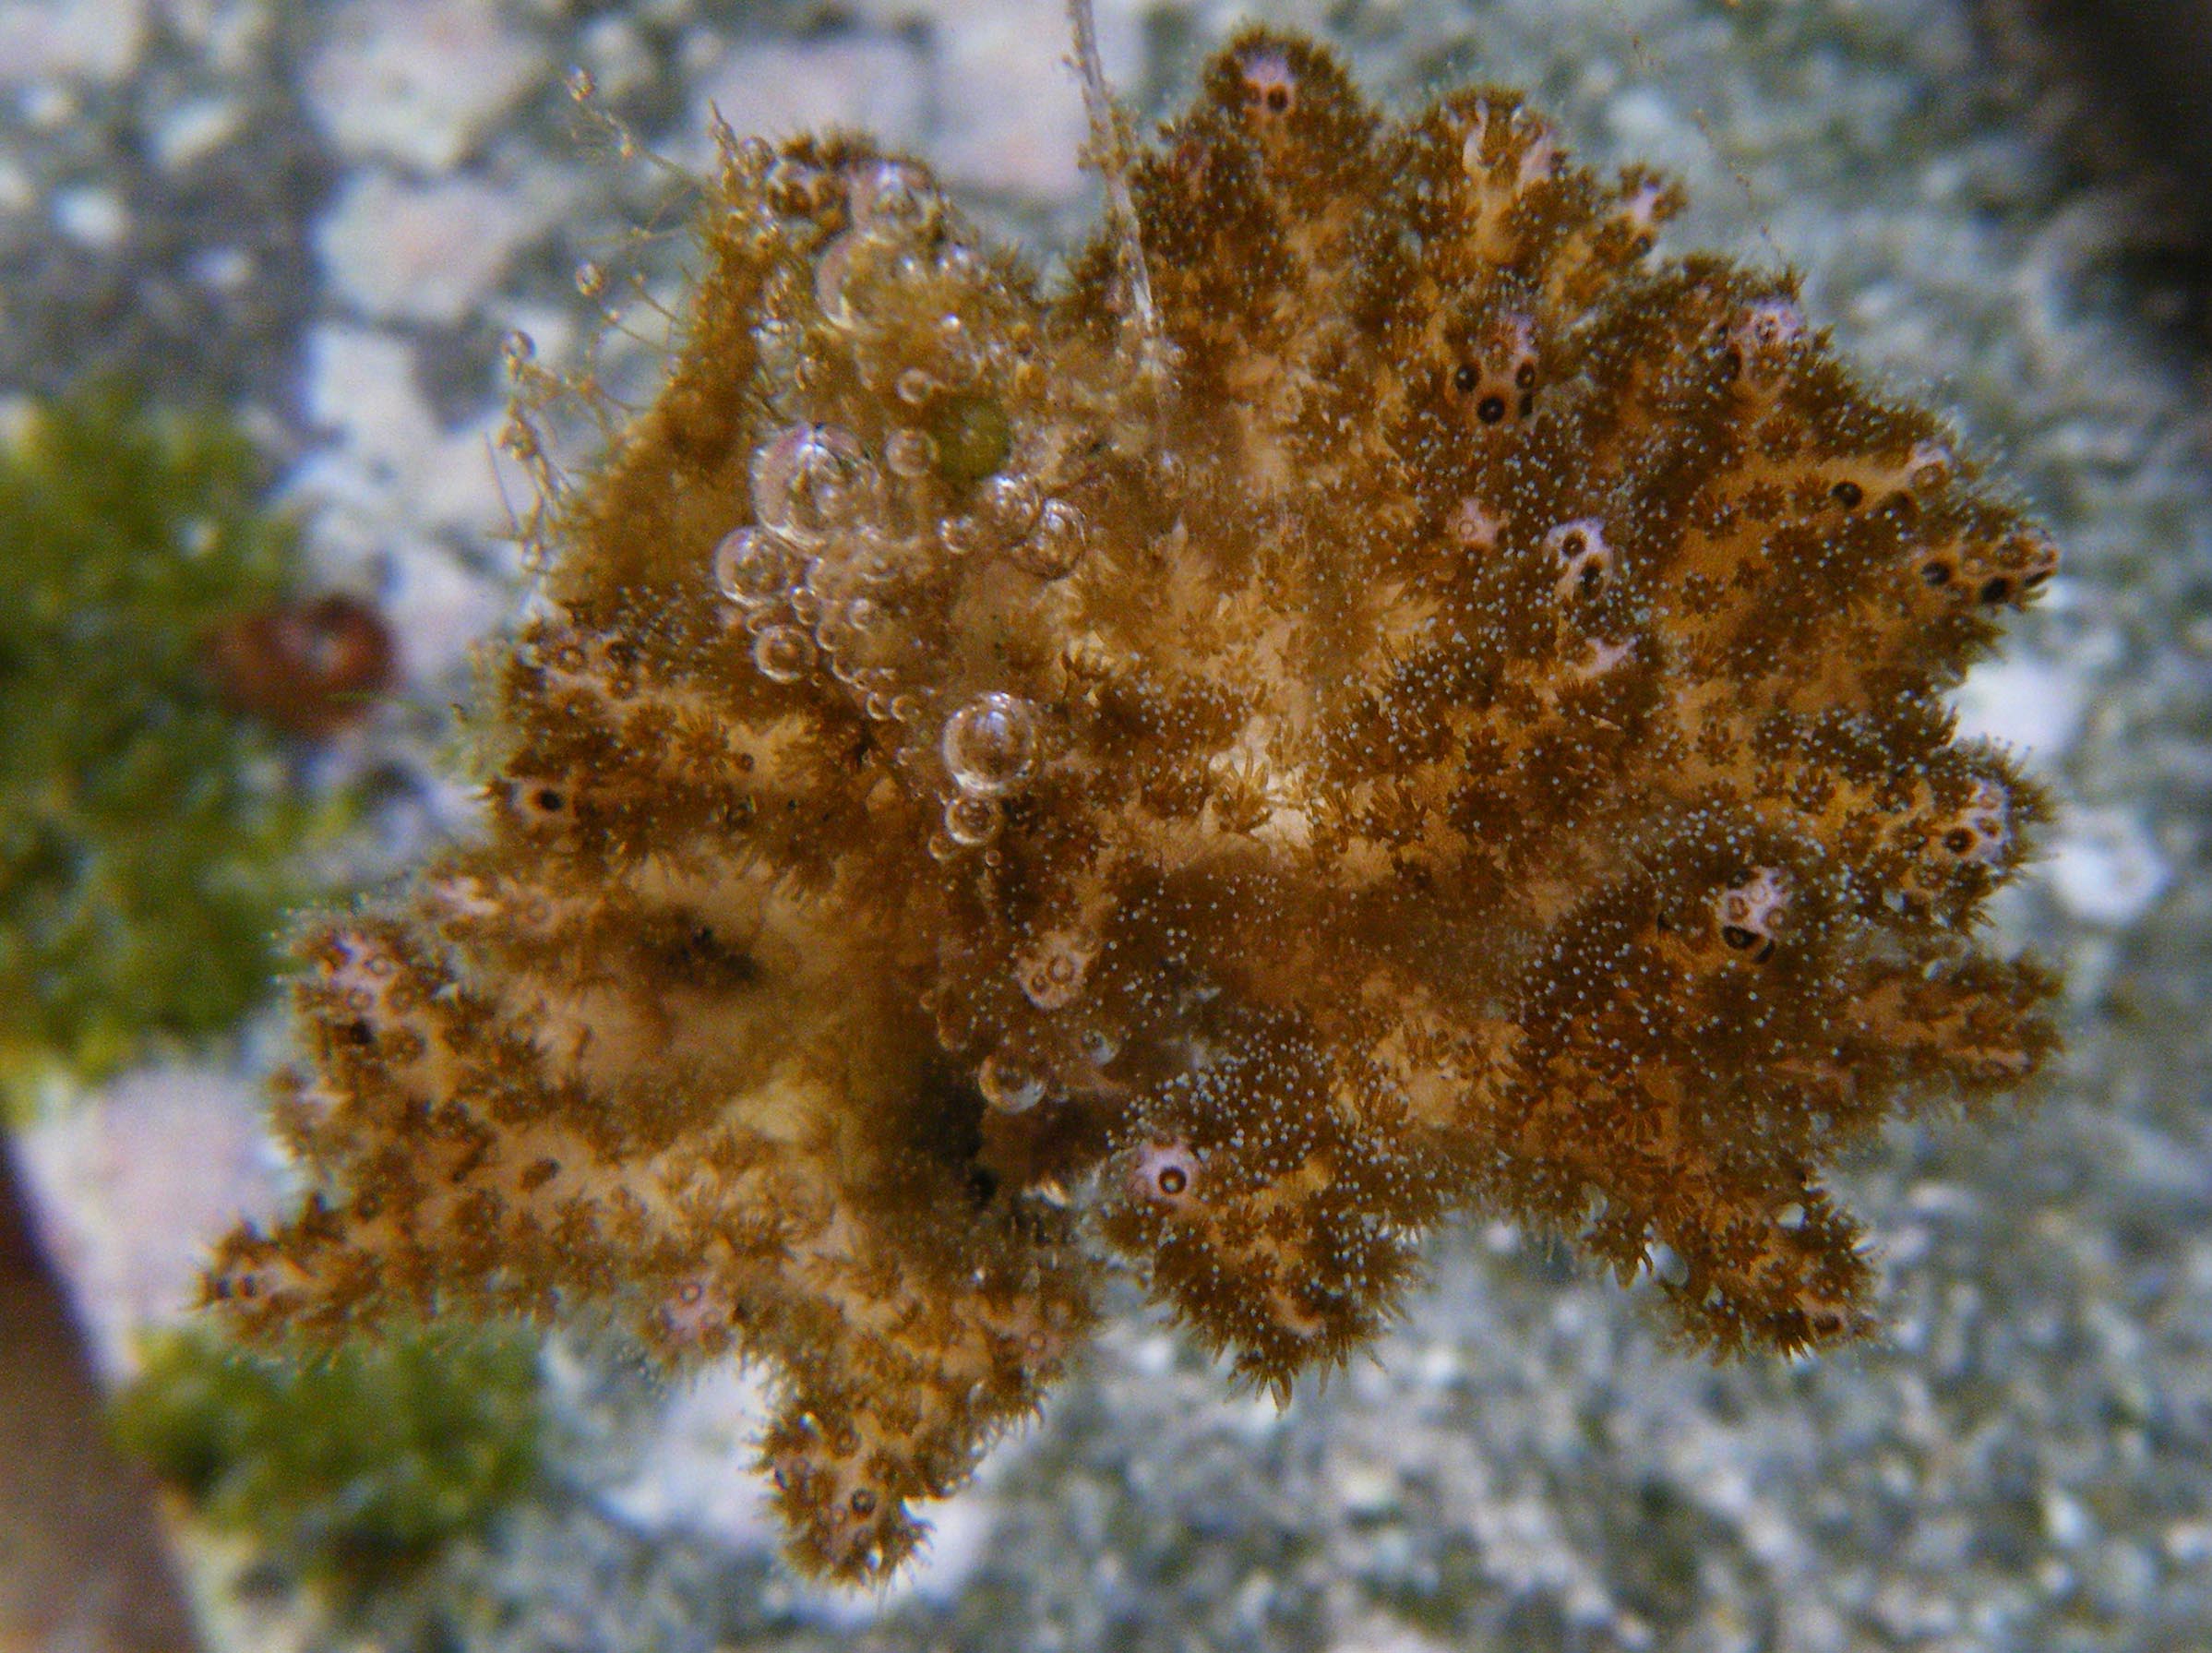
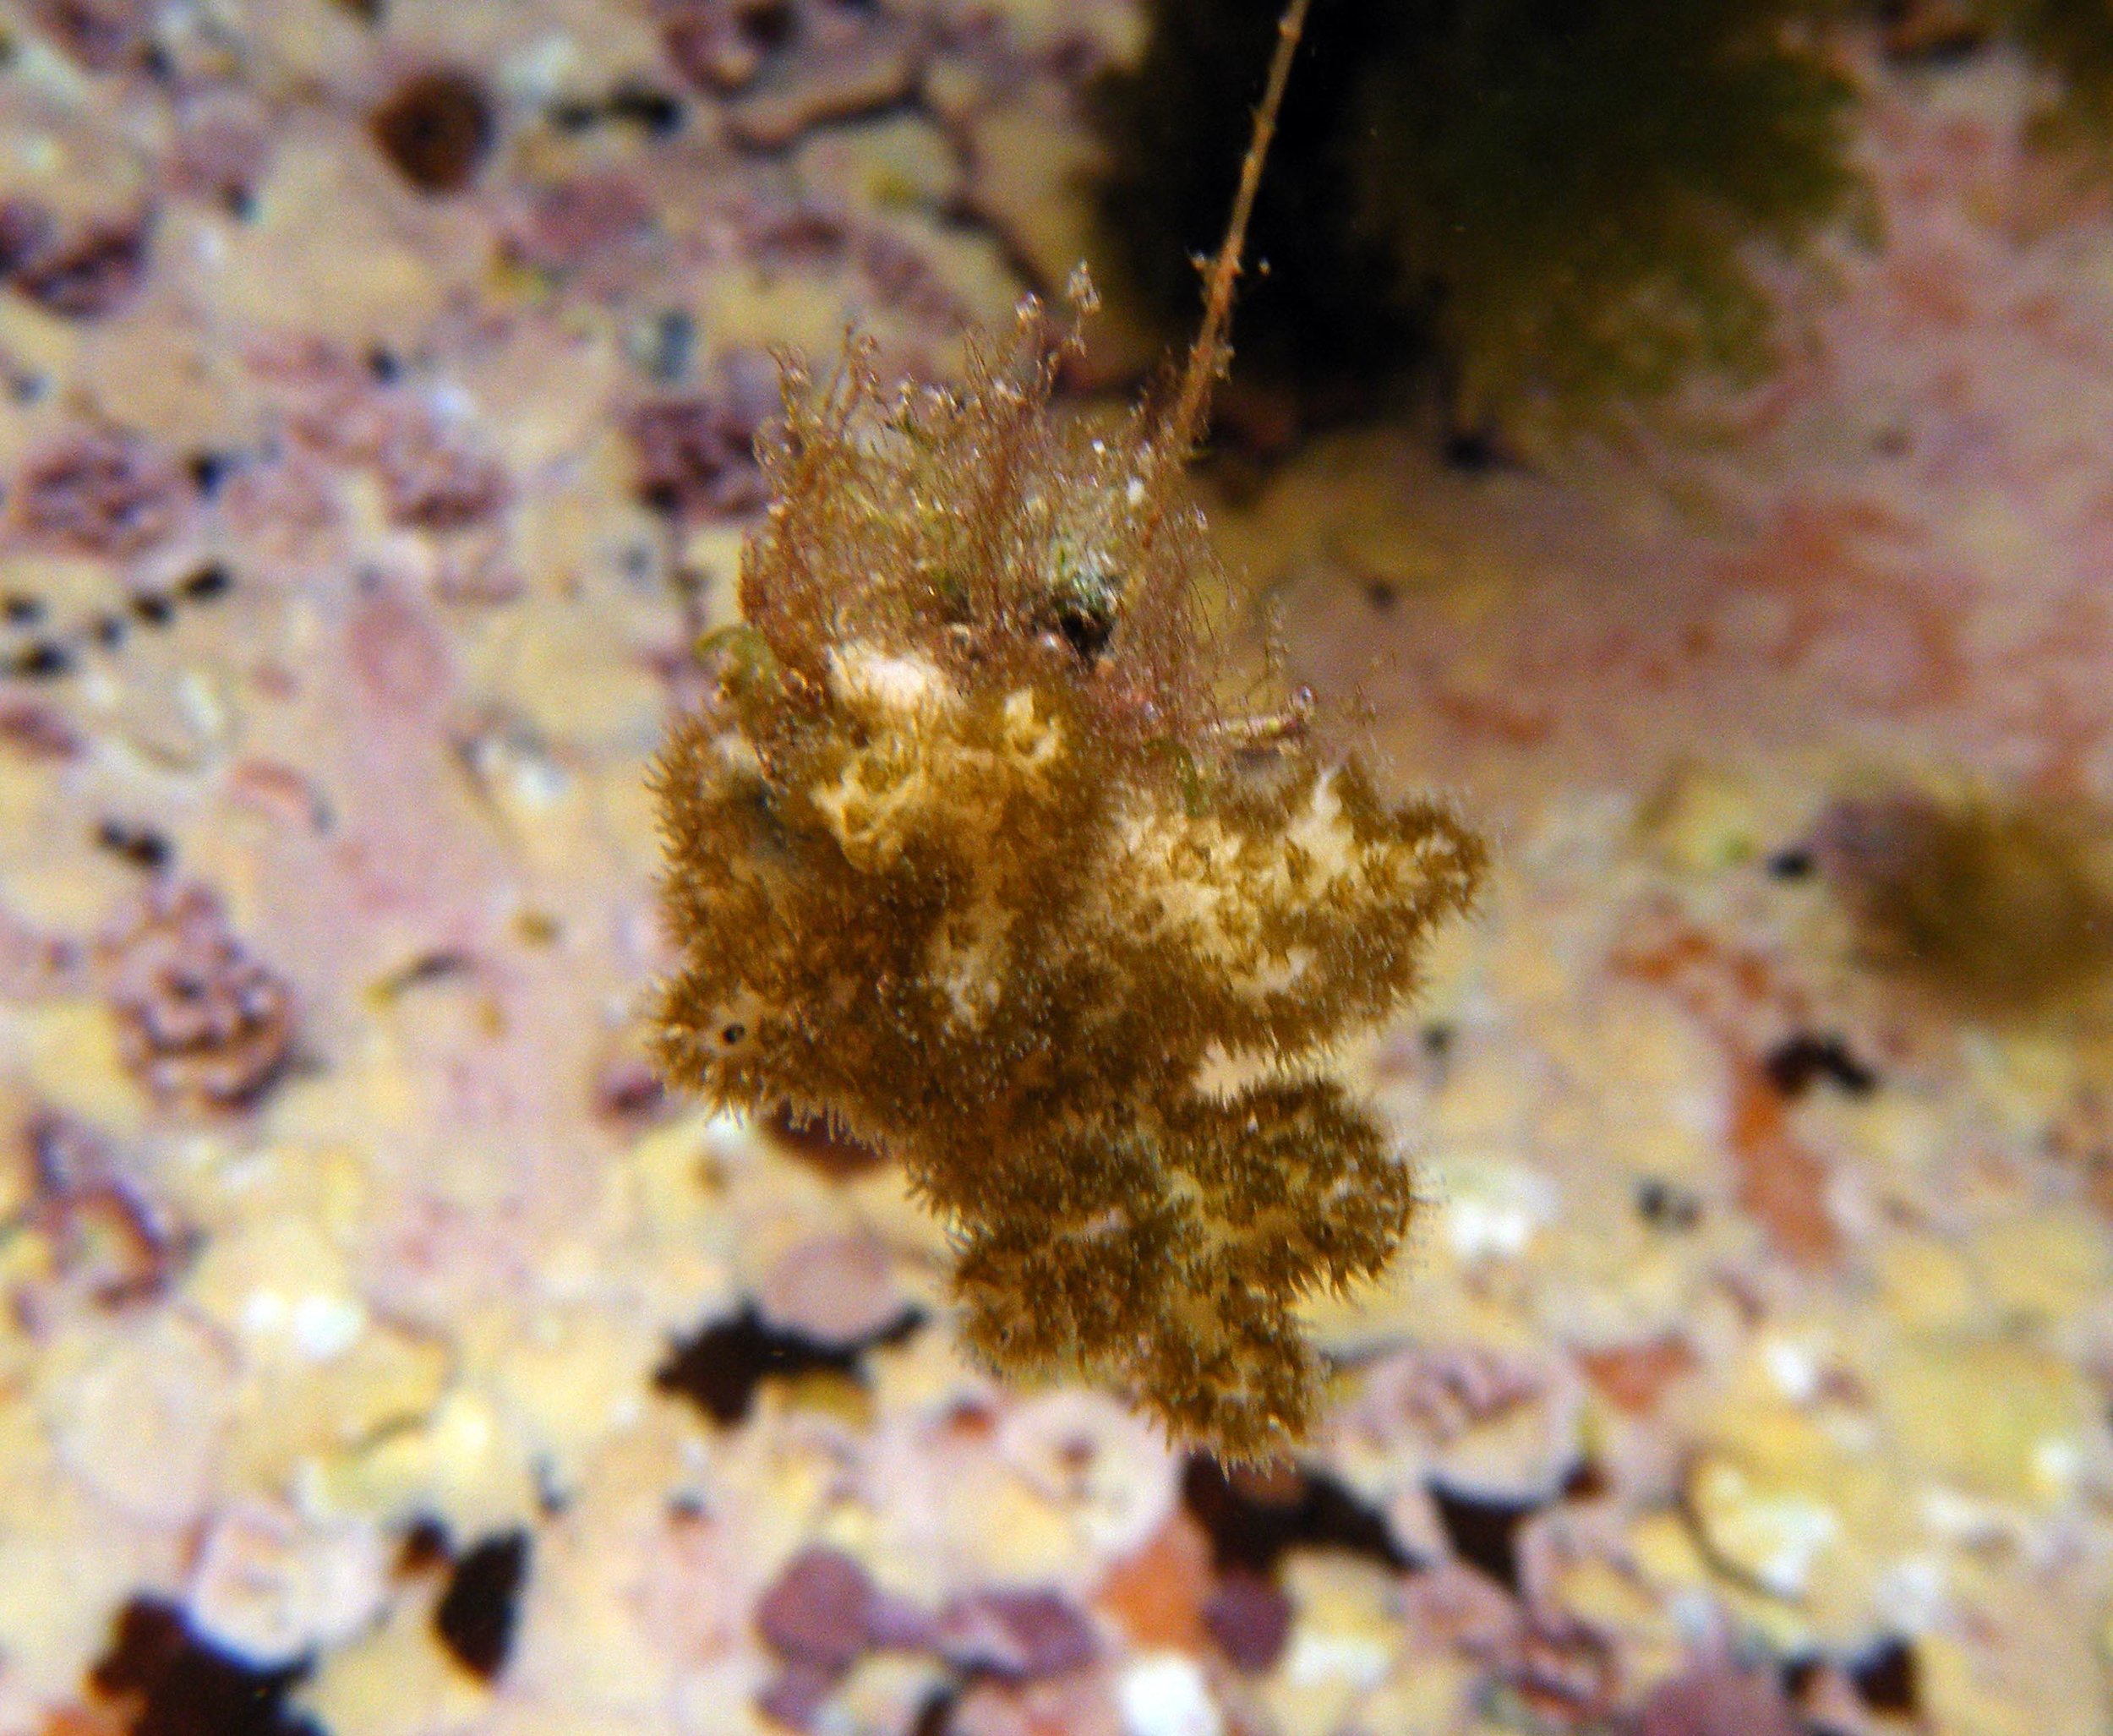
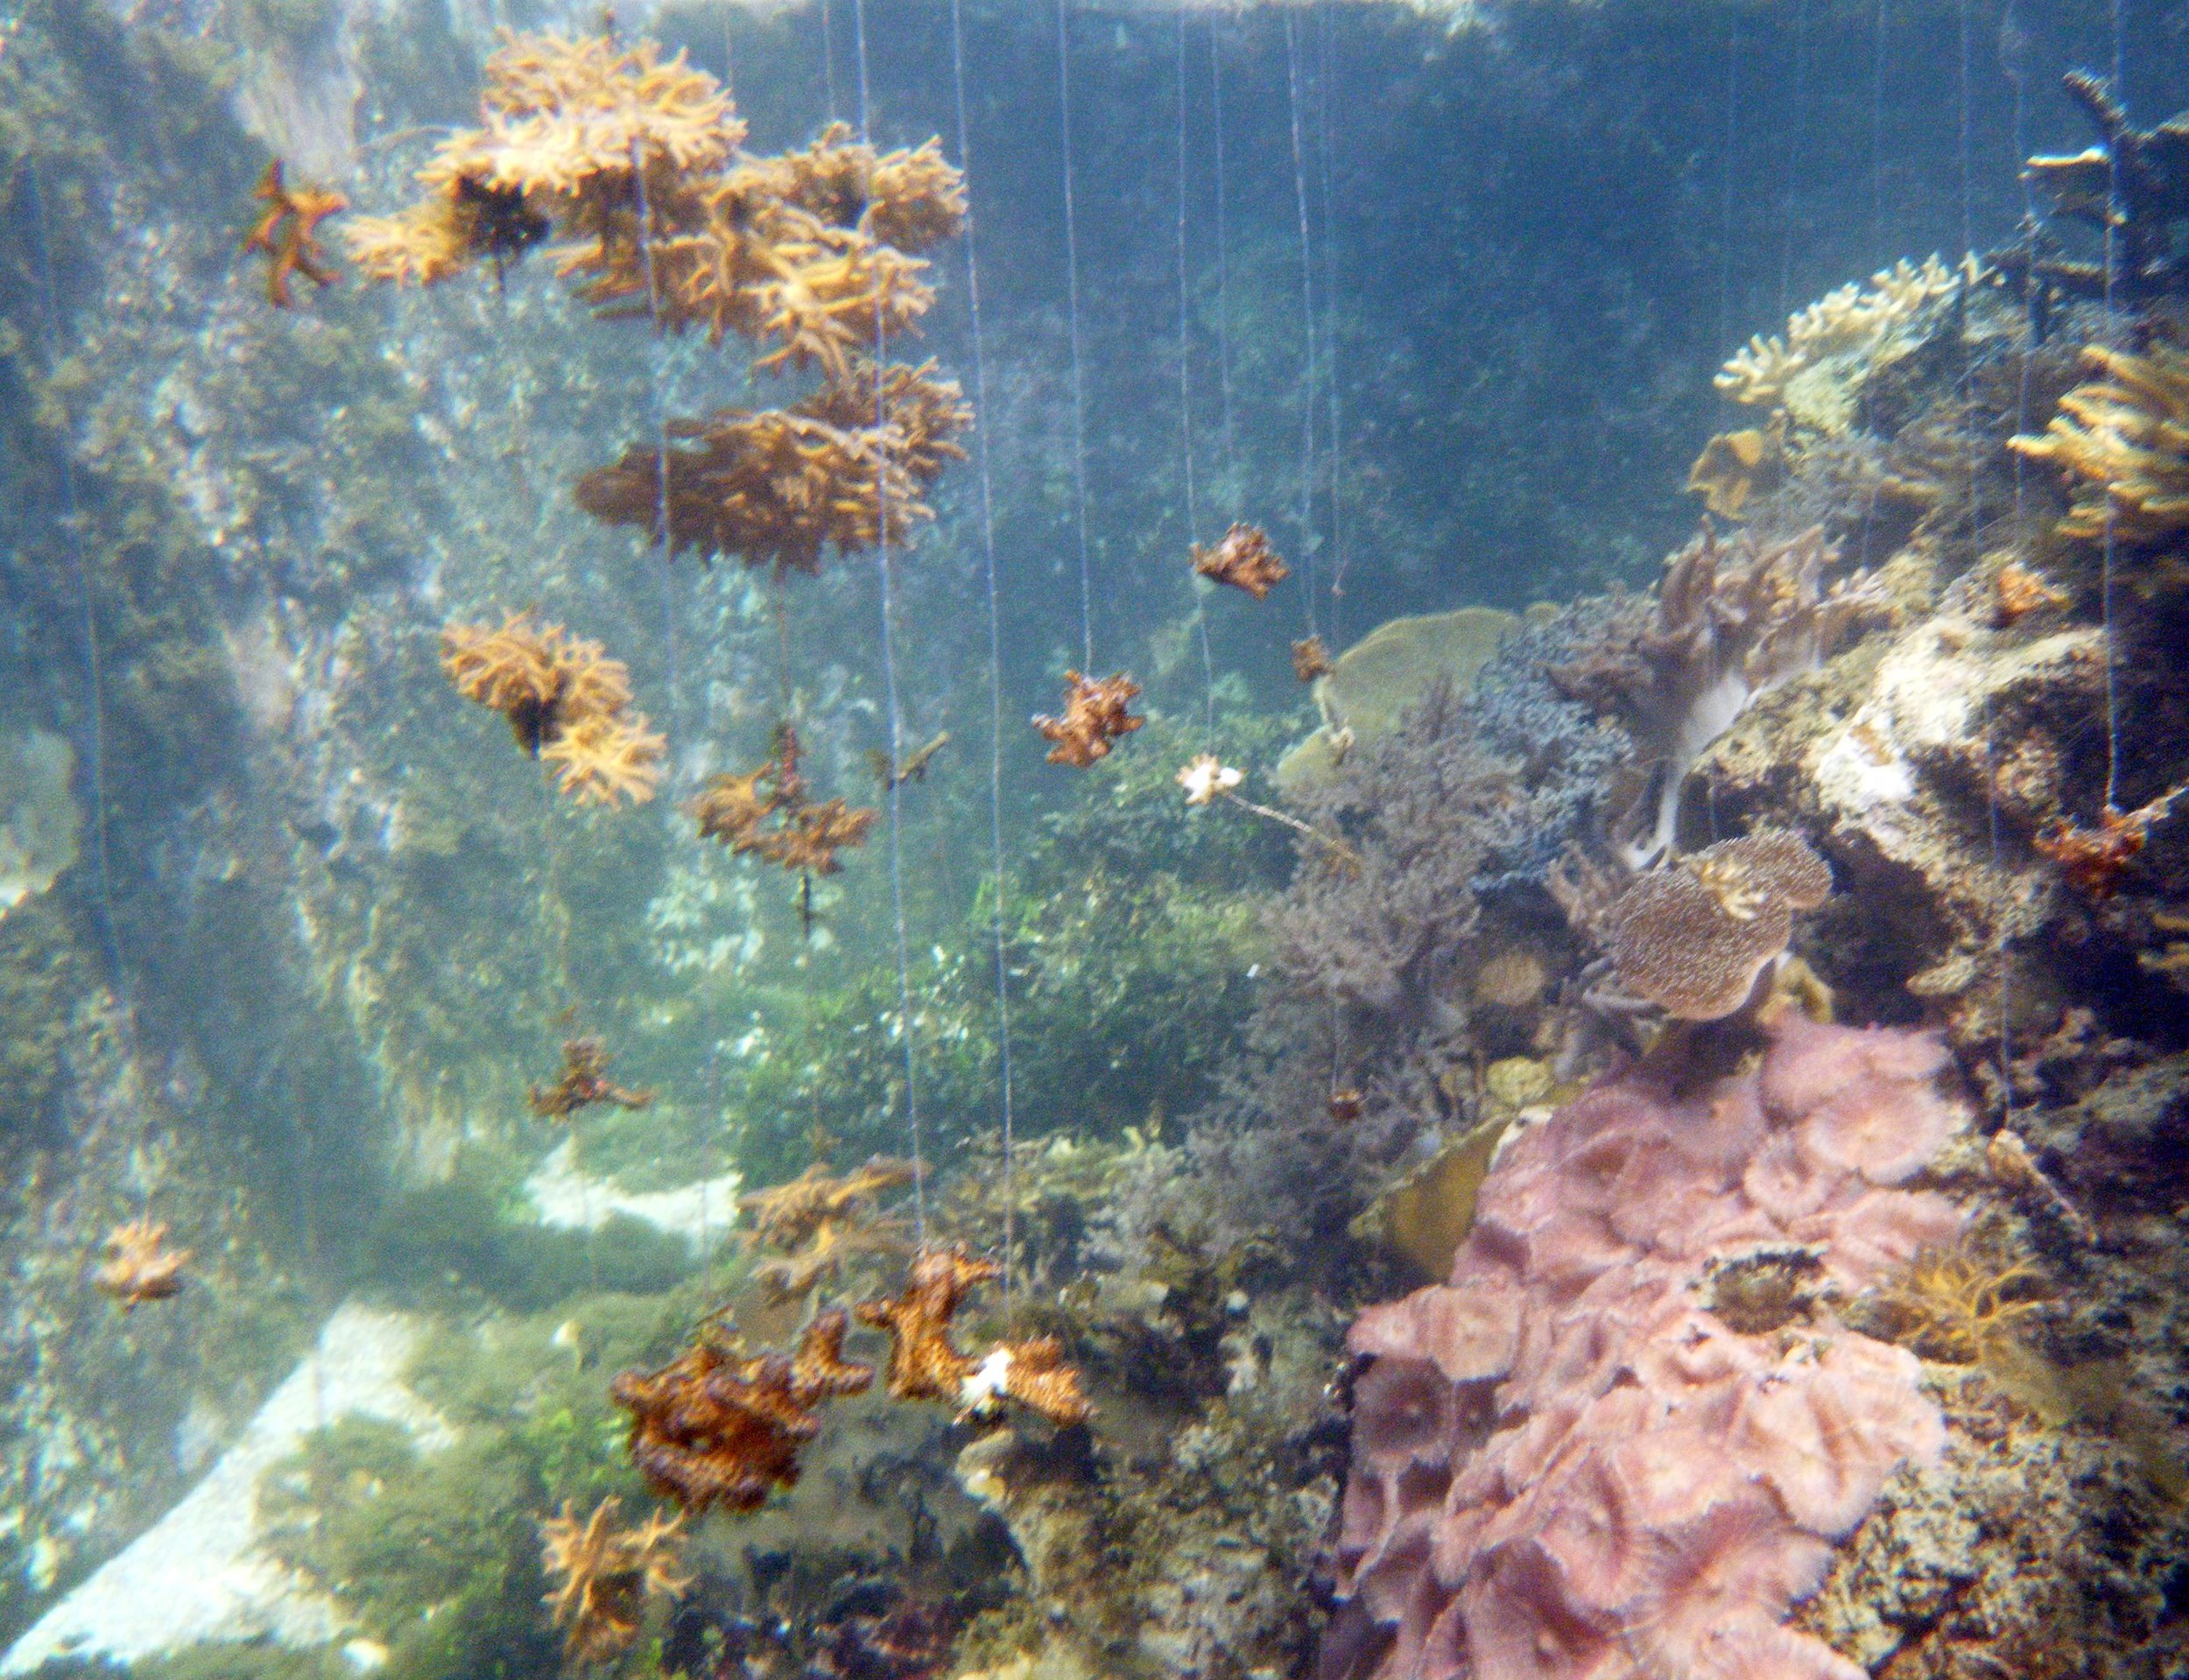
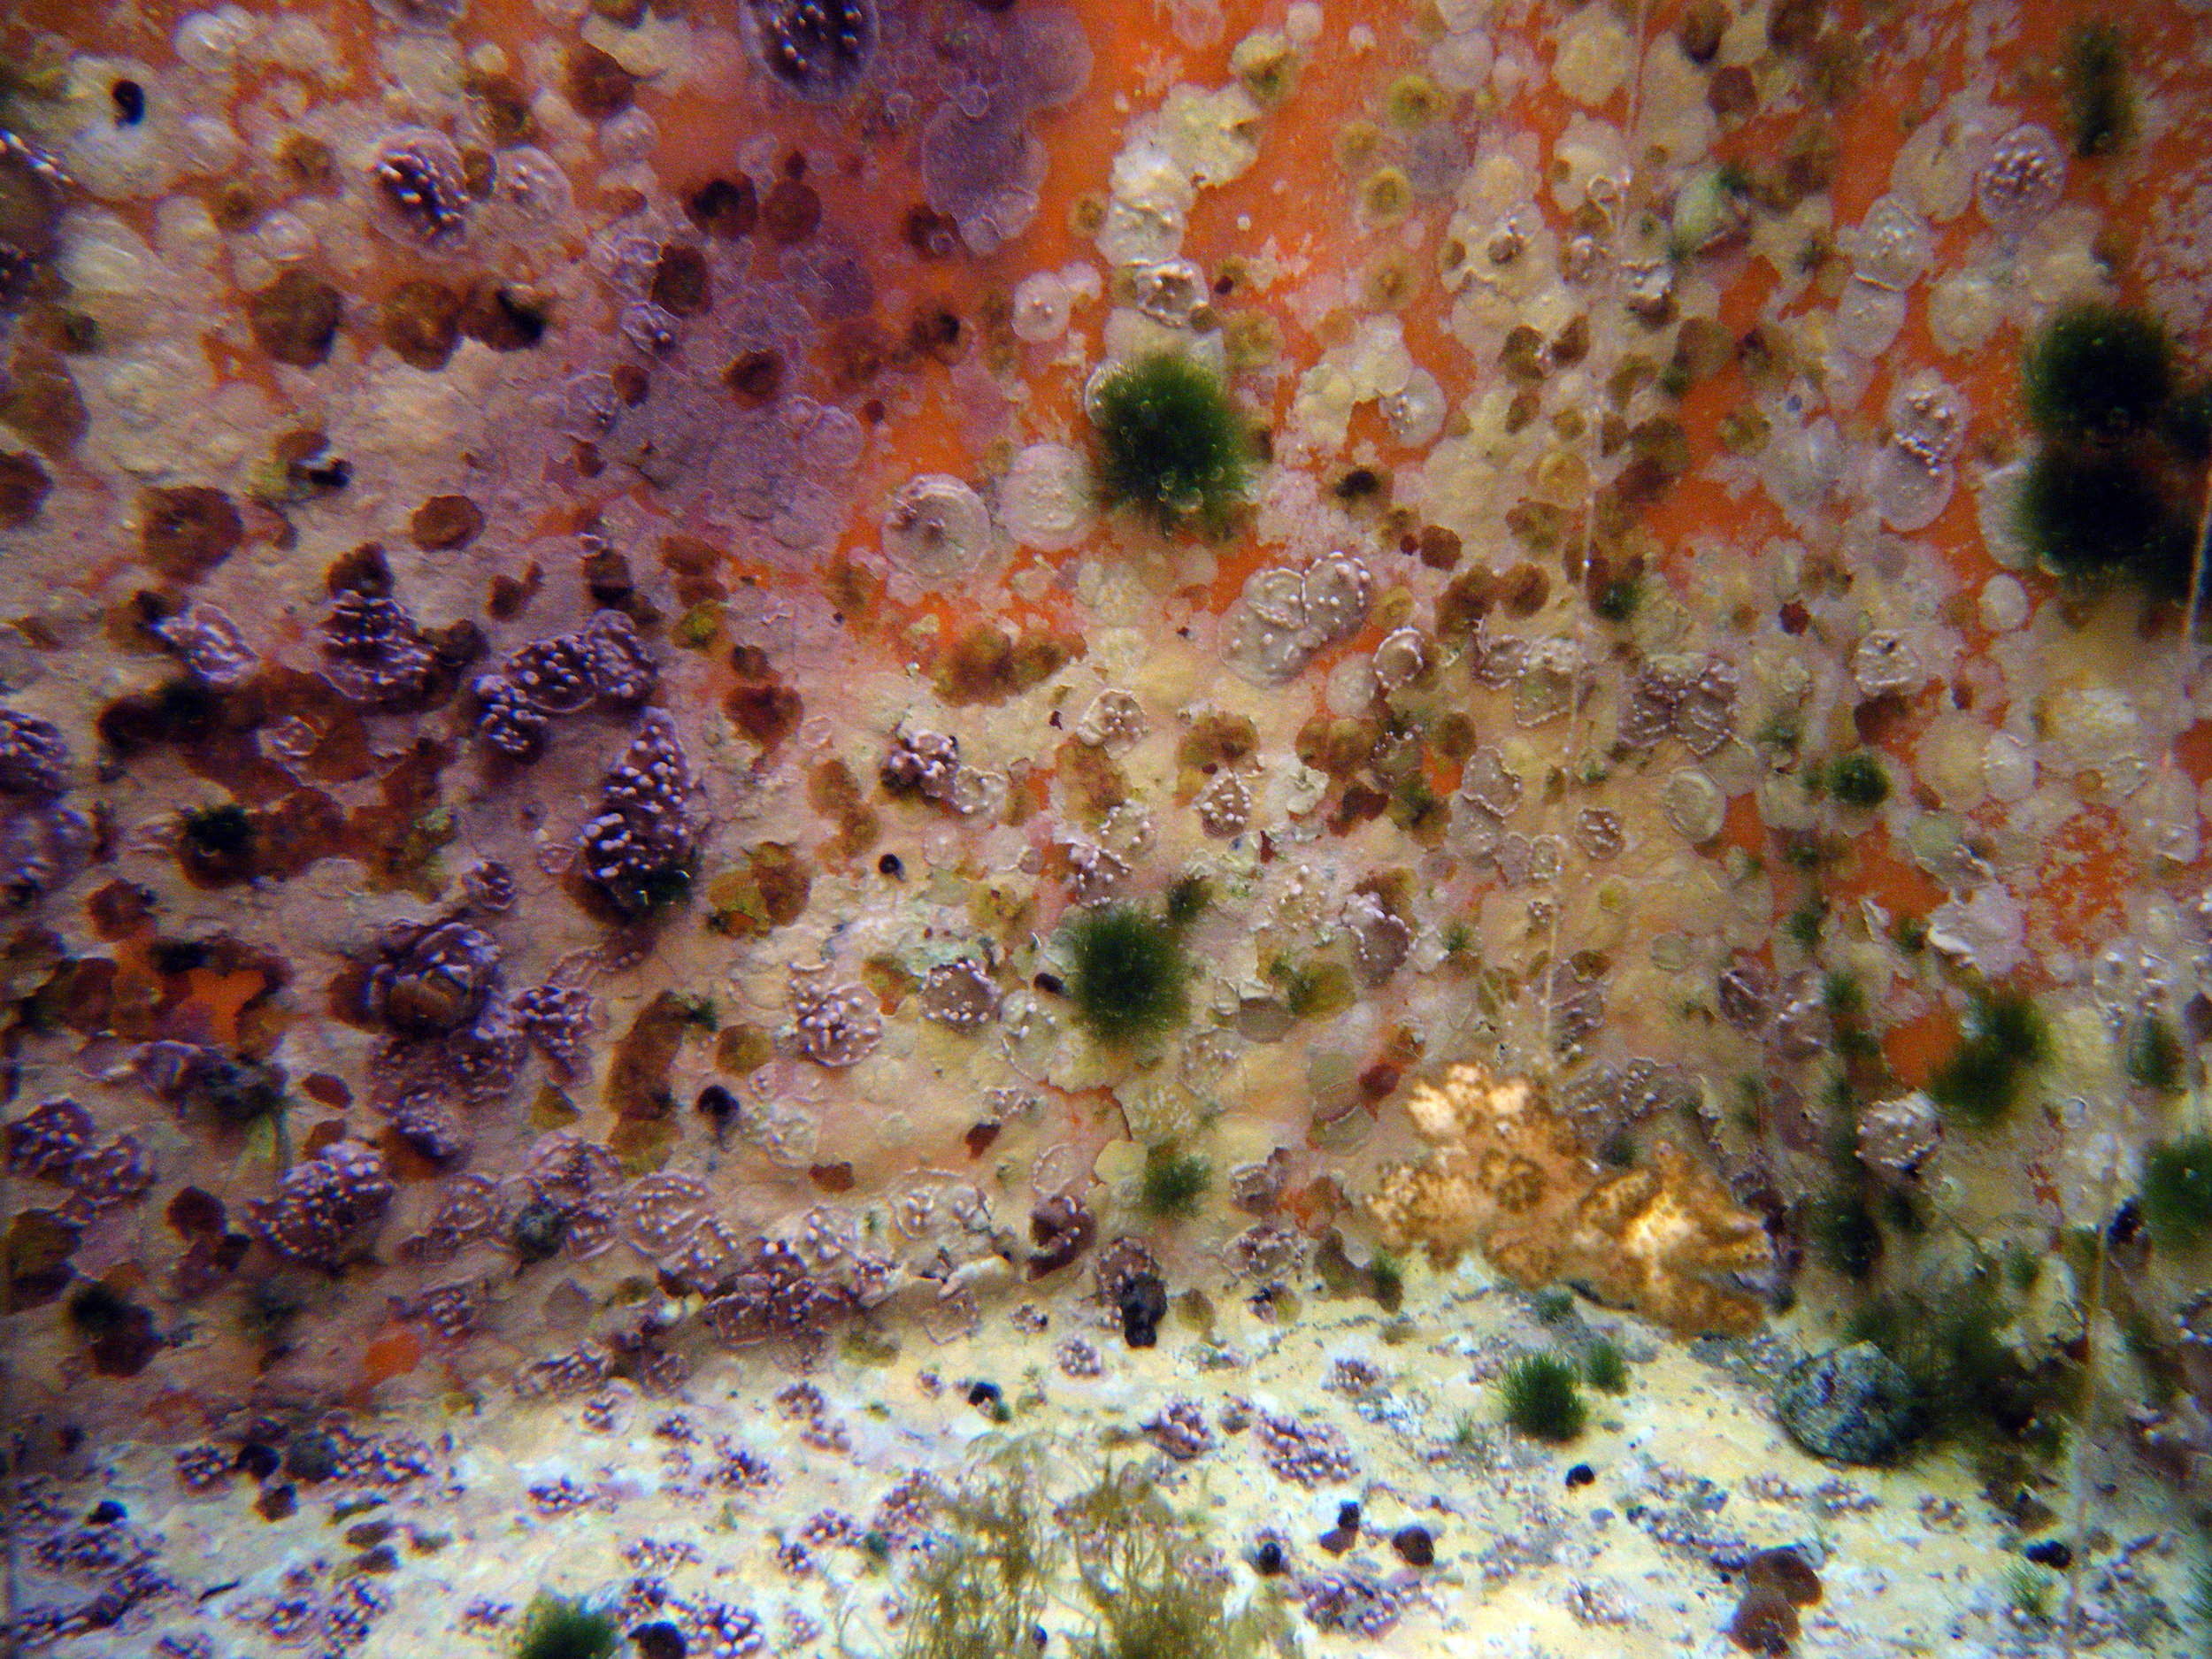
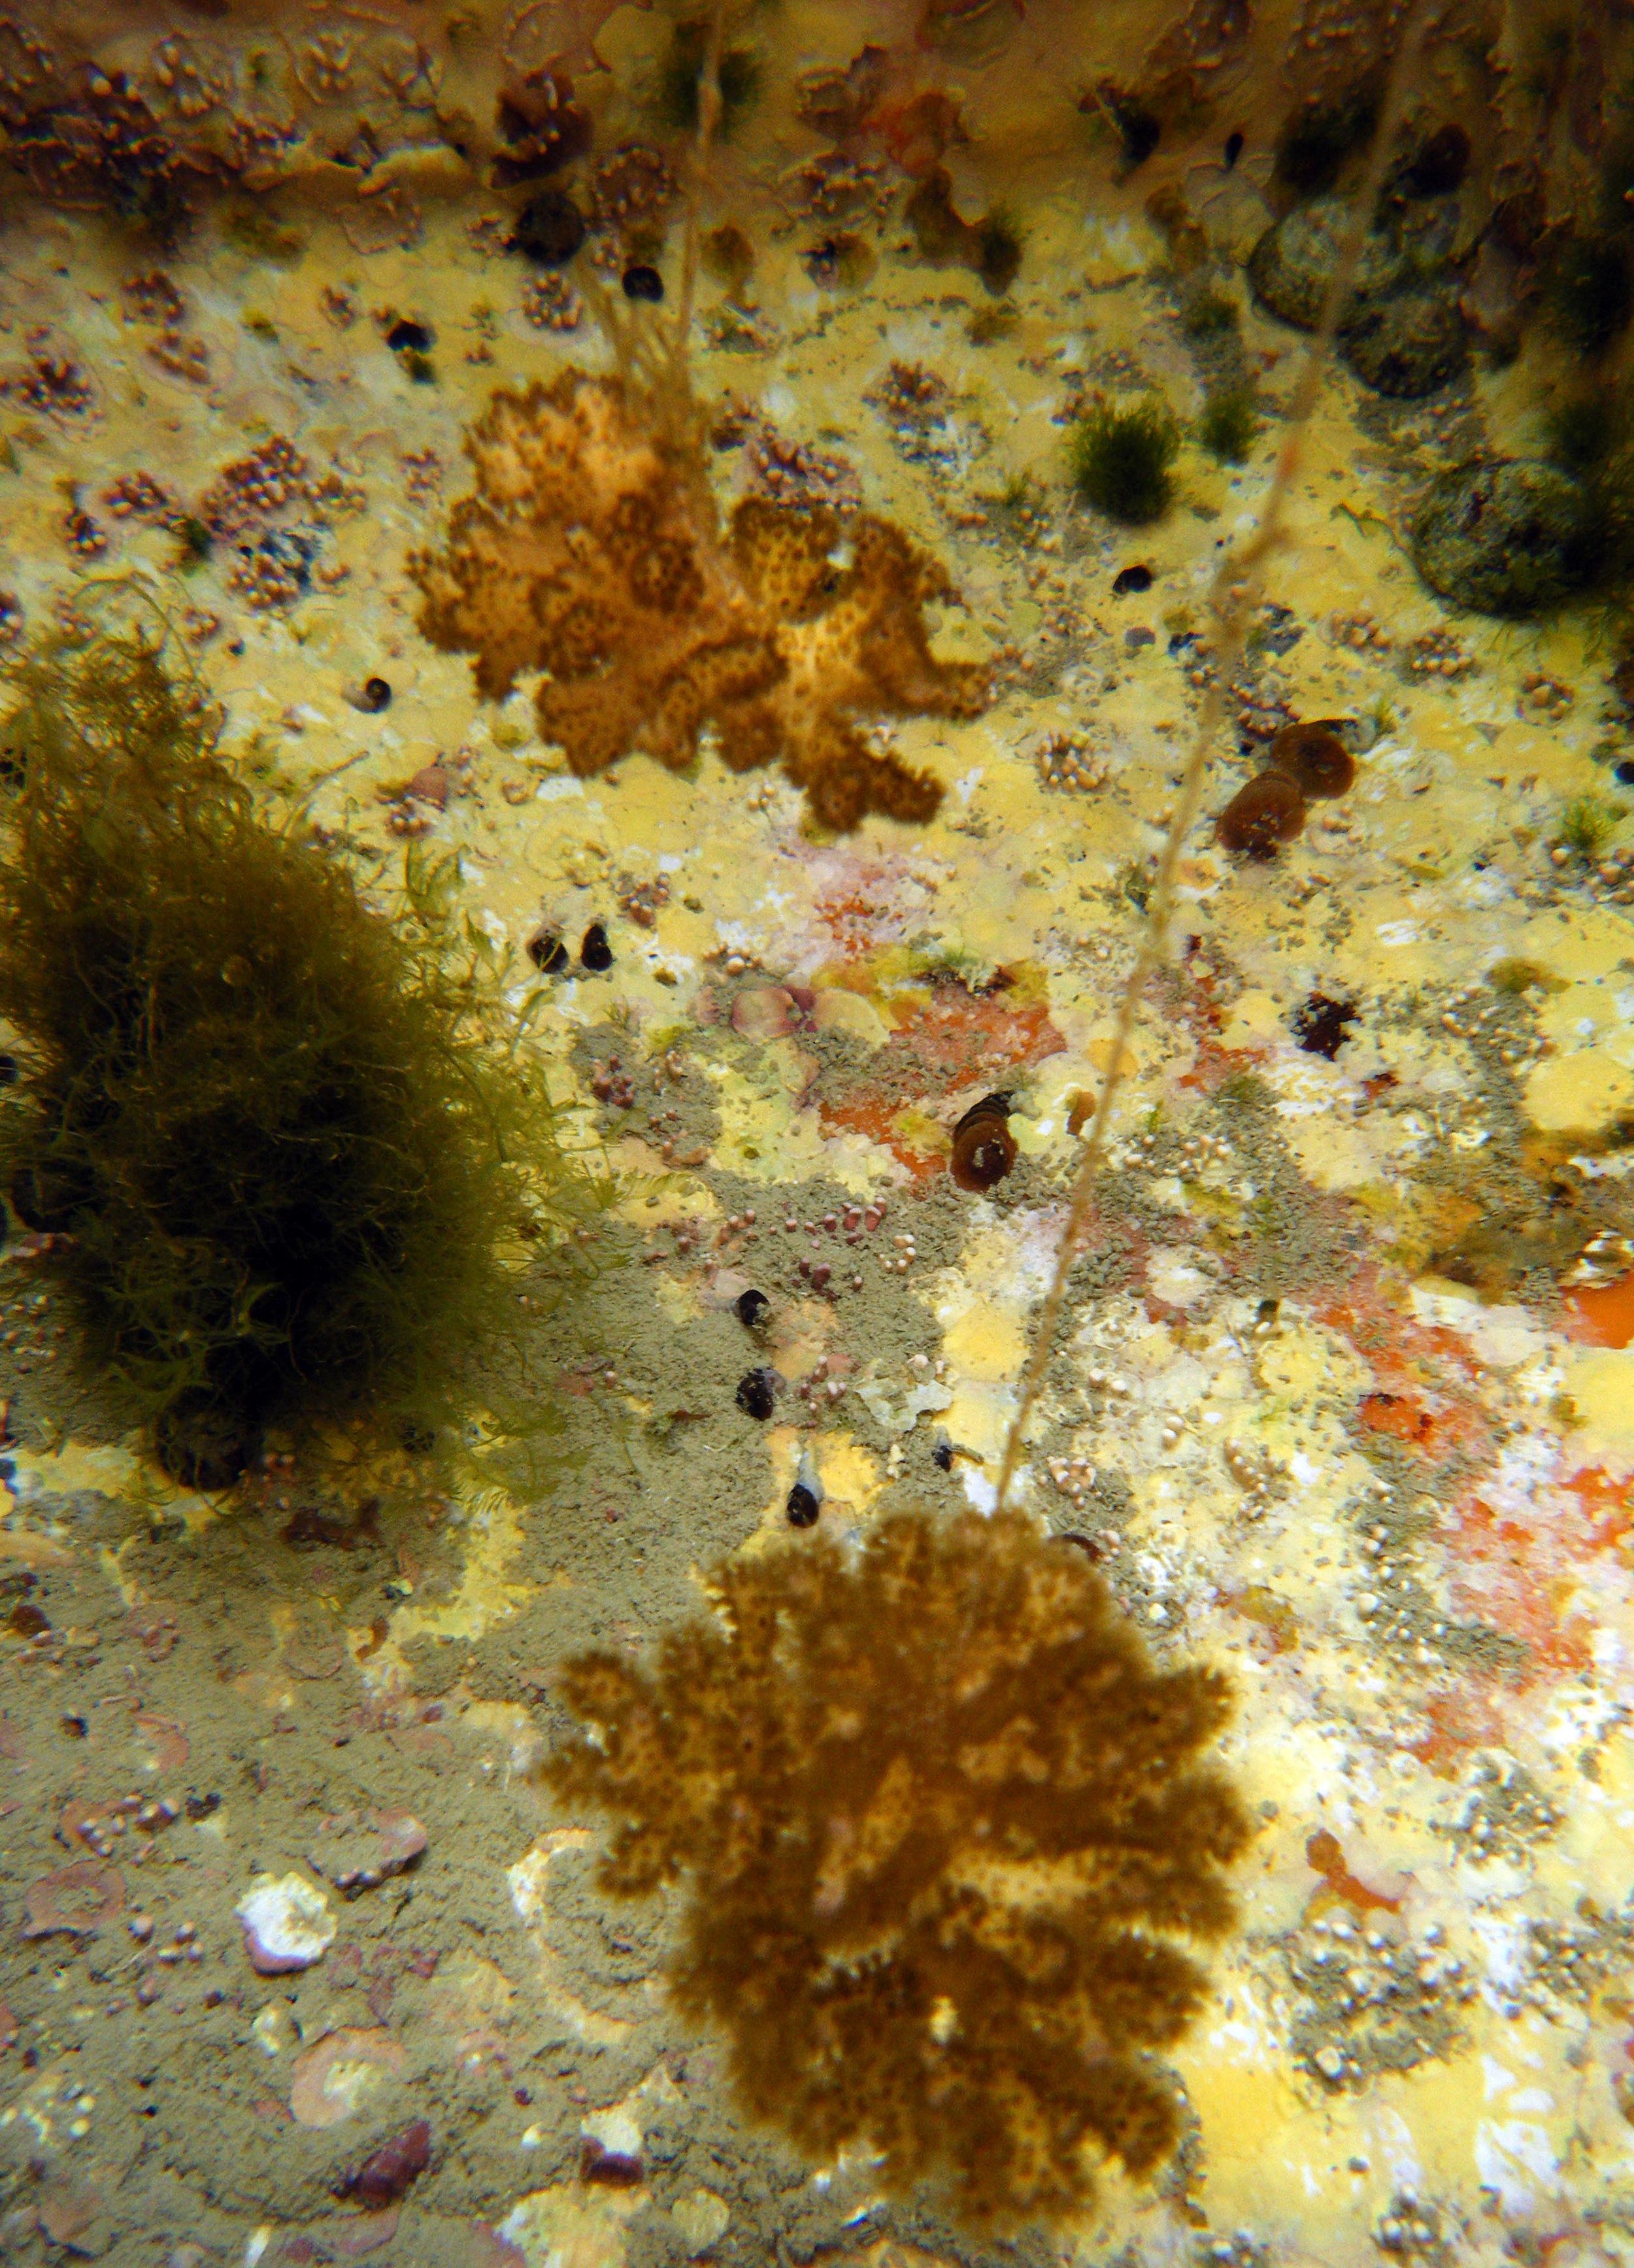
Here are some images of the mesocosm setup we used. “Mesocosm” does not mean “bigger than average tank” (as it is colloquially used in the literature), but rather an experiment in the experimental organism is cultured with other creatures with which it would be found in situ; in the case of corals, this includes macroalgae, snails, crustose coralline algae, etc. Seawater entering the aquariums was only filtered through sand; as such, corals could feed throughout the experimental period. This may, indeed, explain why they fared so well upon exposure to a temperature that was hypothesized a priori to induce stress. To see more about our mesocosm system, check out this Powerpoint presentation.

A plot of the temperature over the course of the experiment (a), as well as the light environment over a typical day (b). Mean diel photosynthetically active radiation (PAR) at each of three sampling times (c).
Here are the .csv files for the tank temperature data (as measured by HOBO Pendant(R) units):
control tank 1, control tank 2, control tank 3
high tank 1, high tank 2, high tank 3
I spot-checked temperature with a digital temperature probe and a LiCor meter, respectively, at several times over the course of the experiment. Here are those data:
light and temperature (spot check)
light, salinity, and temperature (spot checked by collaborators). Please note that “batfish” refers to the tank where nubbins were left to recover upon termination of the experiment.
salinity (spot checked at random times to ensure uniformity across tanks)
Photosynthetically active radiation (PAR) over a random day
PAR spot check by lab technicians (Excel)
PAR measured at time of nubbin sampling (8, 24, and 36 weeks)
PAR: in situ vs. mesocosm aquaria (JMP)
Temperature spot check (JMP)


A summary of the experiment and the response variables assessed. For the remaining proteomic samples, iTRAQ followed by nano-liquid chromatography and mass spectrometry (MS) will be used in place of 2-D gels+MS.
PHYSIOLOGICAL RESULTS

Nubbins were not buoyantly weighed since the process takes so long (and therefore cellular biology could be disturbed). Instead, surface area was used as a proxy for growth. High-temperature nubbins, in fact, grew more than controls by the end of the experiment, though this difference was not statistically significant.
Physiological data:
Chi-squared table for mortality (pooled over time).
Physiological data (two-way ANOVA format).
Physiological data (repeated-measures ANOVA [the proper way BTW])
Wax dipping standard curve (for assessing surface area of nubbins)
Microscopy data:
Amongst many hypotheses I tested in this experiment was that coral tissue and cell architecture would change in response to prolonged elevated temperature exposure. Although we DID detect some increases in thickness in the gastroderm relative to the epiderm, these differences were relatively subtle. Here are the scanning electron microscopy data:
SEM (formatted for two-way ANOVA)
SEM (36 weeks only)
SEM tissue thickness ratio (t=24 and 36 weeks, formatted for repeated measures ANOVA)
The histology data can be found under the “histology” worksheet in this “long-term temperature experiment” (LTTE) Excel file.


Not much going on here, but hey, at least I learned a new approach!
GENETIC ANALYSES
Symbiodinium
Although nearly all Taiwanese corals host Symbiodinium of clade C only, I was interested in seeing if any background symbiont types were present in my coral nubbins. There were some clade A symbionts detected by qPCR: clade A frequency table. However, there were neither effects of treatment nor time on clade A frequency. For the raw Symbiodinium genotyping data (clade level only), please see the “GCPs qPCRs” worksheet of this file.
Coral host
Although I have called these samples “Pocillopora damicornis” above, in the manuscripts, and one my transcriptome server, they are probably actually Pocillopora acuta (these two species were synonymized at the time this experiment was undertaken, in my defense). Here are the mitochondrial open reading frame sequences from a subset of the sample nubbins:
H4T3S2 consensus (P. acuta), C8T2S1 consensus (P. acuta)
GENE EXPRESSION ANALYSIS-CANDIDATE GENES
Please note that a transcriptomic analysis of 12 of the experimental samples (3 from the control treatment and 3 from the high-temperature treatment at each of 2 sampling times: 2 and 36 weeks) is described in detail here.
Candidate gene assessment with real-time PCR: repeated measures ANOVA format, 2-way ANOVA format, stacked data, NGS samples (n=12) only
Compartmental comparison of four stress genes: hsp70, ubiquitin activating enzyme E1, ubiquitin conjugating enzyme E2, and ubiquitin conjugation factor E4.

Expression of six Symbiodinium candidate genes; as you can see, there were no treatment effects, only temporal ones (likely due to variability in the light environment).

Modest correlation between host coral and Symbiodinium hsp70 mRNA expression.
TRANSCRIPTOMIC ANALYSES
Although a separate website is dedicated to the next generation sequencing-based (RNA-Seq) analysis of 12 of the samples from this experiment (3 at each of the 2 treatments at each of 2 sampling times: 2 and 36 weeks), I am posting some data files here:
FPKM data
host/Symbiodinium contig ratio for each sample (a necessity for normalizing transcriptomic data from a multi-compartmental organism)
compartmental comparison of gene expression
Venn diagram
PROTEOMIC ANALYSES