
One of the nicest places you could hope to find yourself. The gorgeous photo of Isles de Pines in this page's banner was taken by Serge Andrefouet. We spent about half of our time during our month in the country (Nov. 2013) in the southeast of the country (Ile des Pins and Prony Bay) and the other half in the northern reefs and atolls.
For the Living Oceans Foundation’s field report, please click here.
I have now published two of at least three manuscripts on the pocilloporid corals I sampled there.
A: The first can be accessed here, and the associated data can be found here.
B: The second article on light-dark differences can be accessed here.
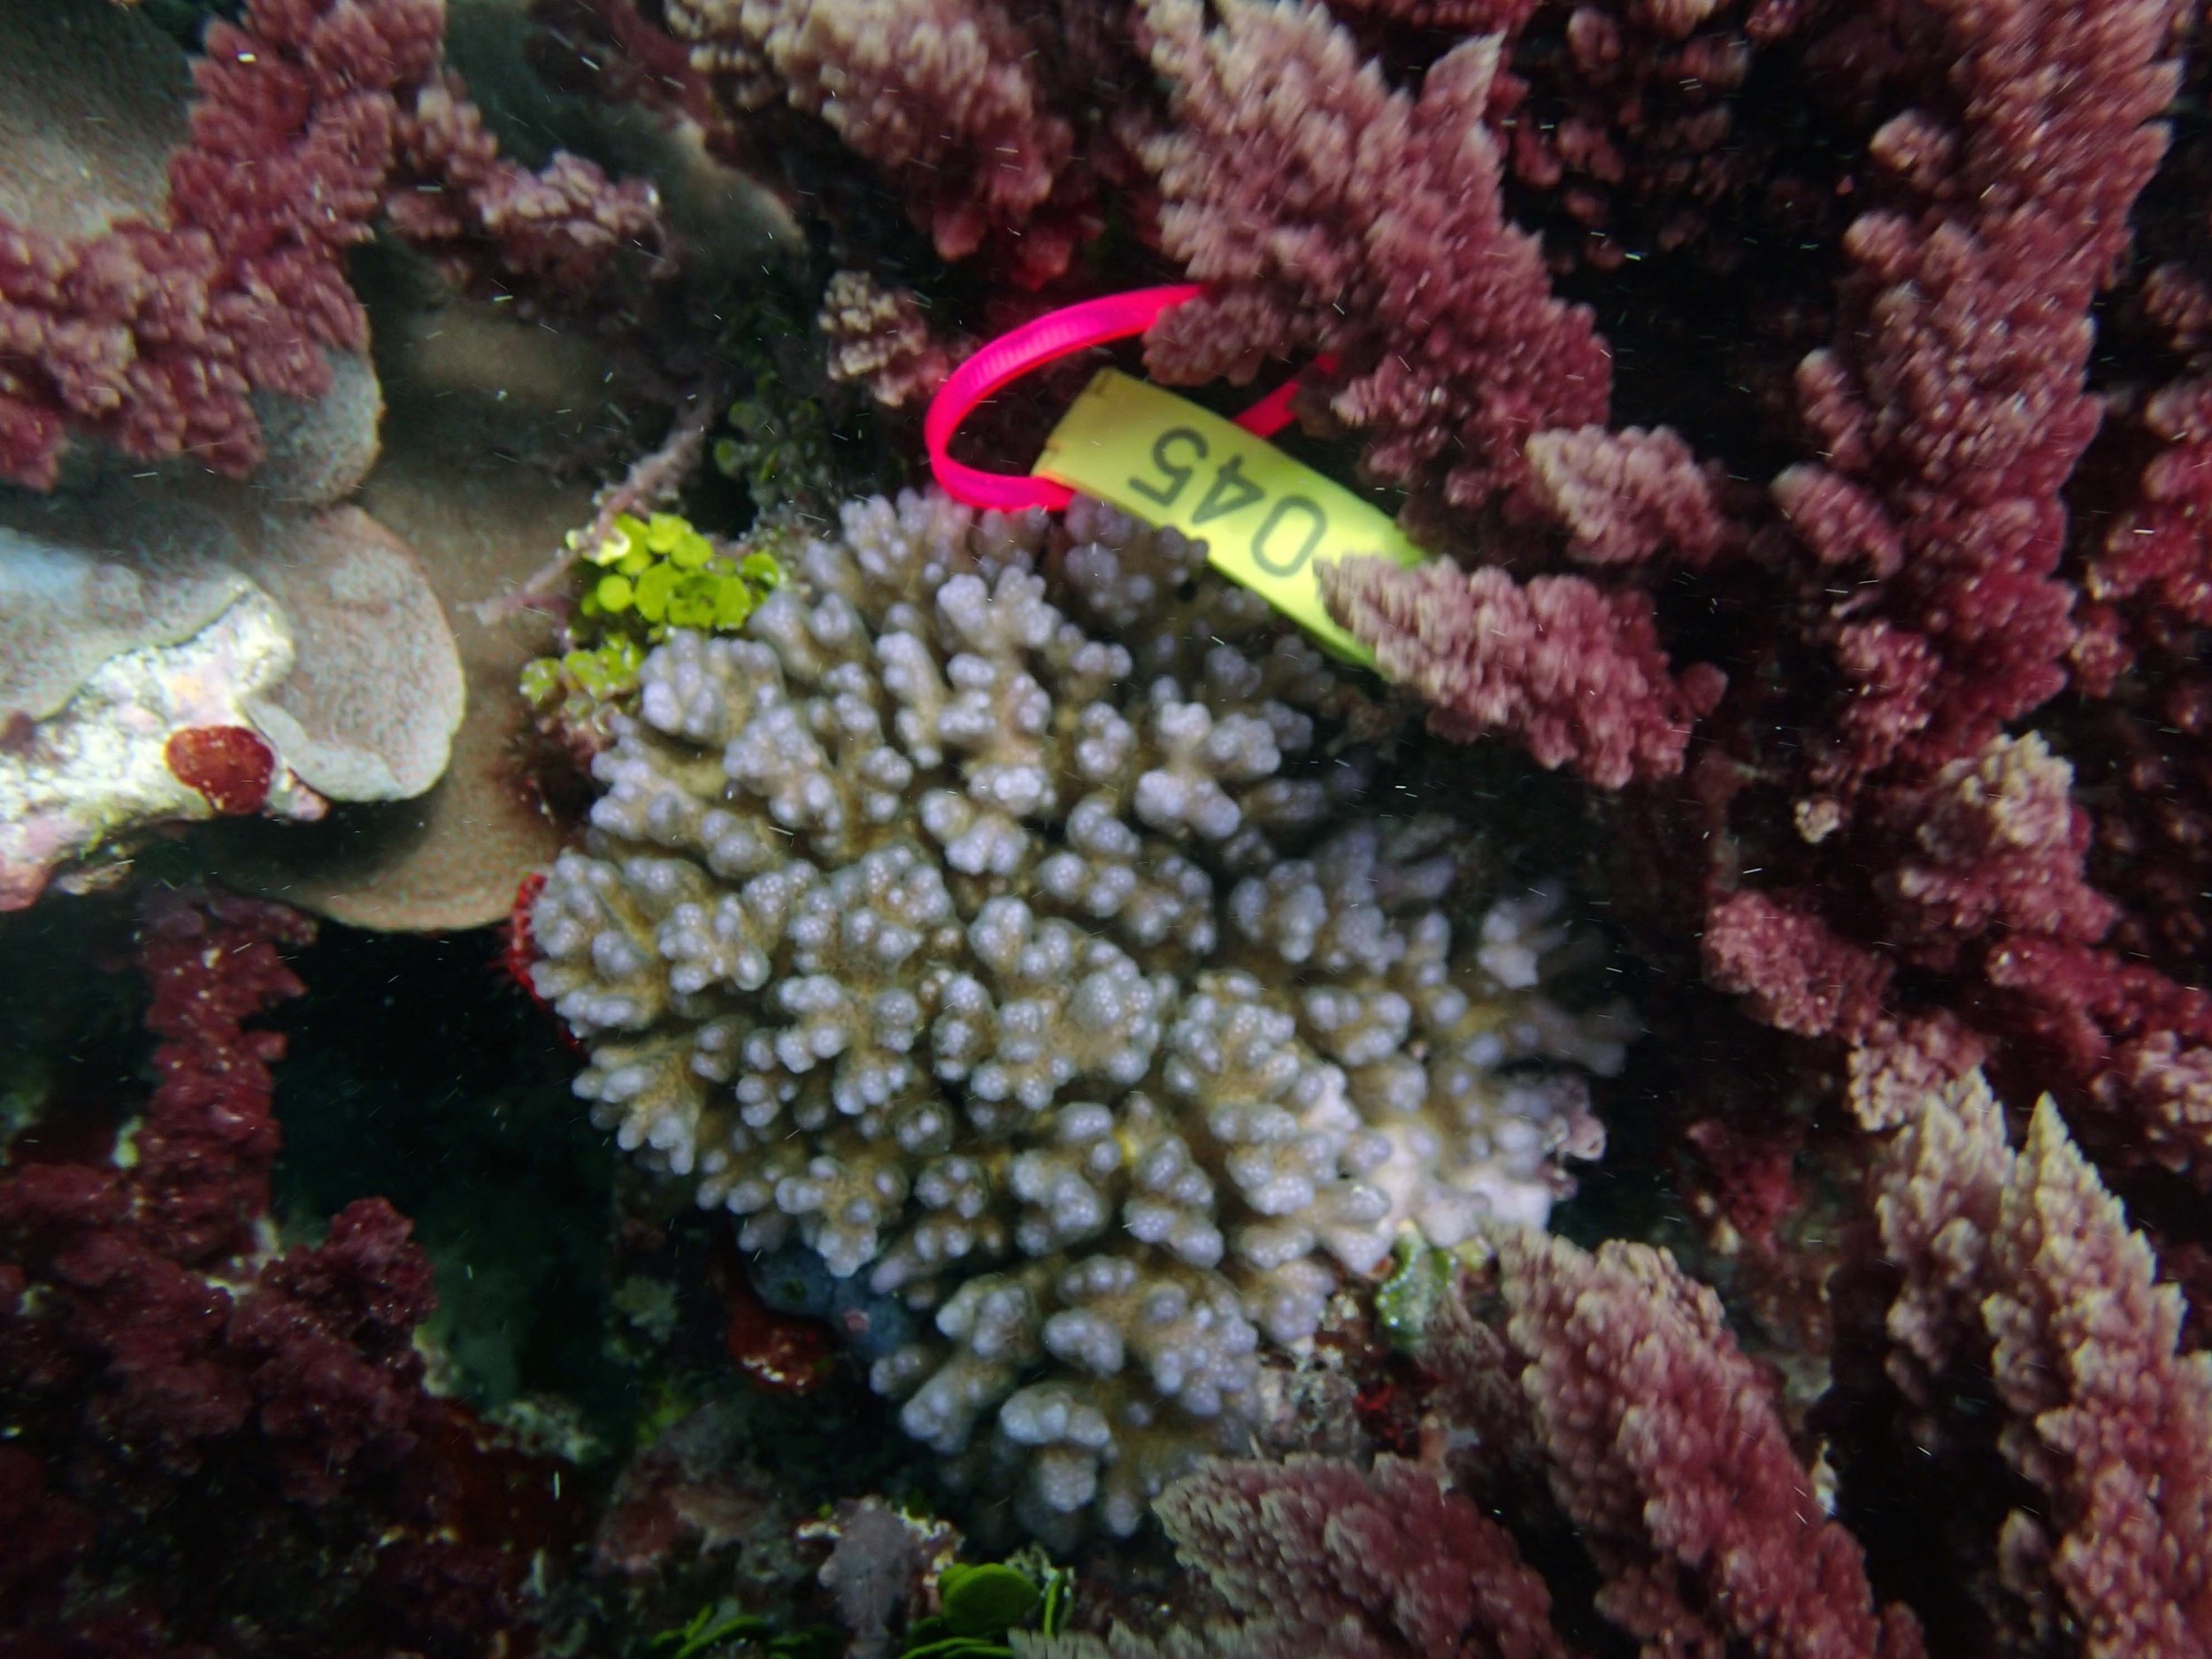
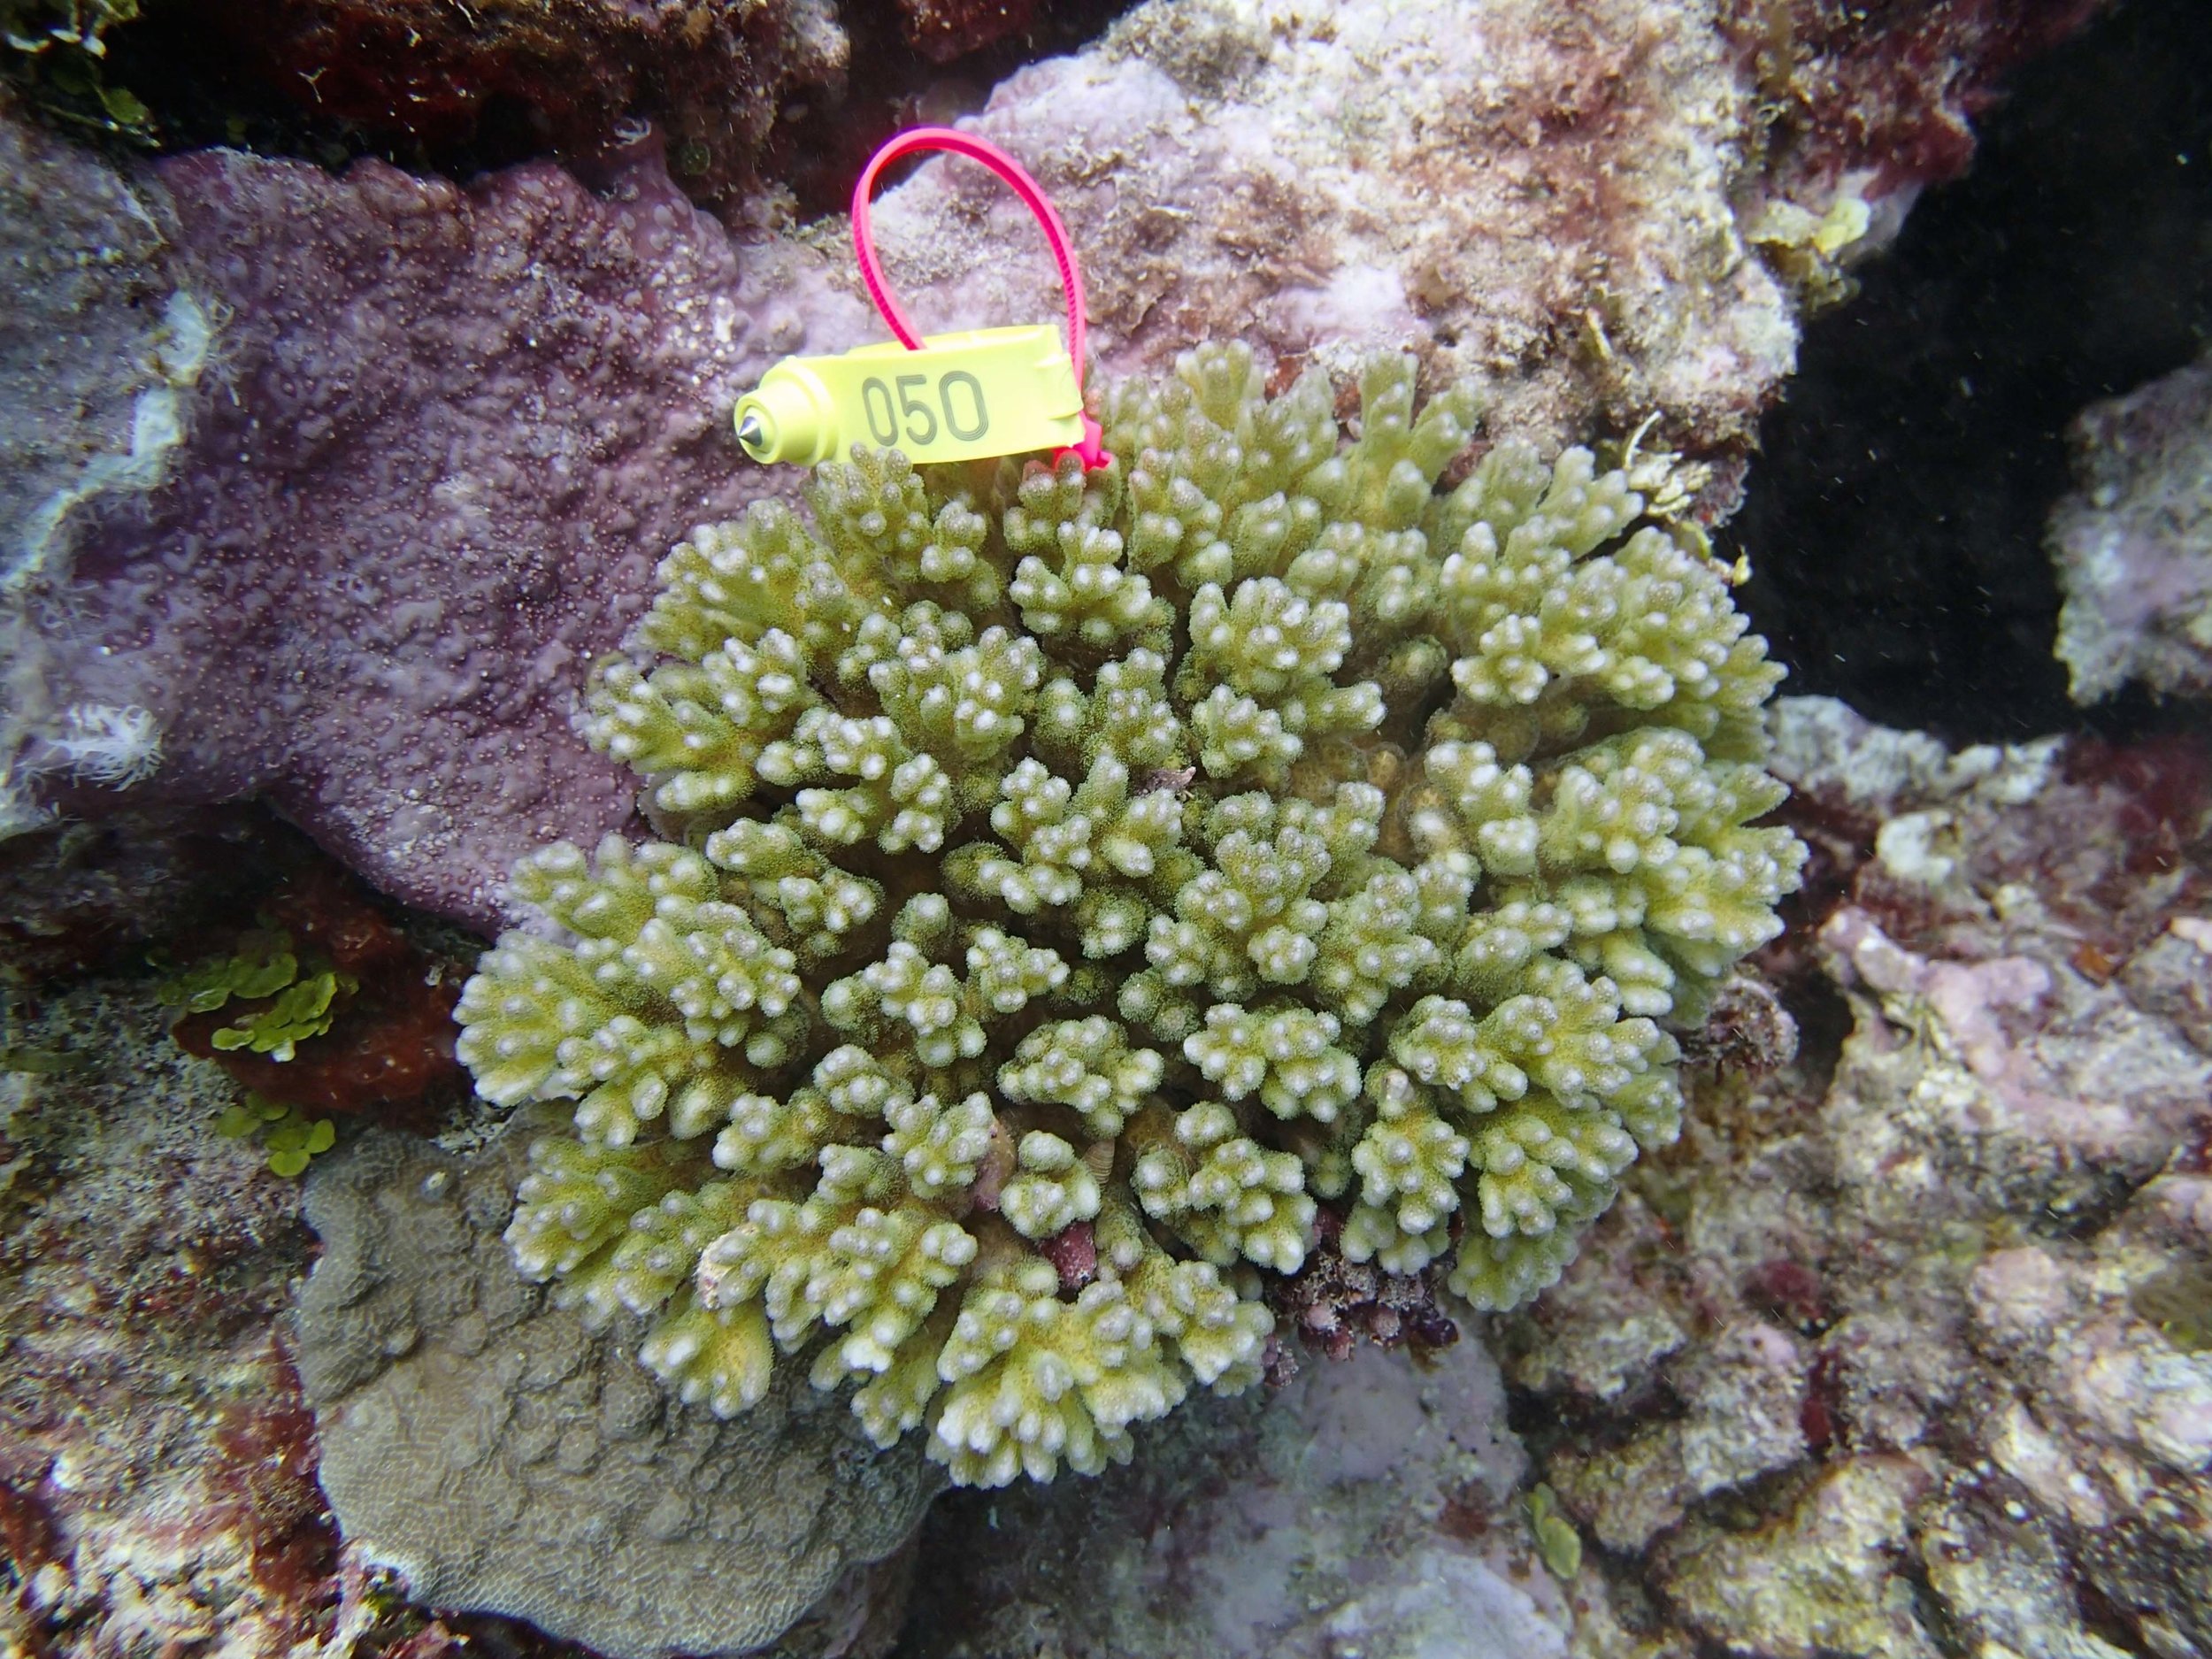
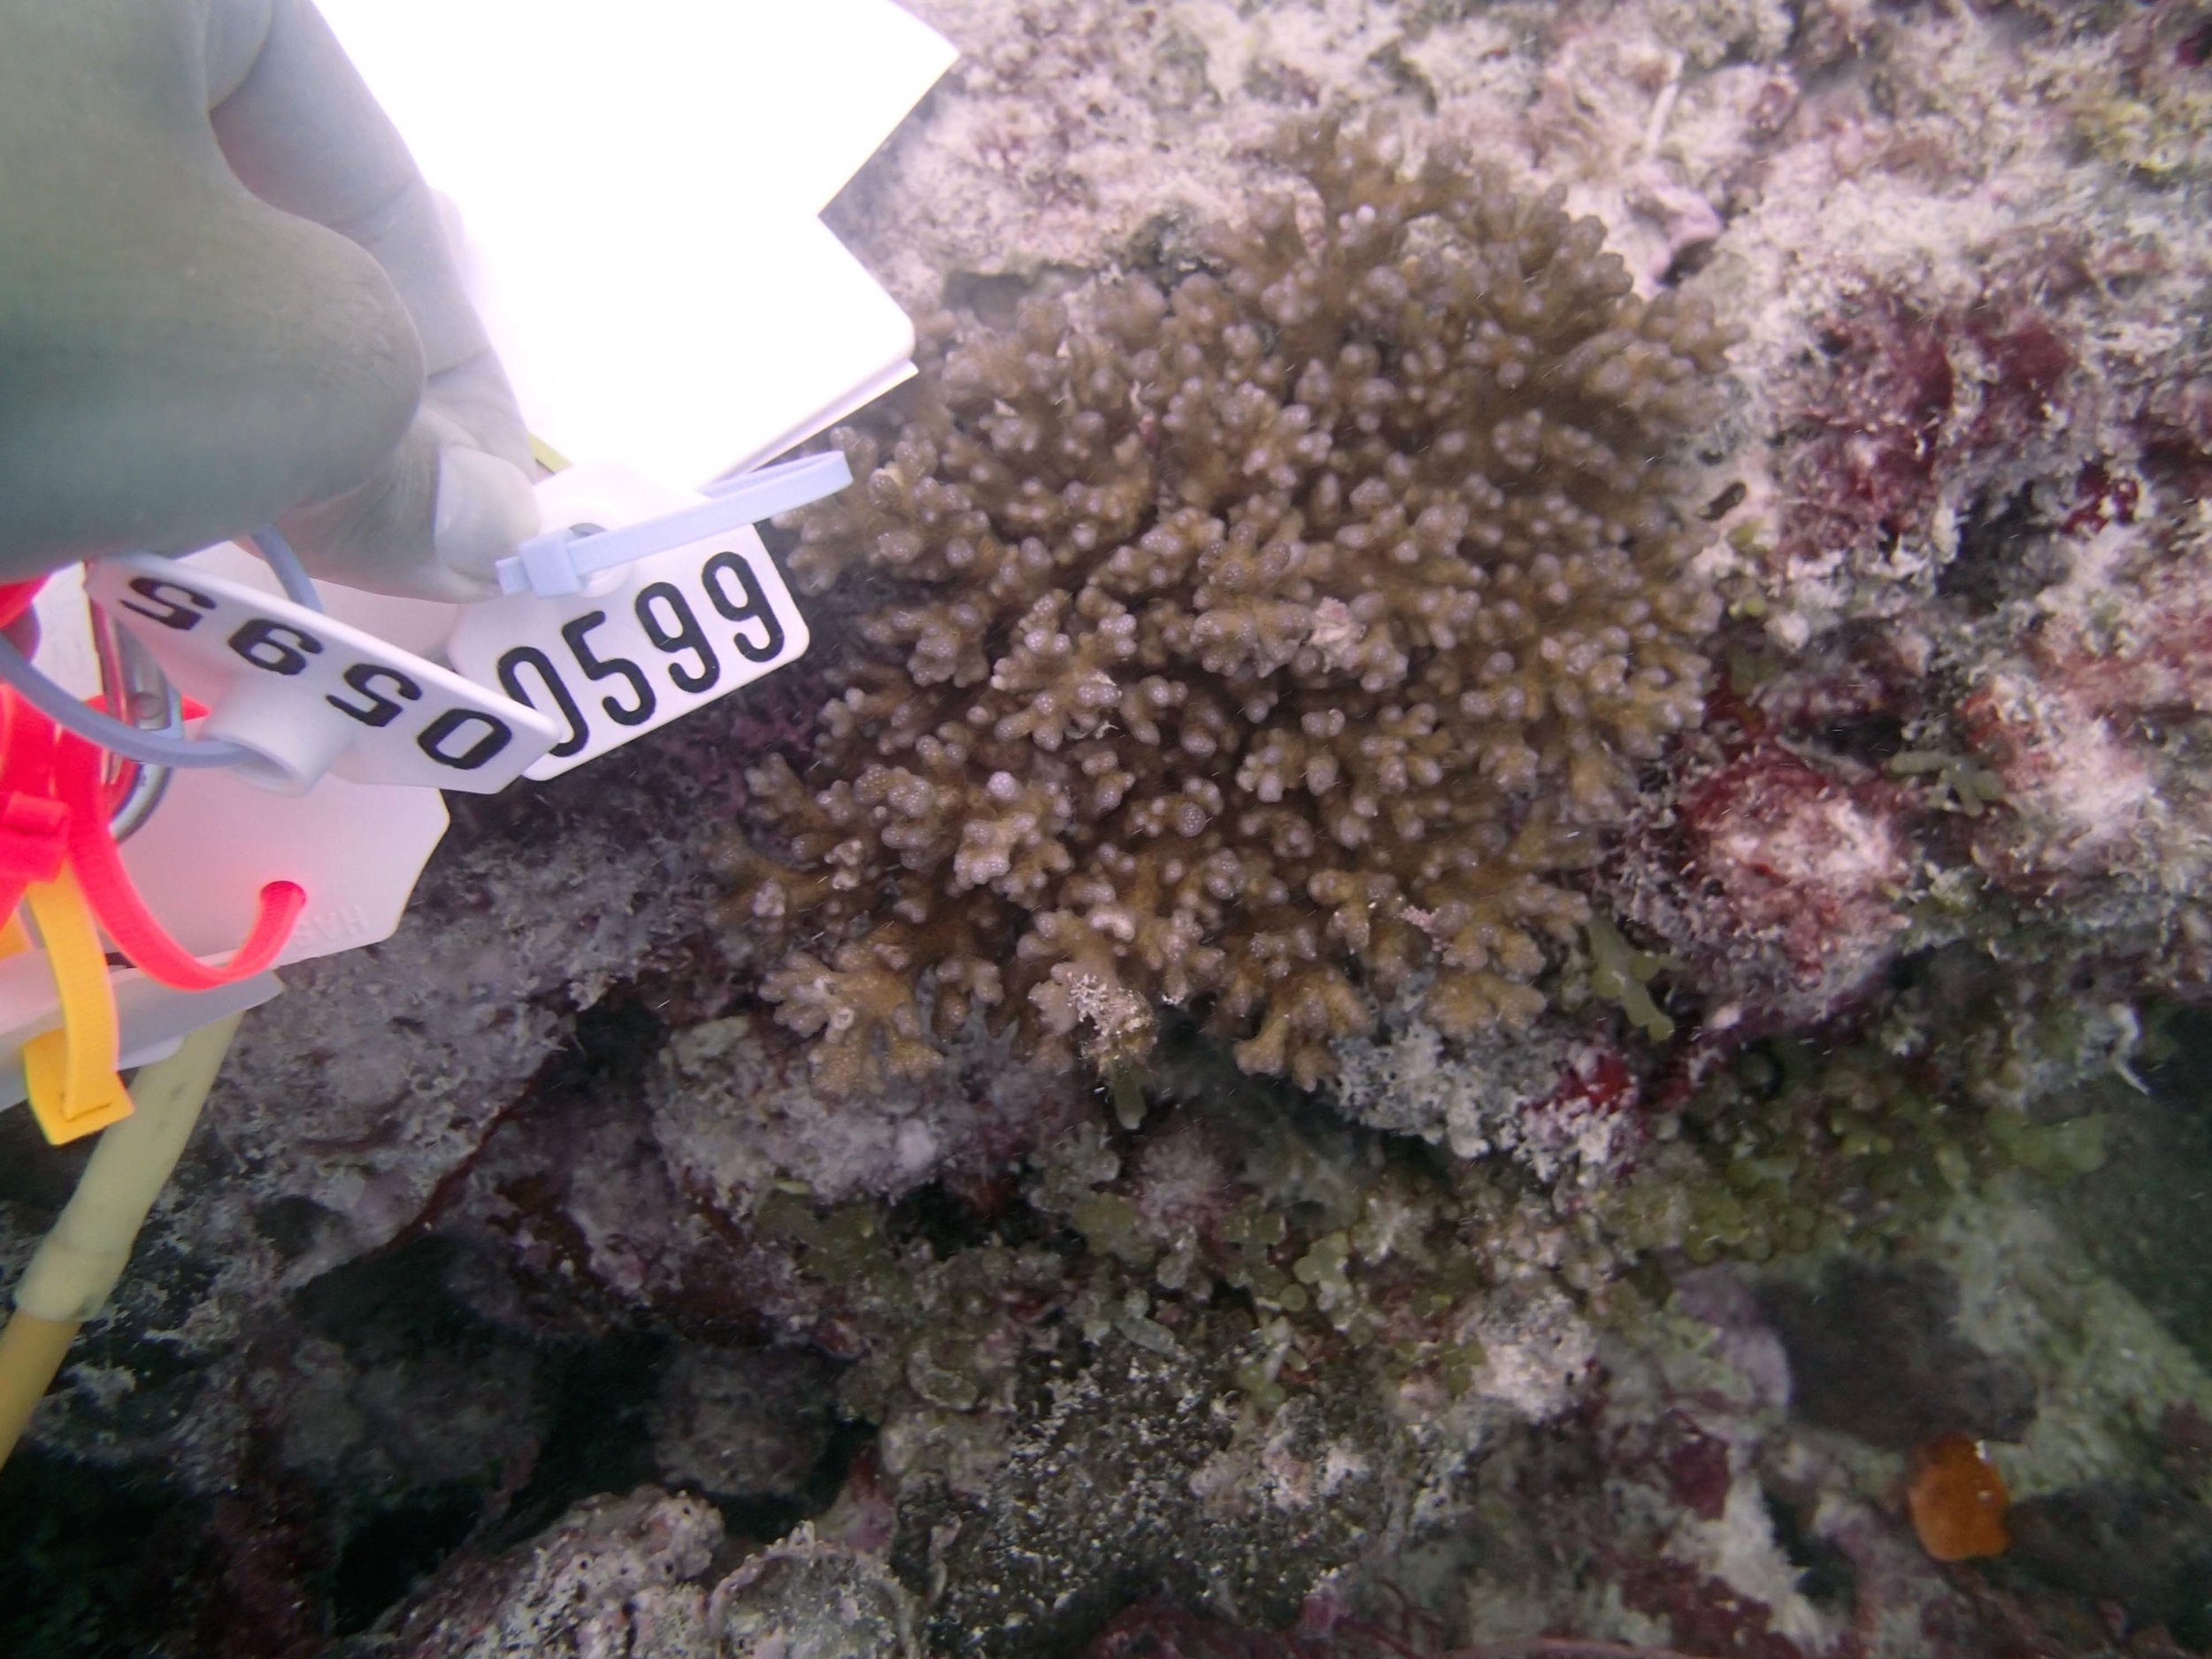
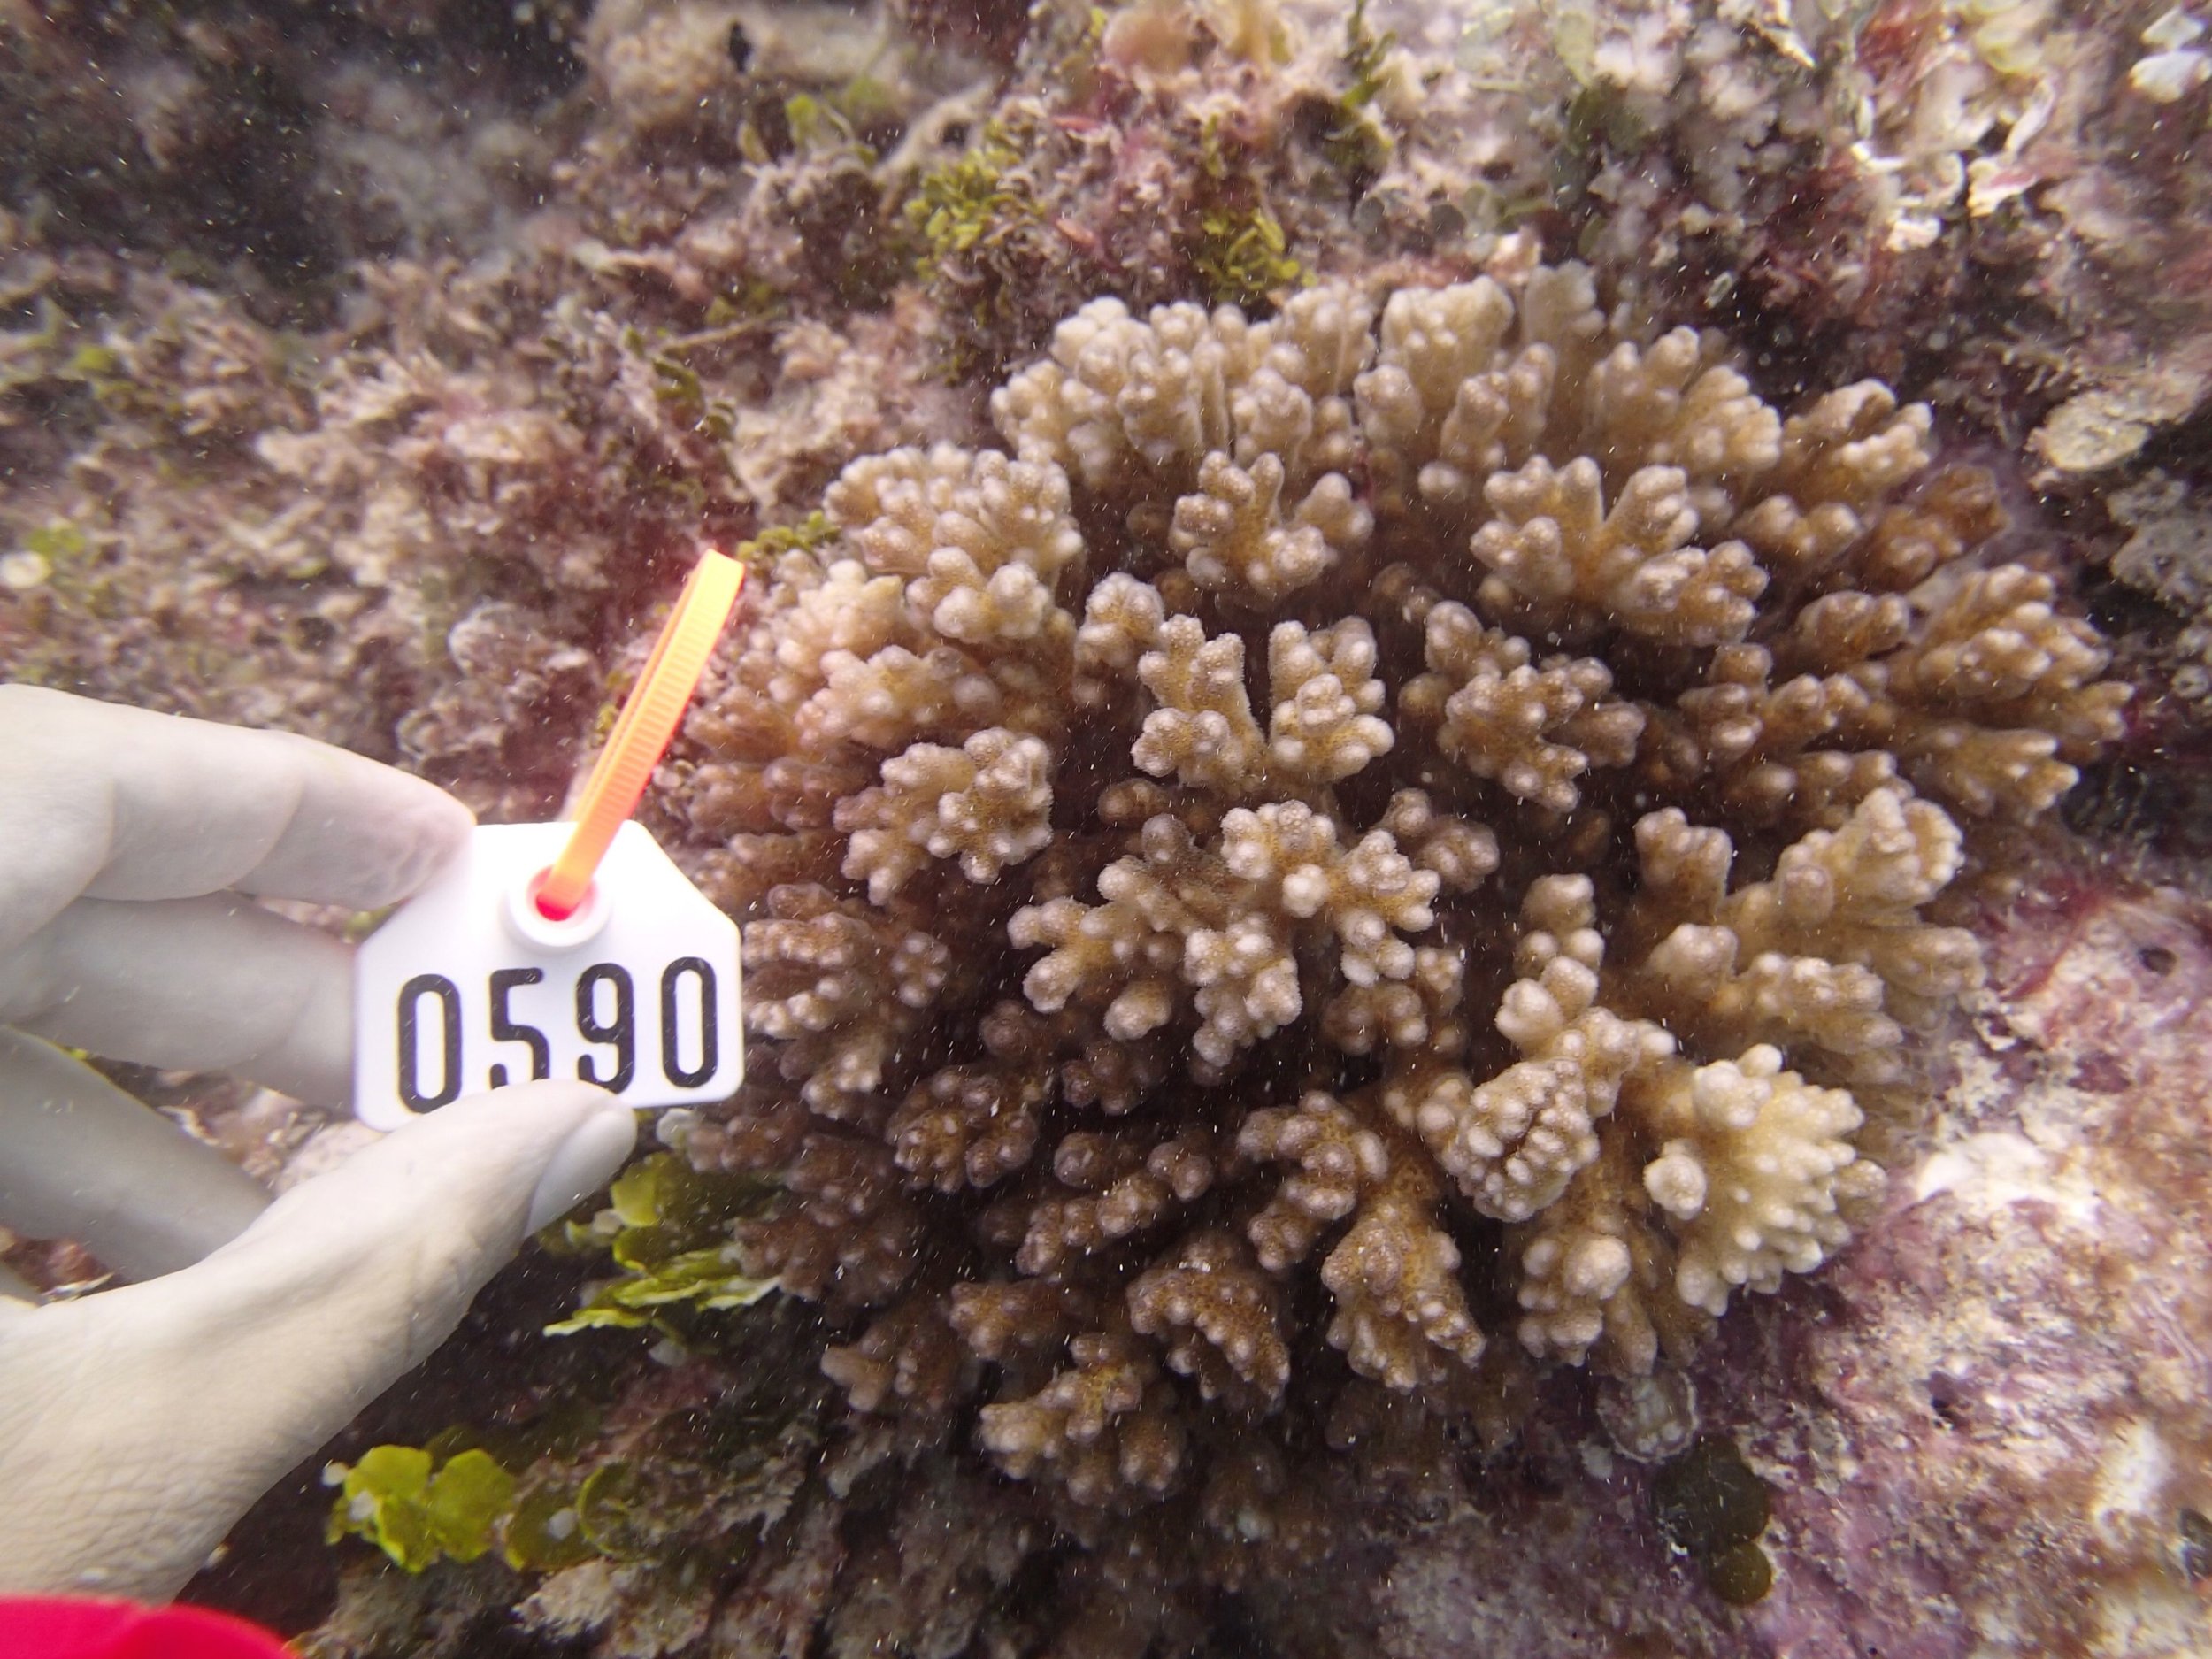
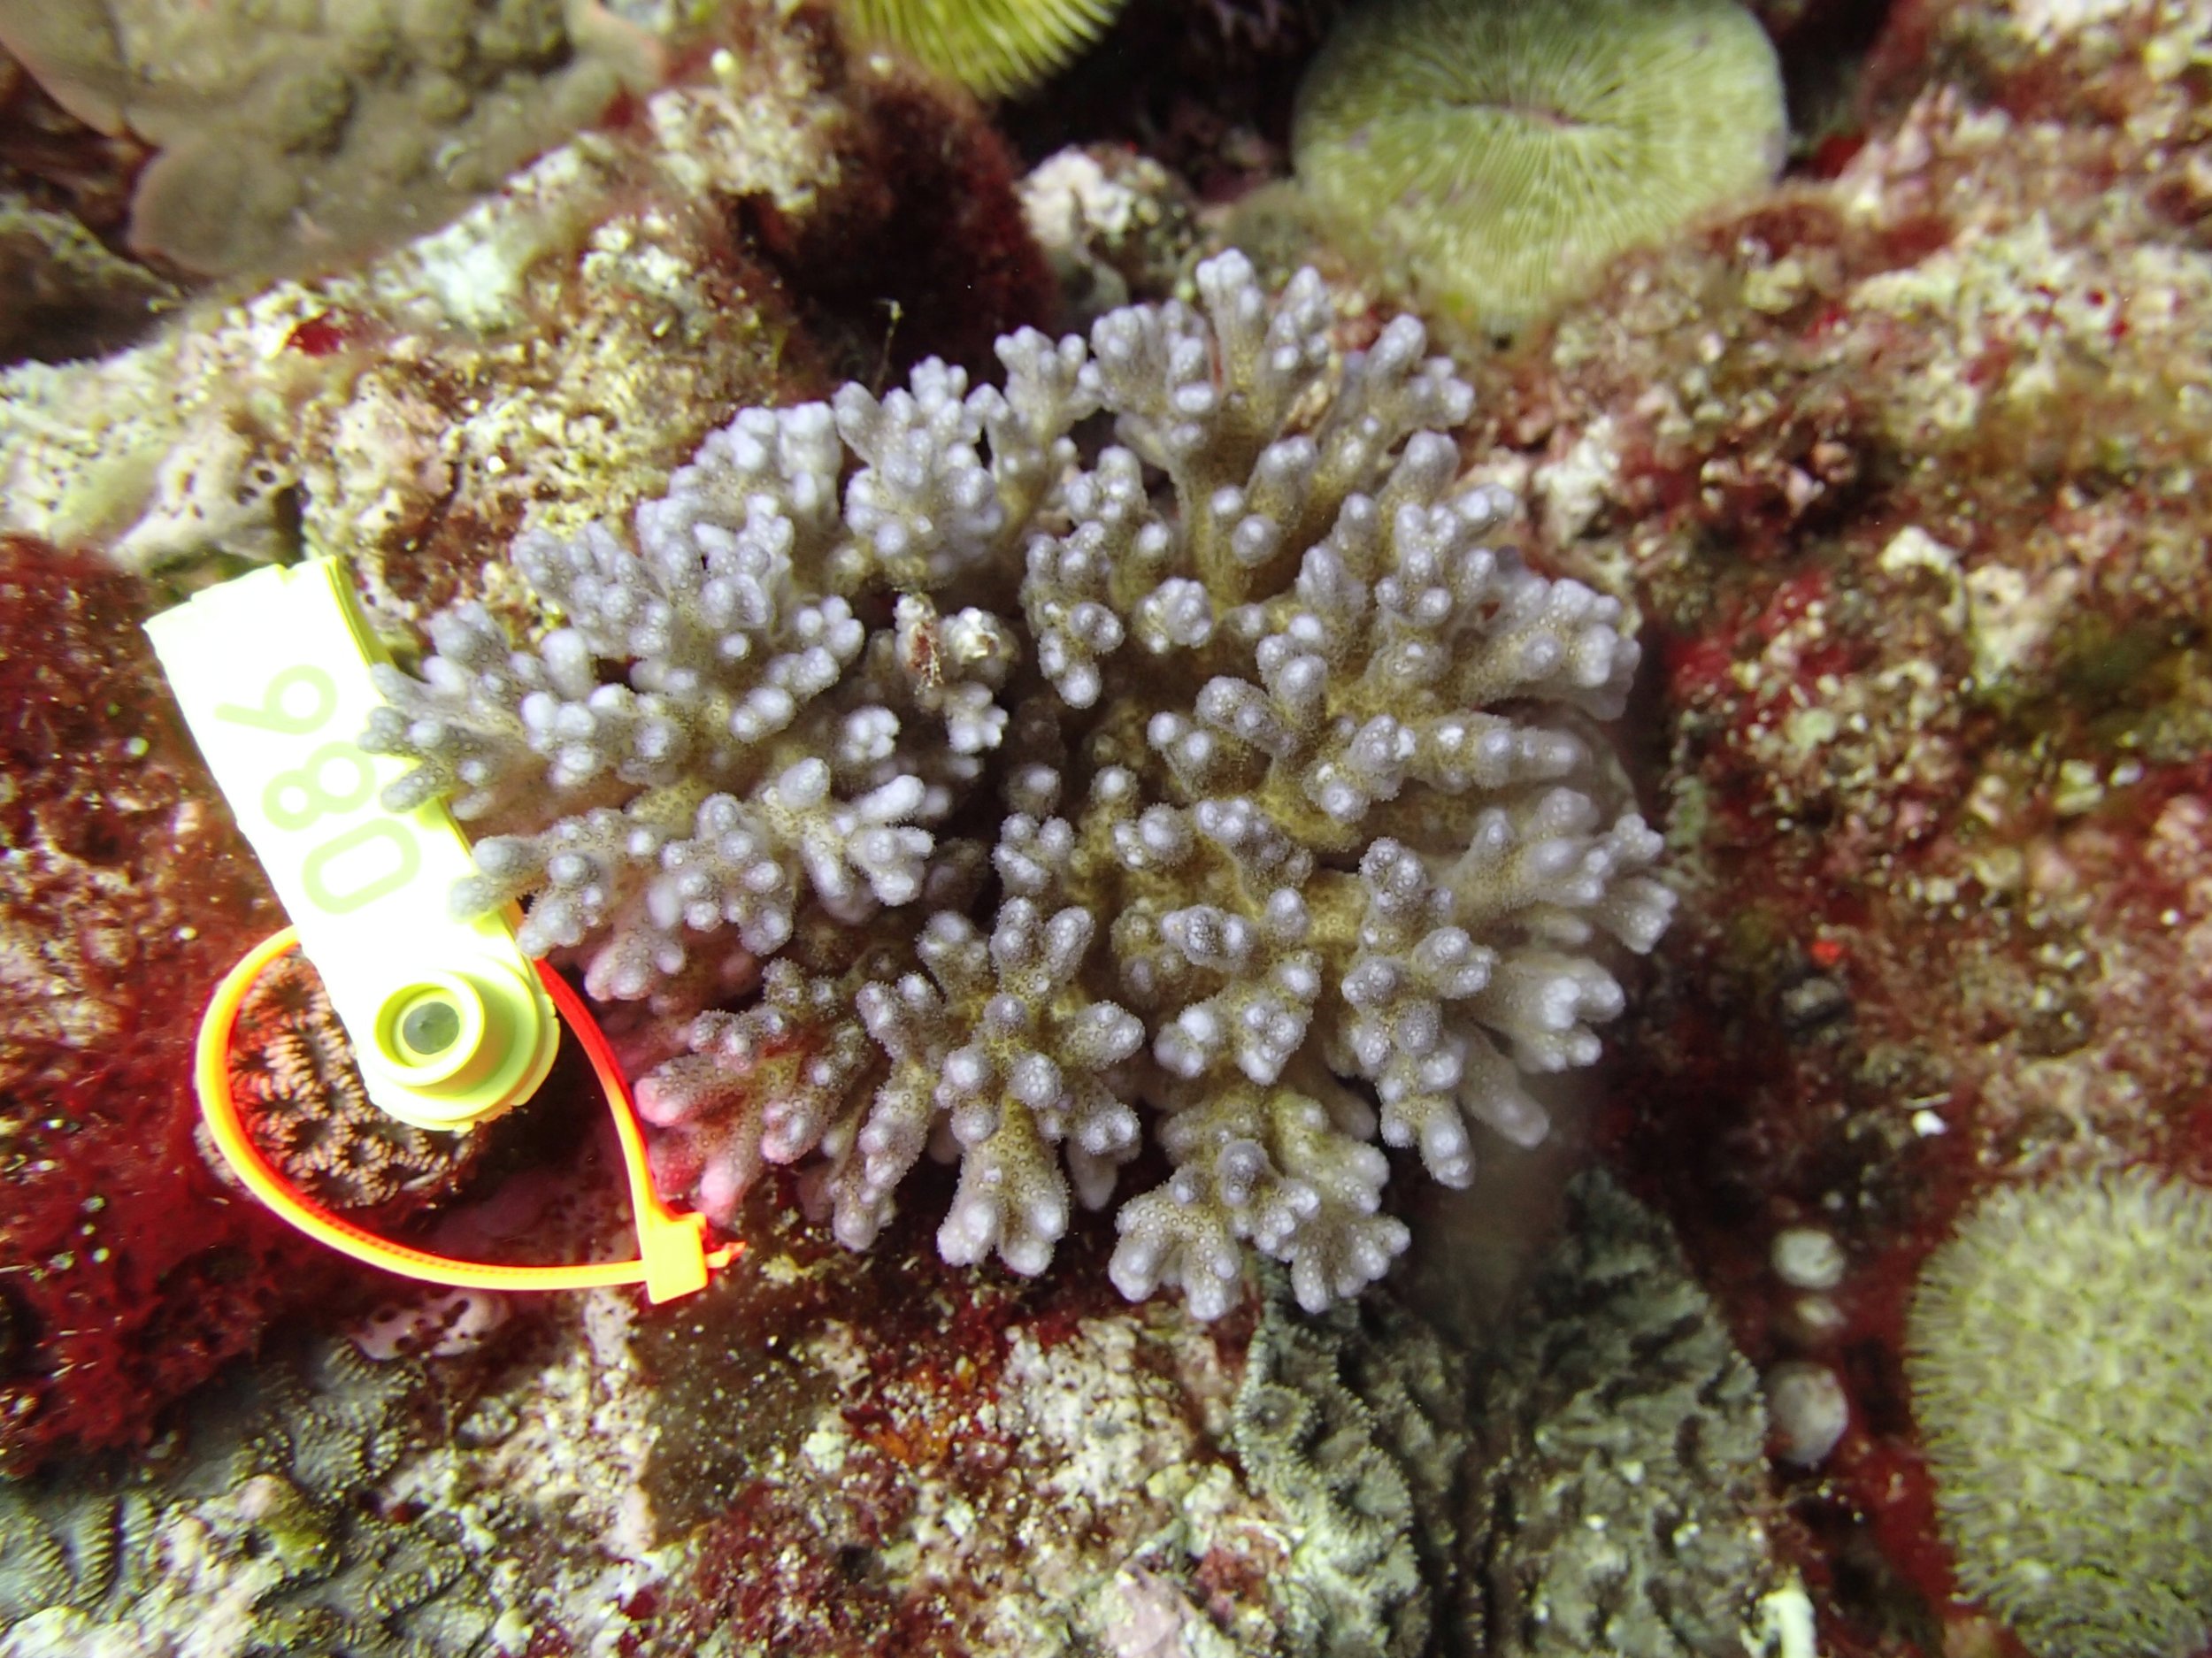
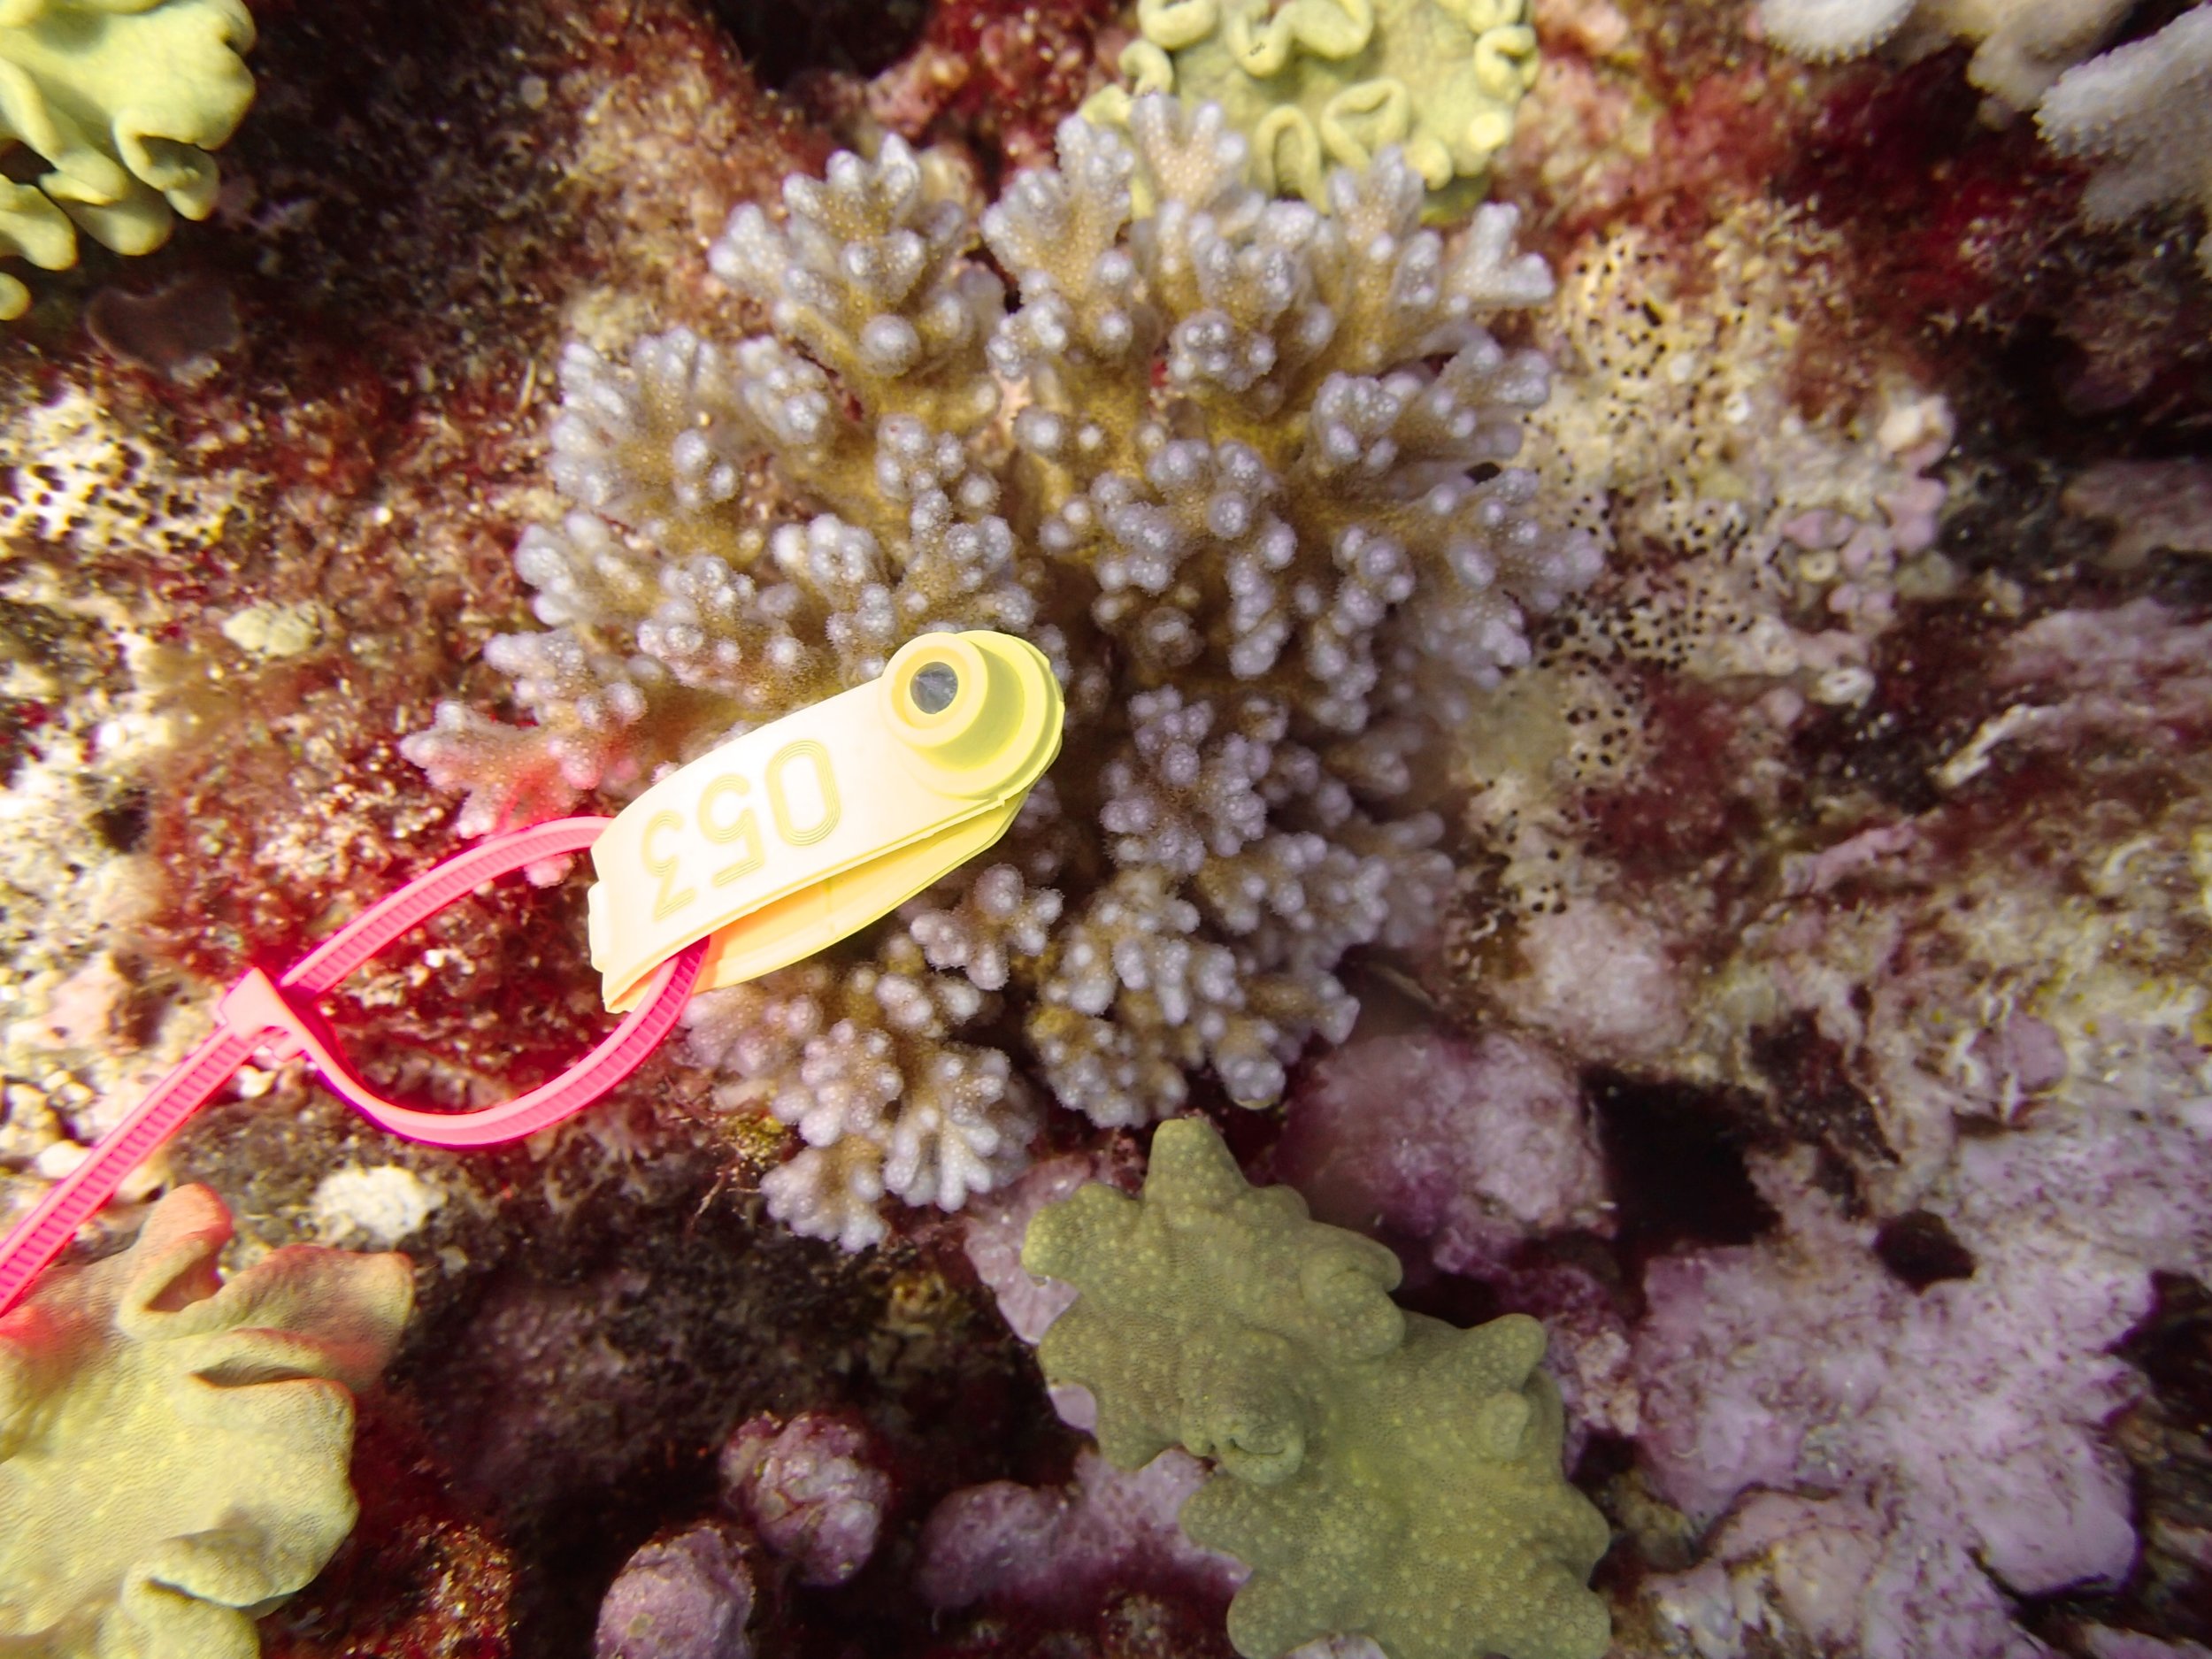
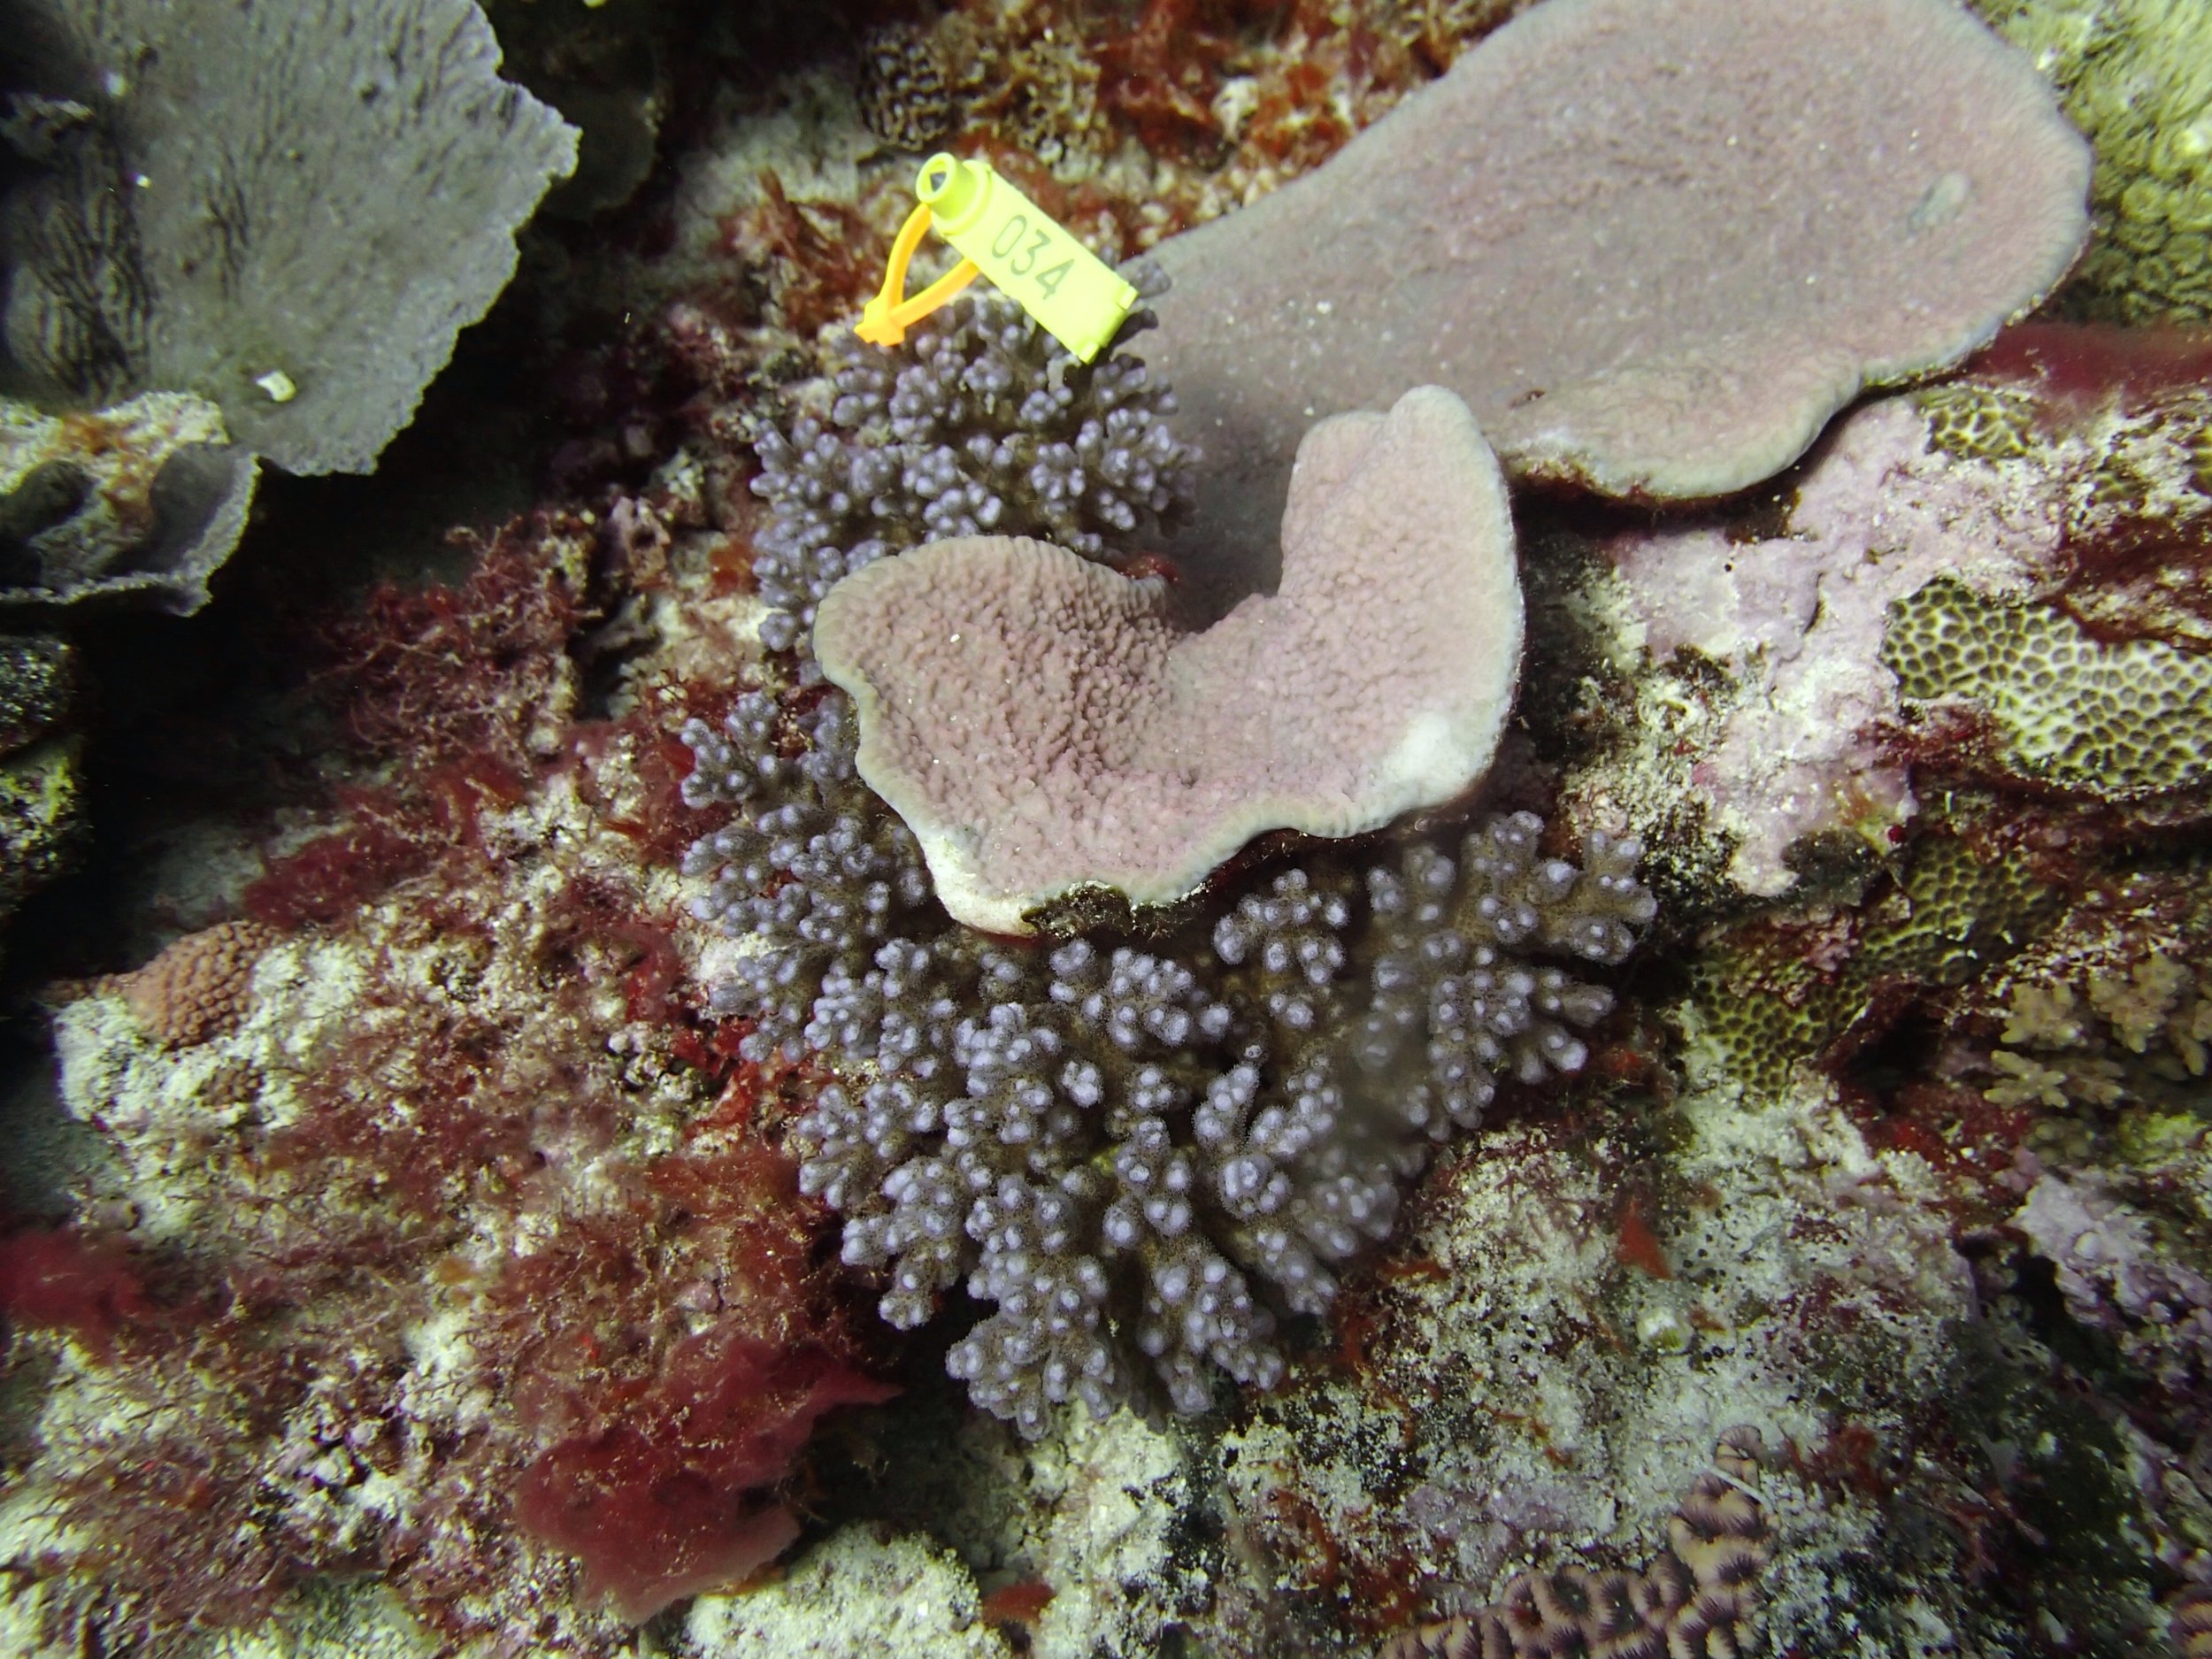
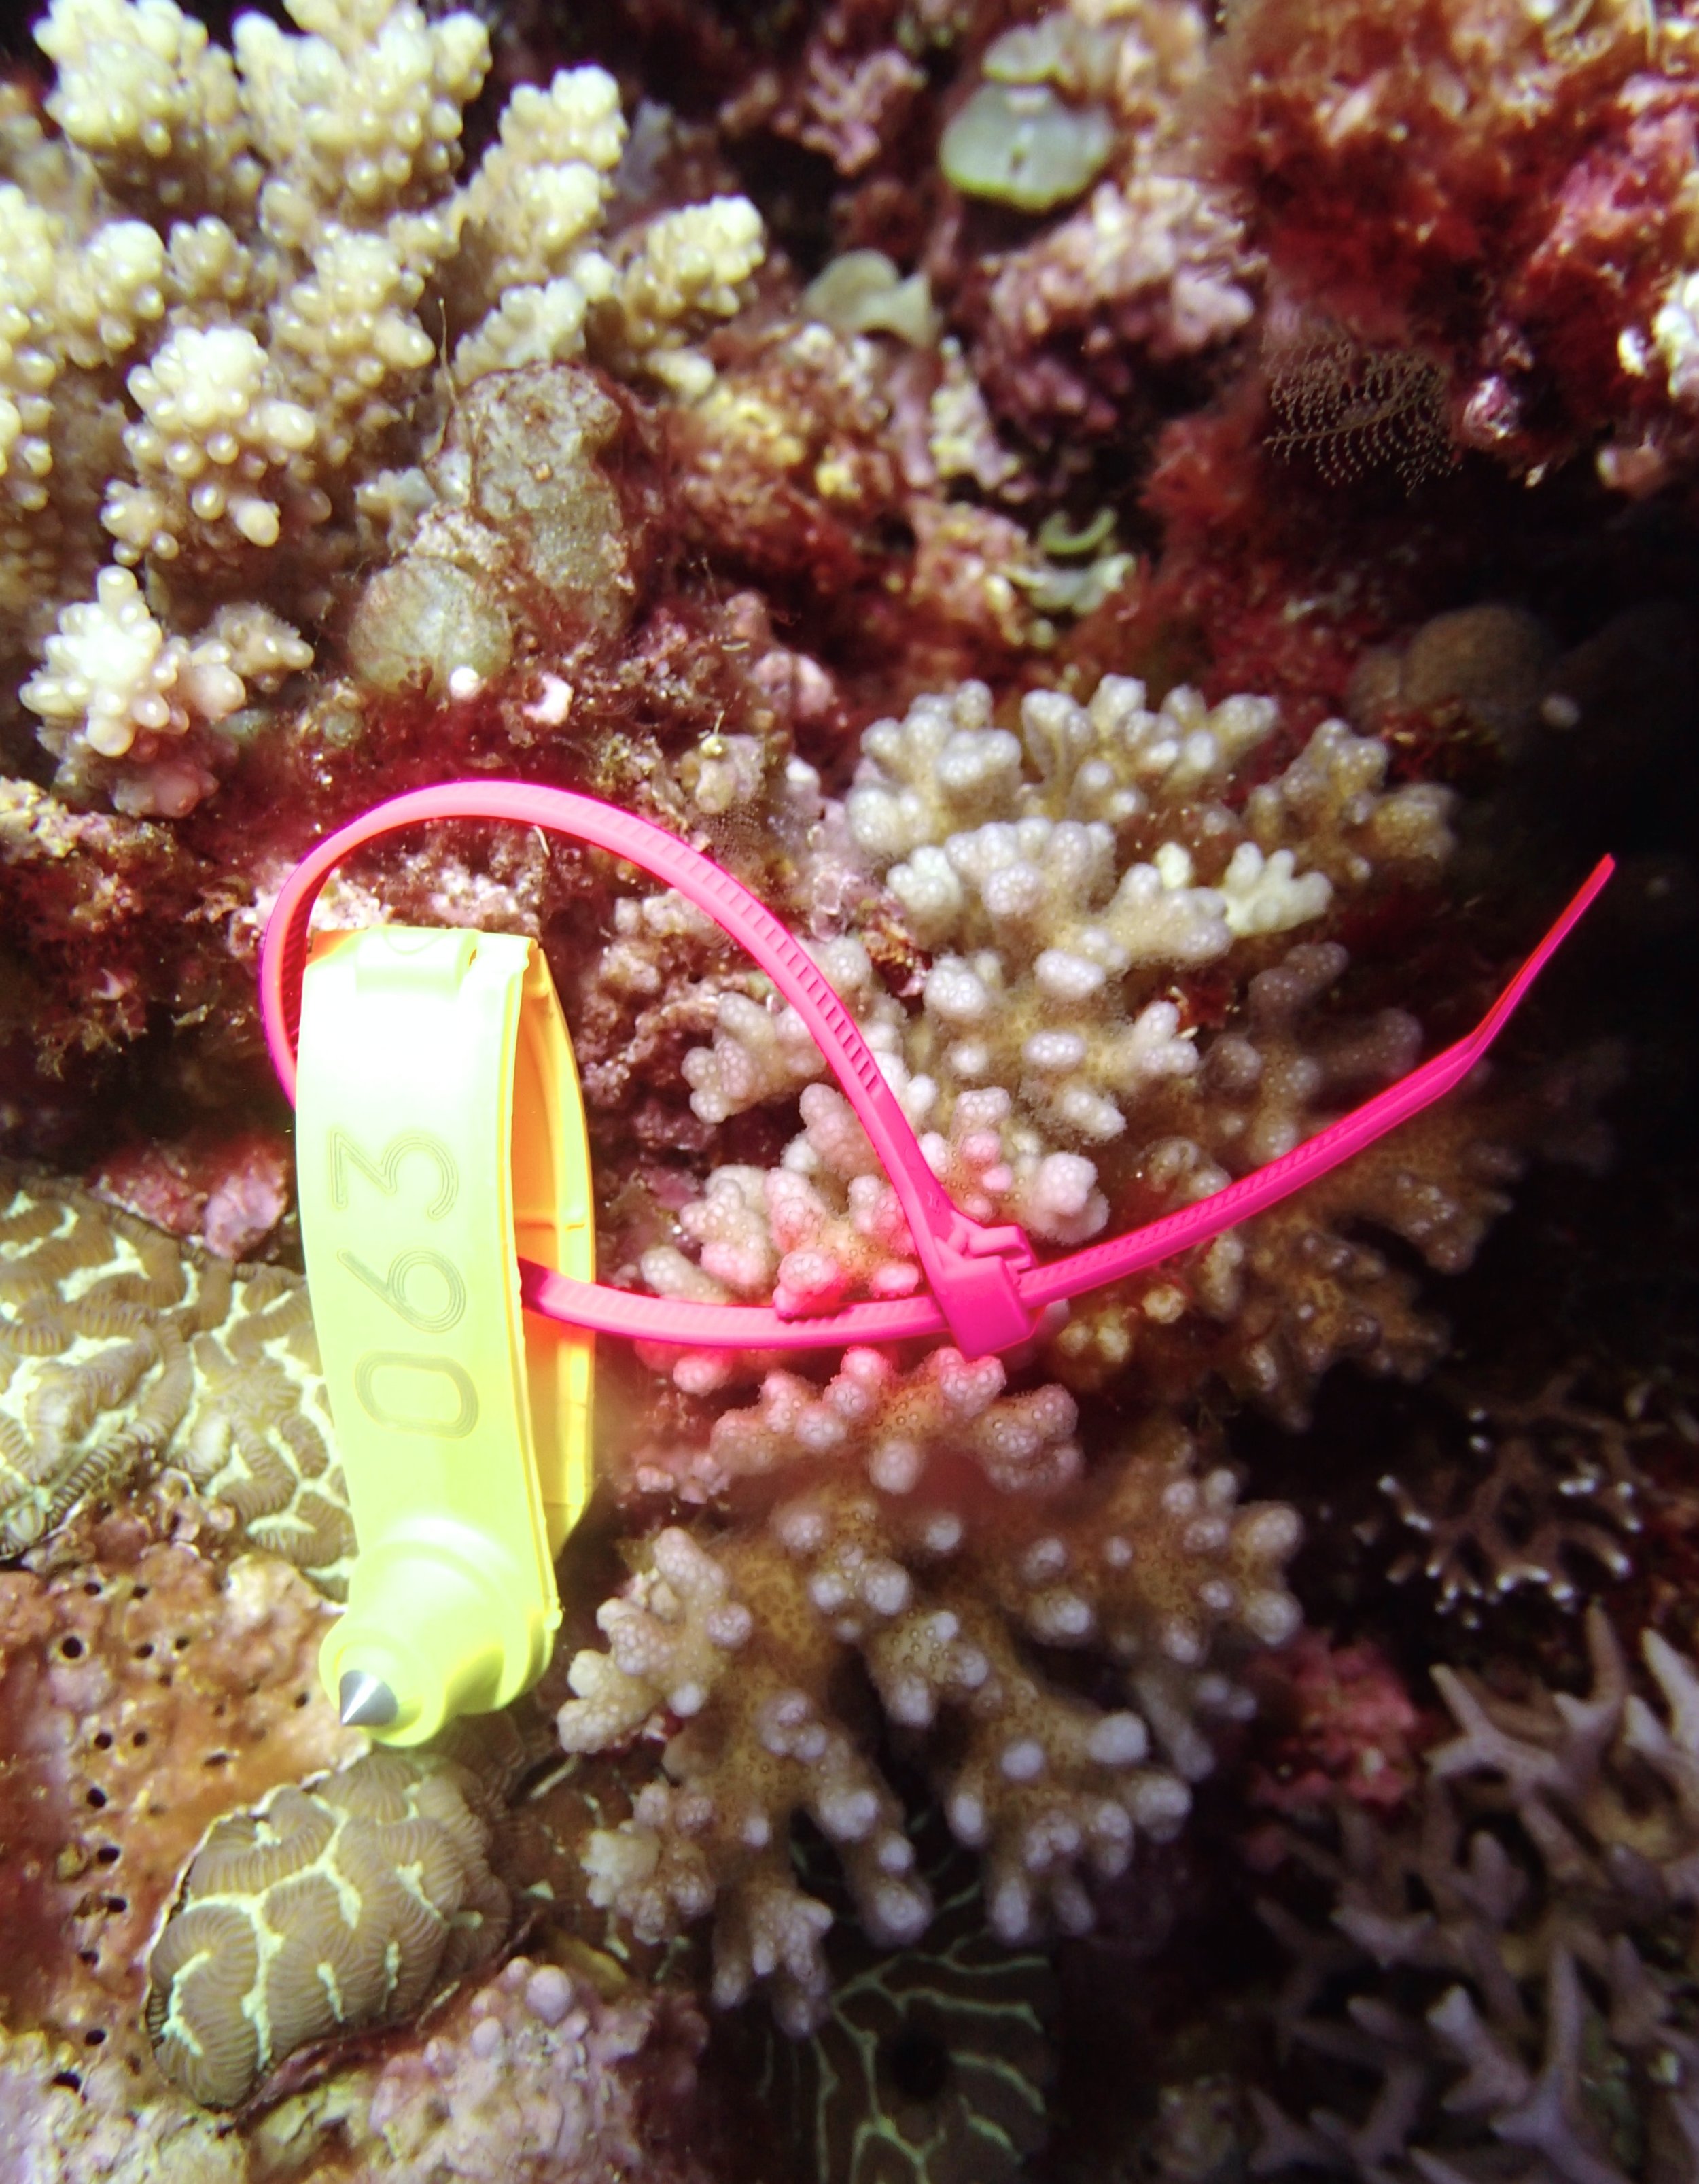
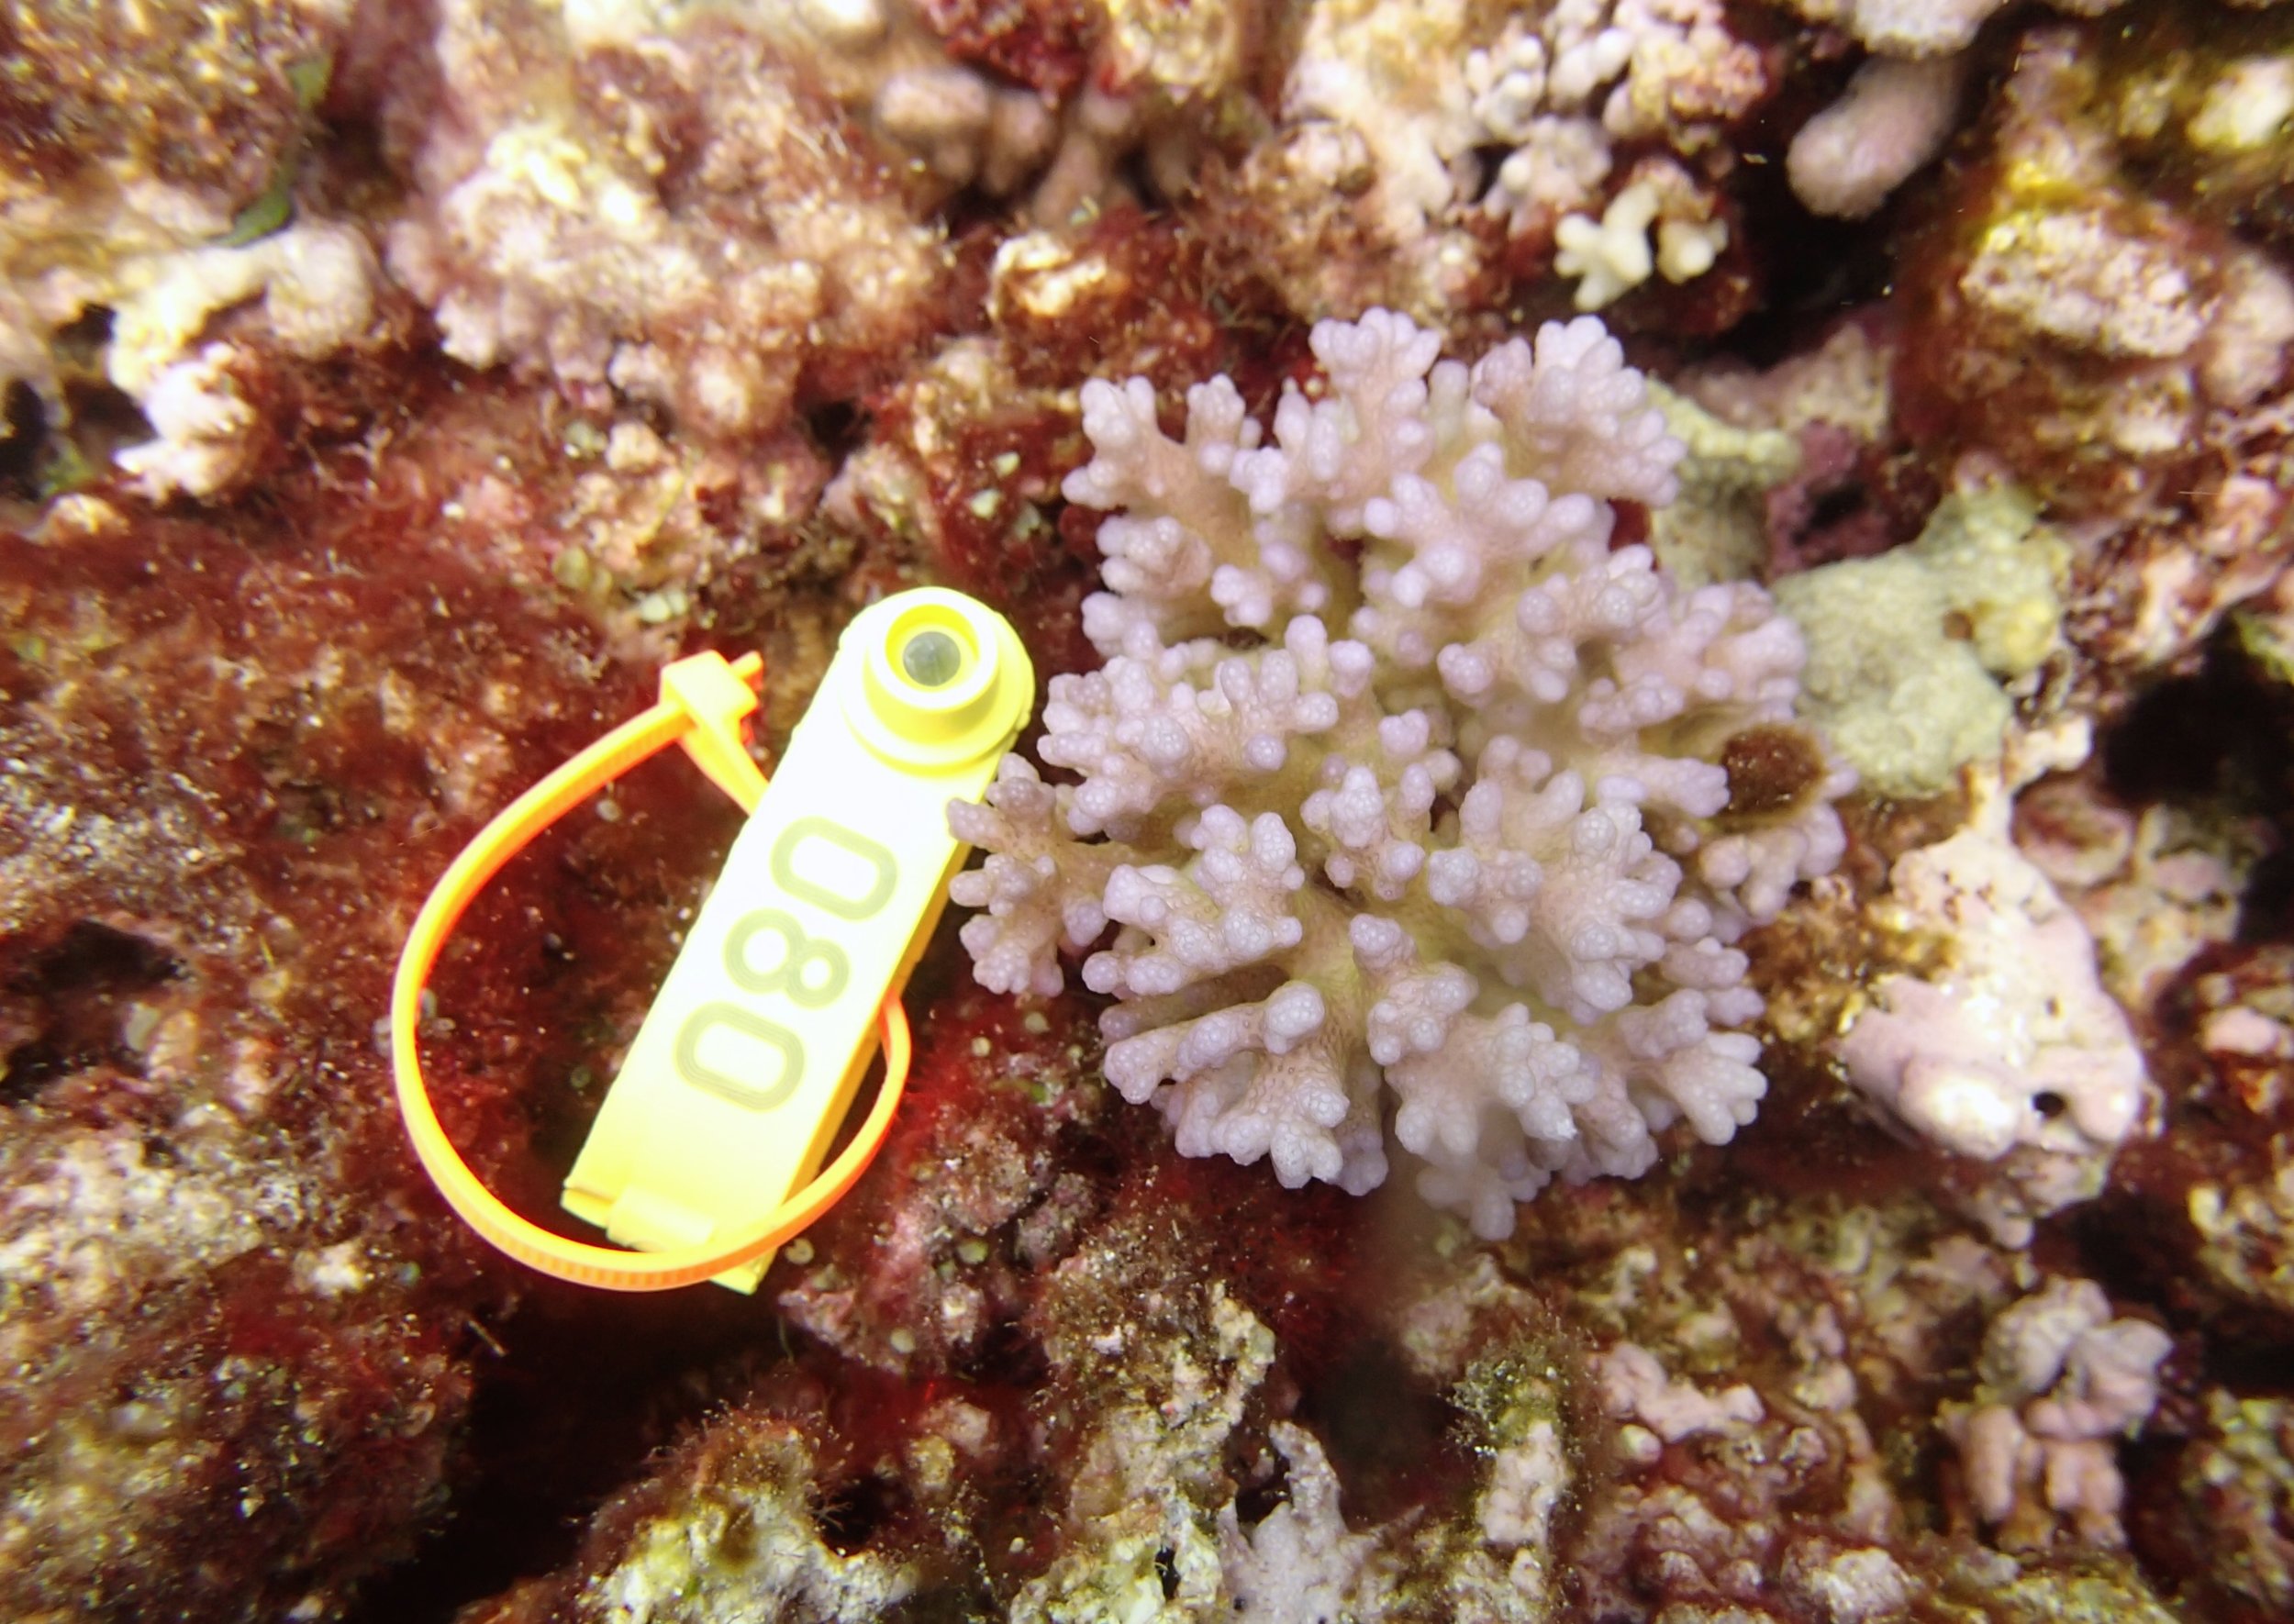
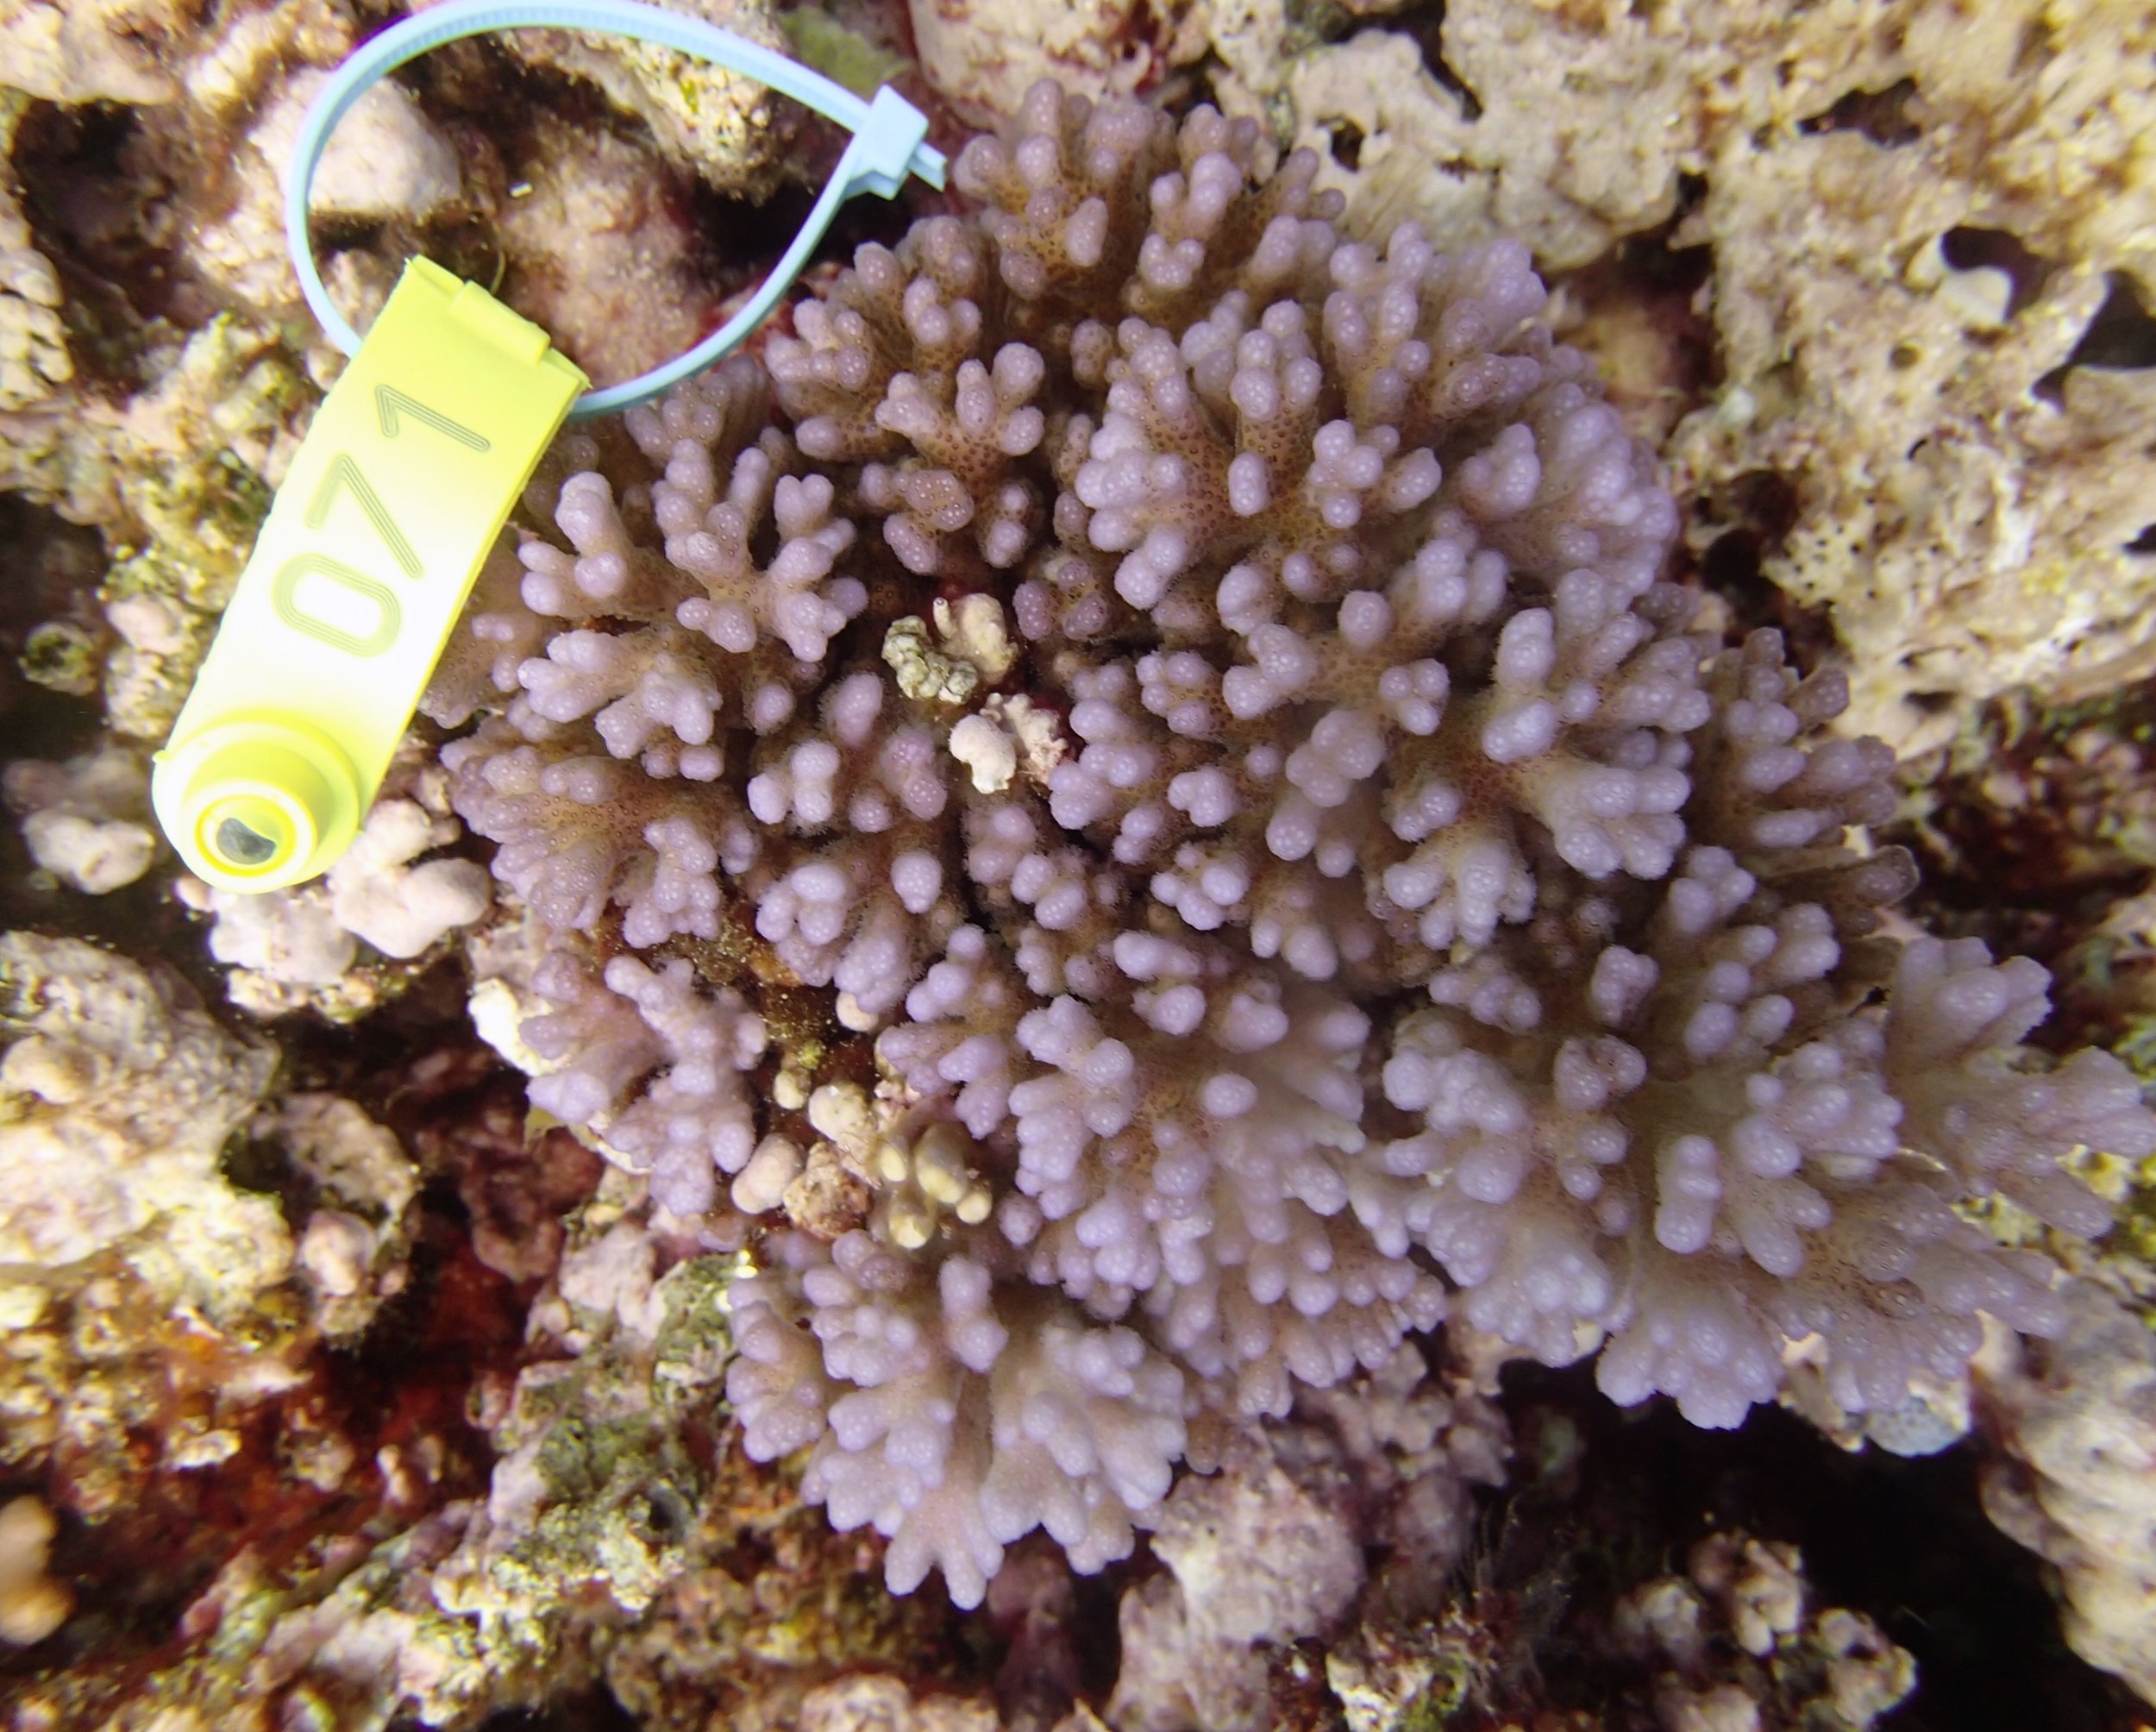
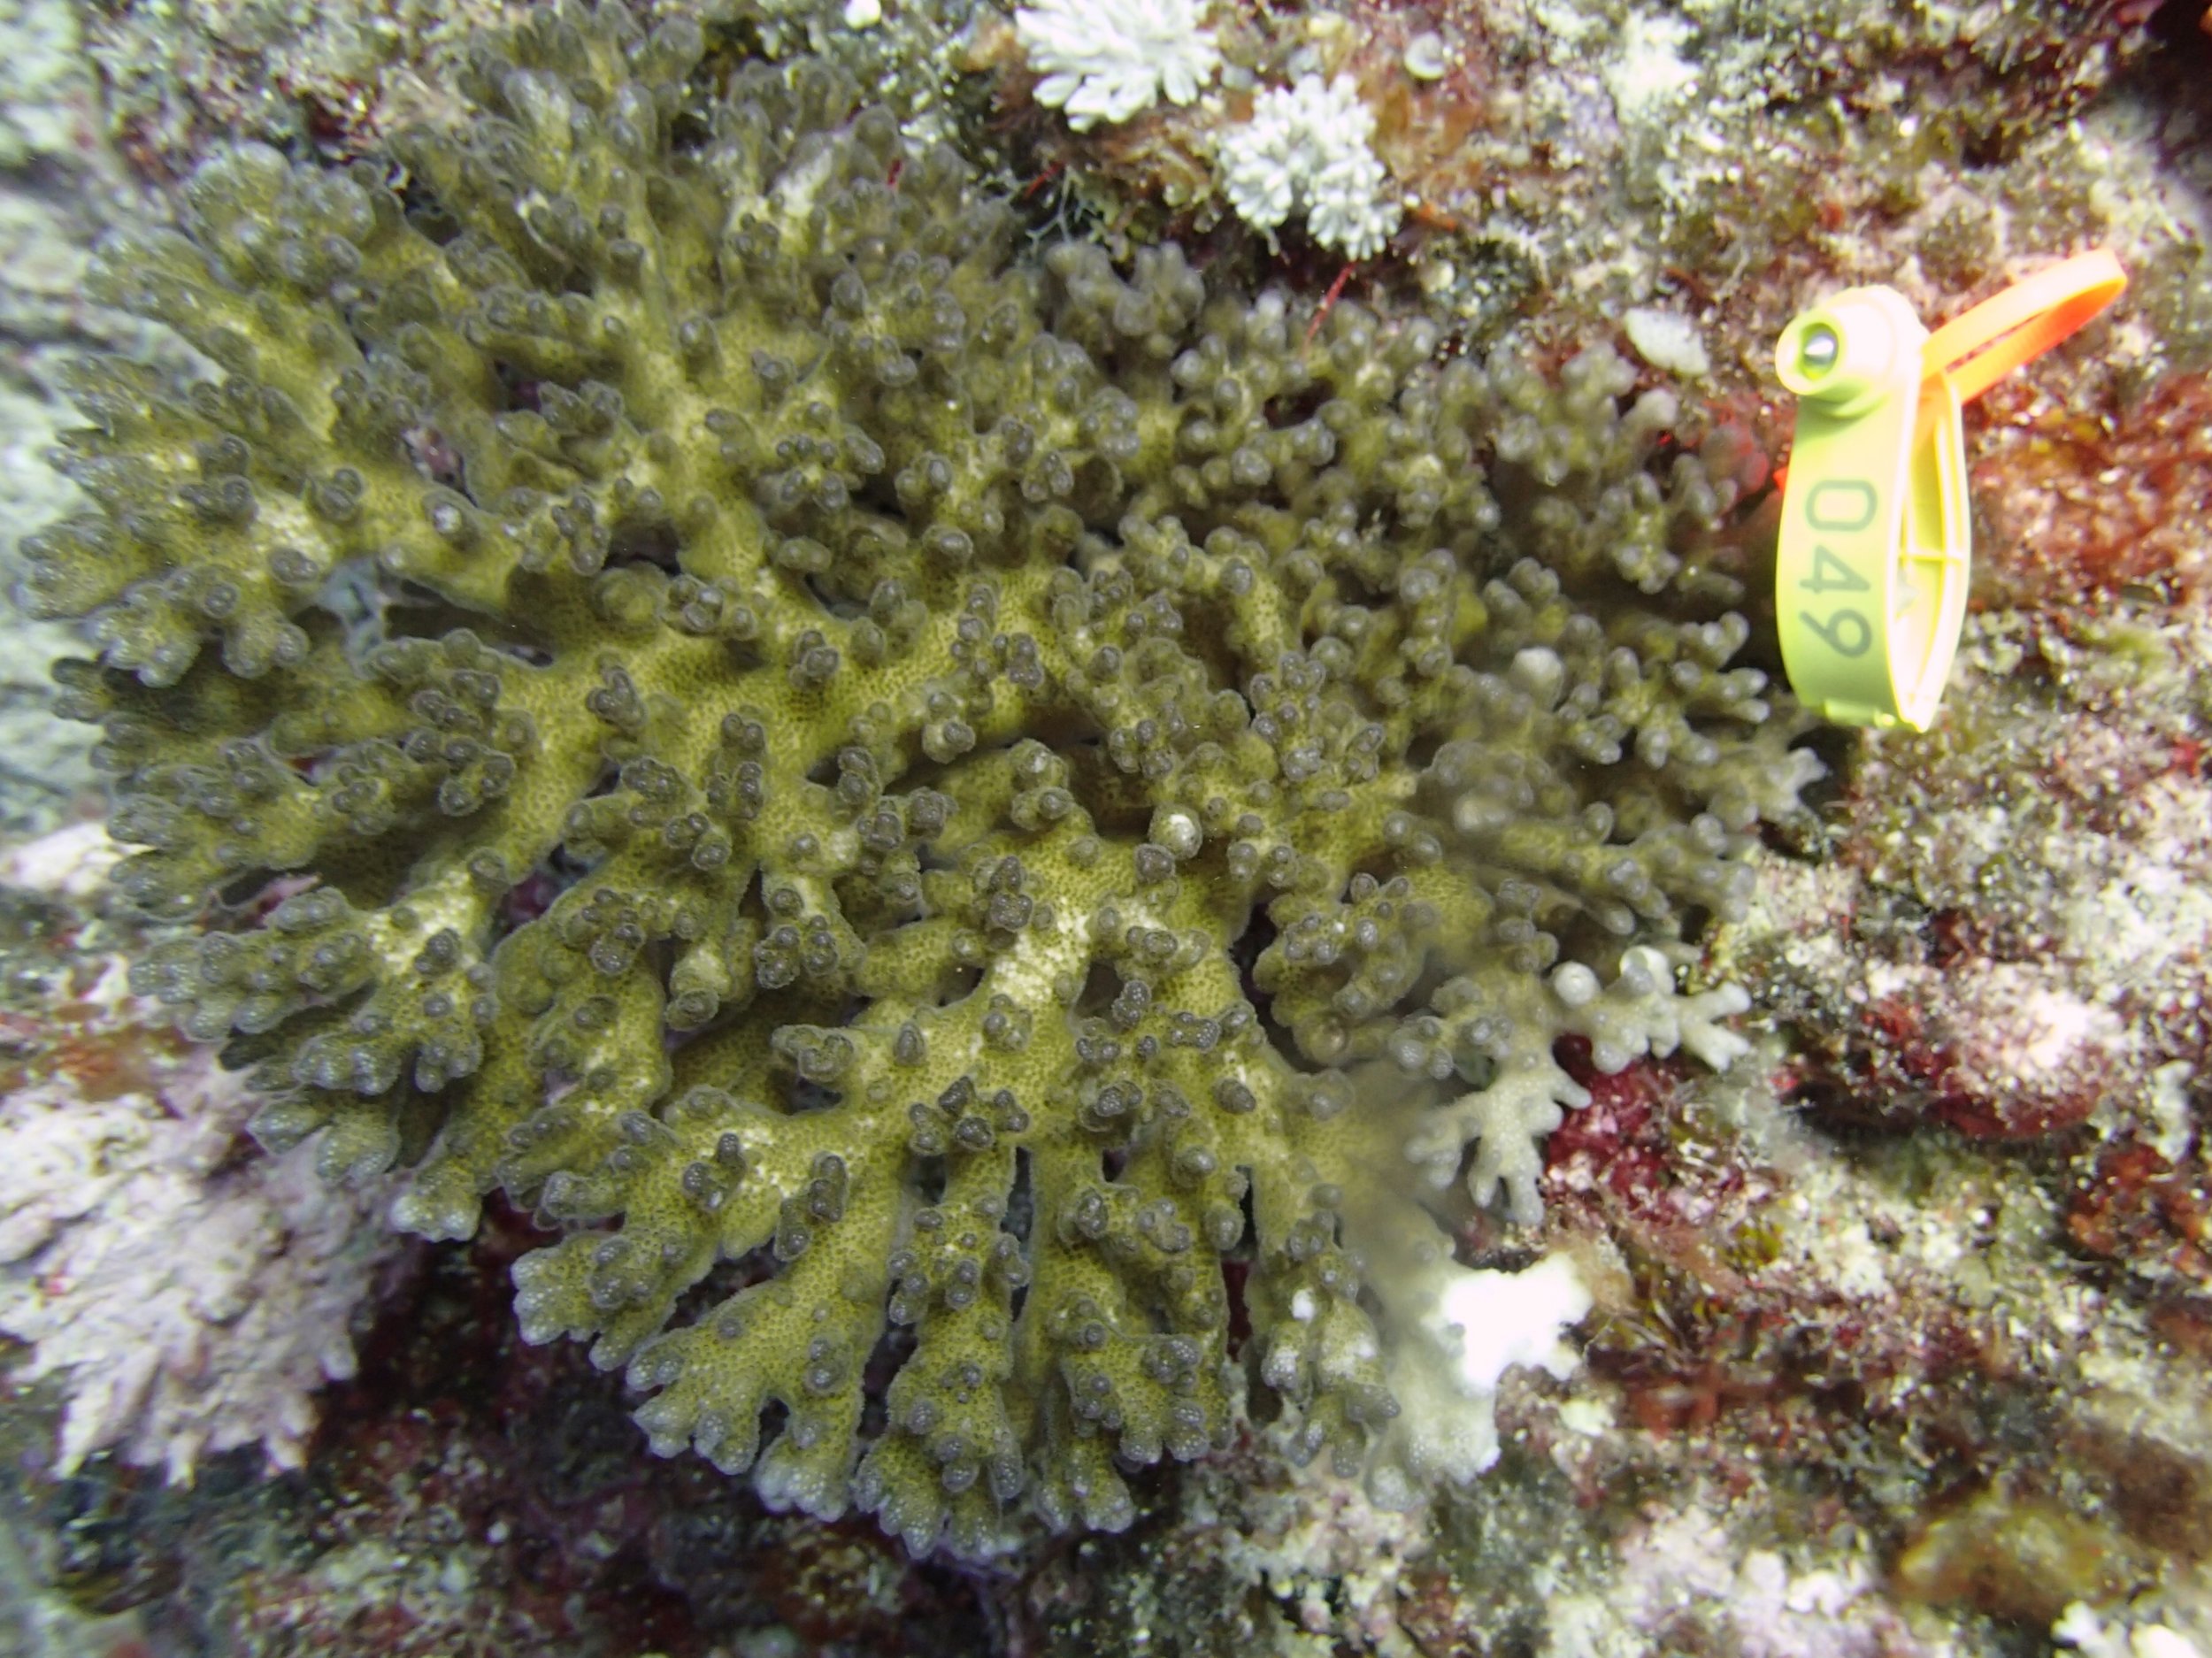
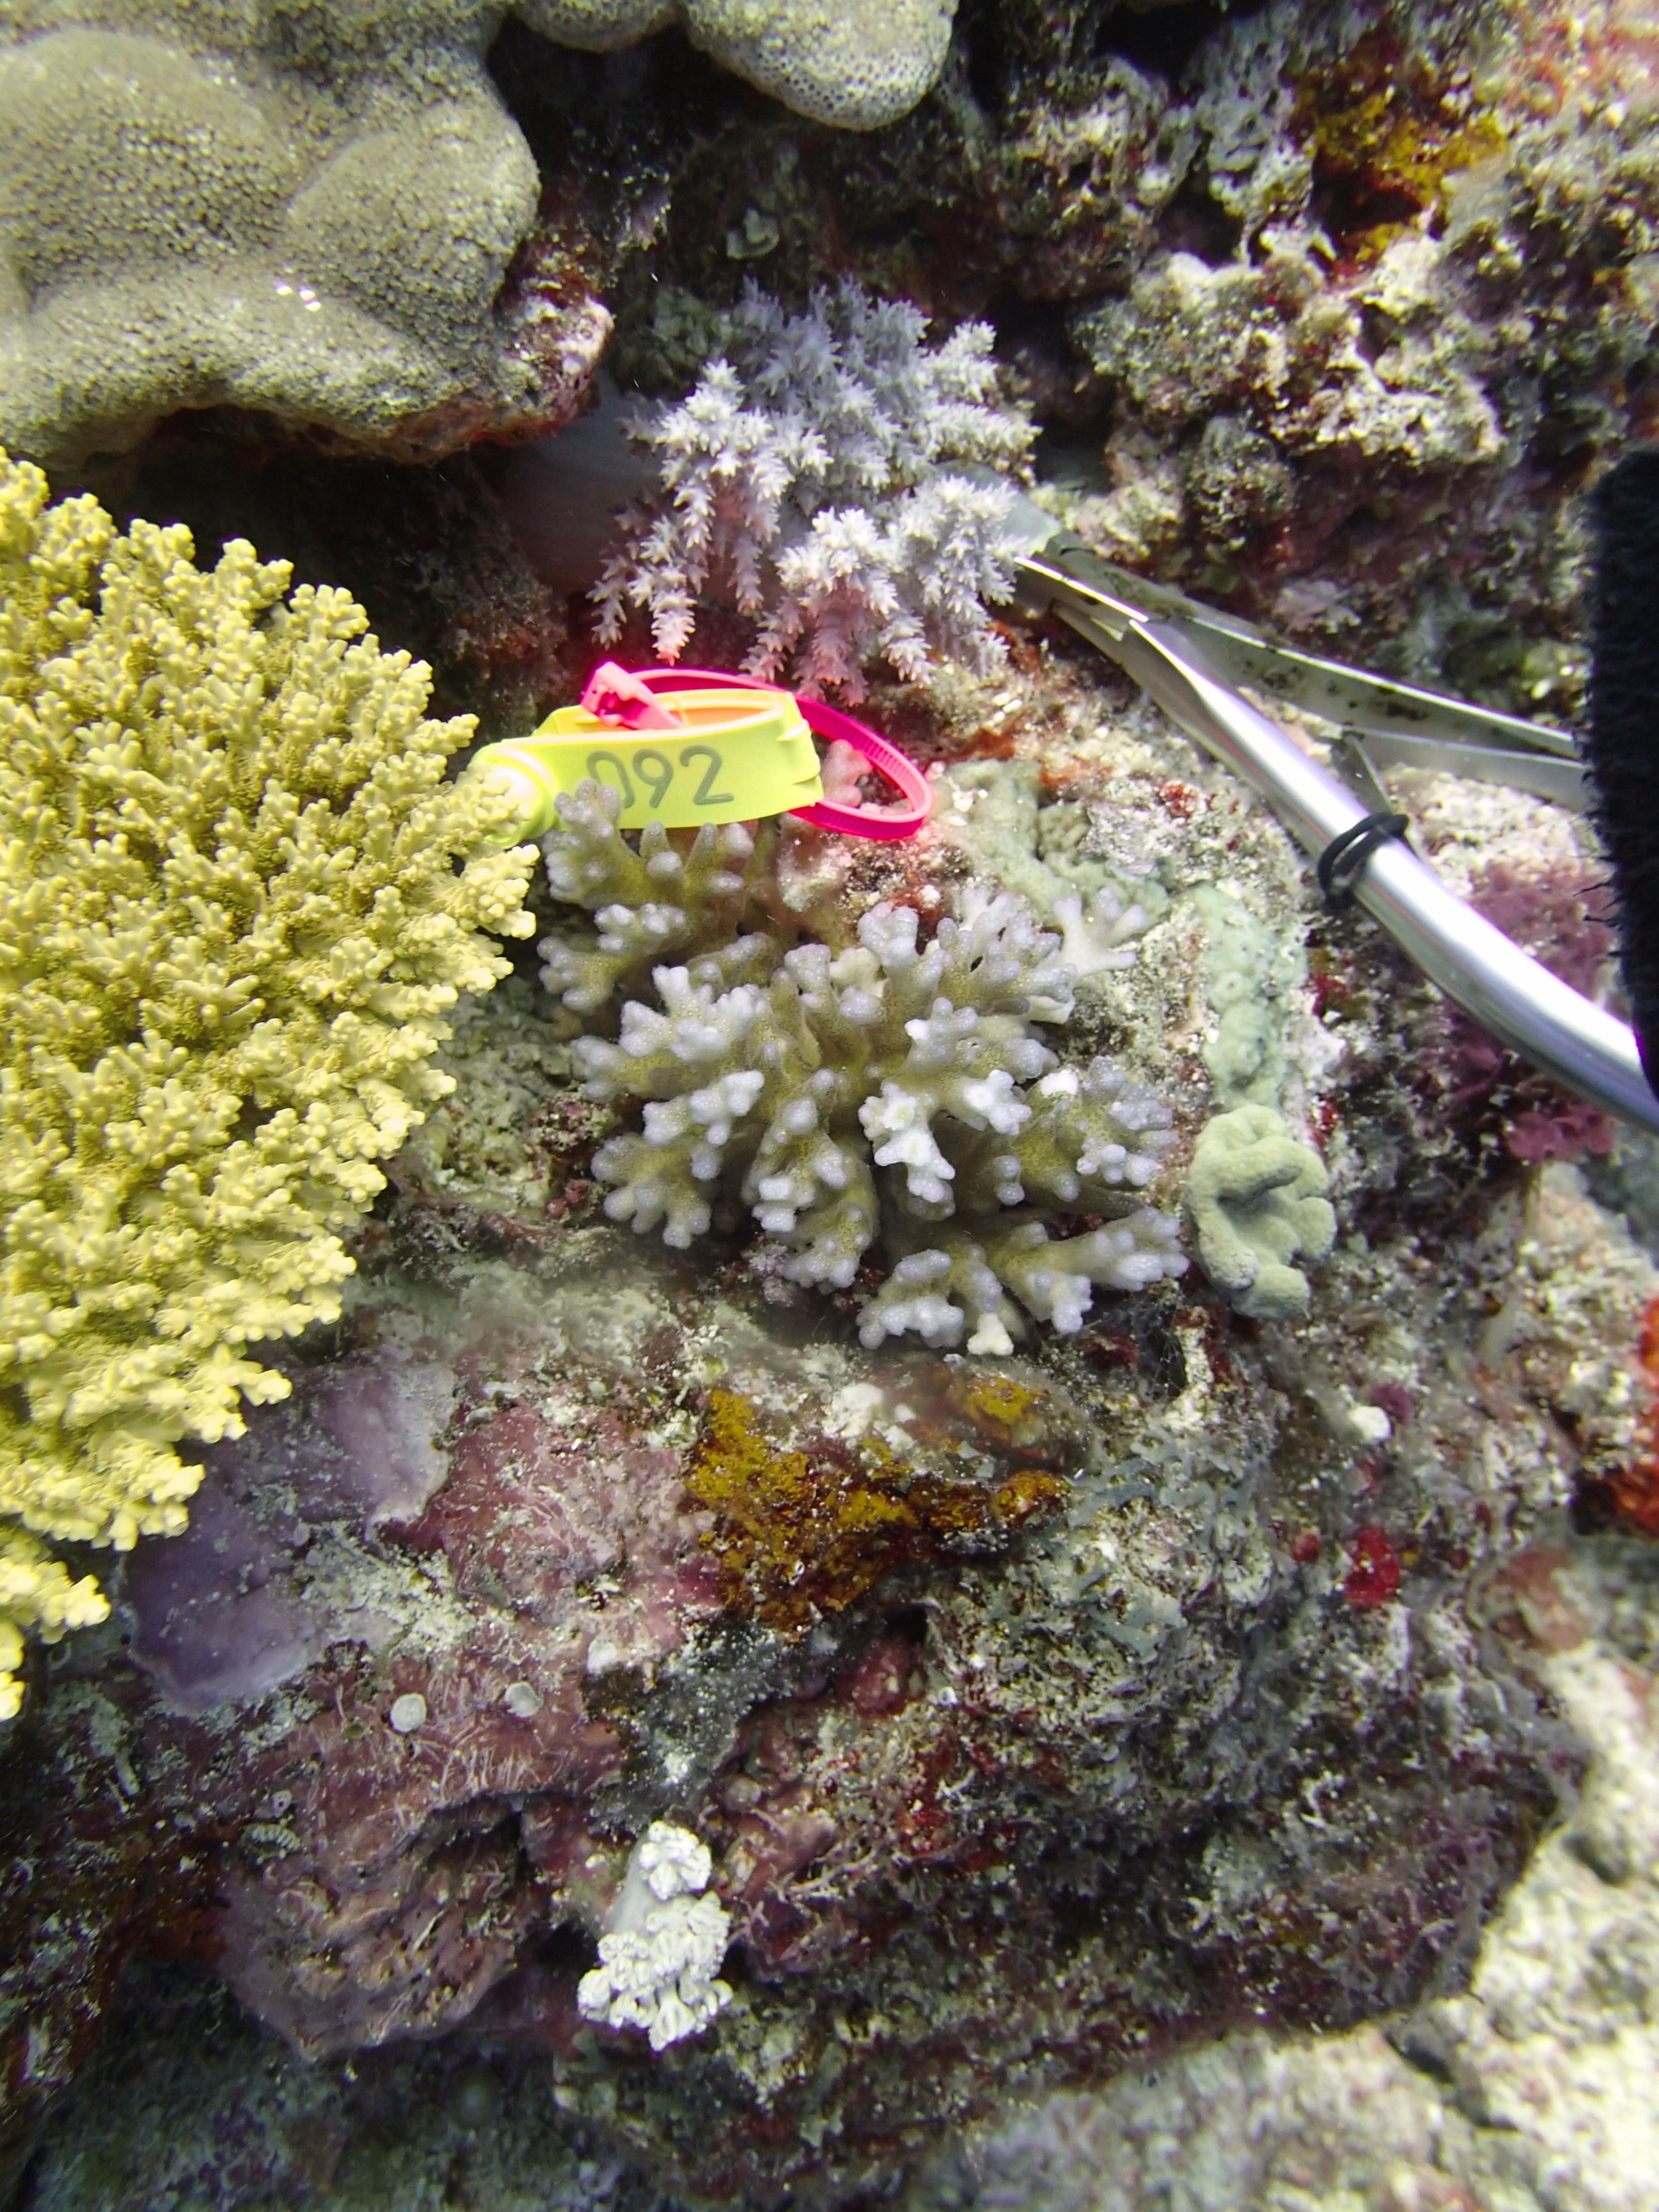
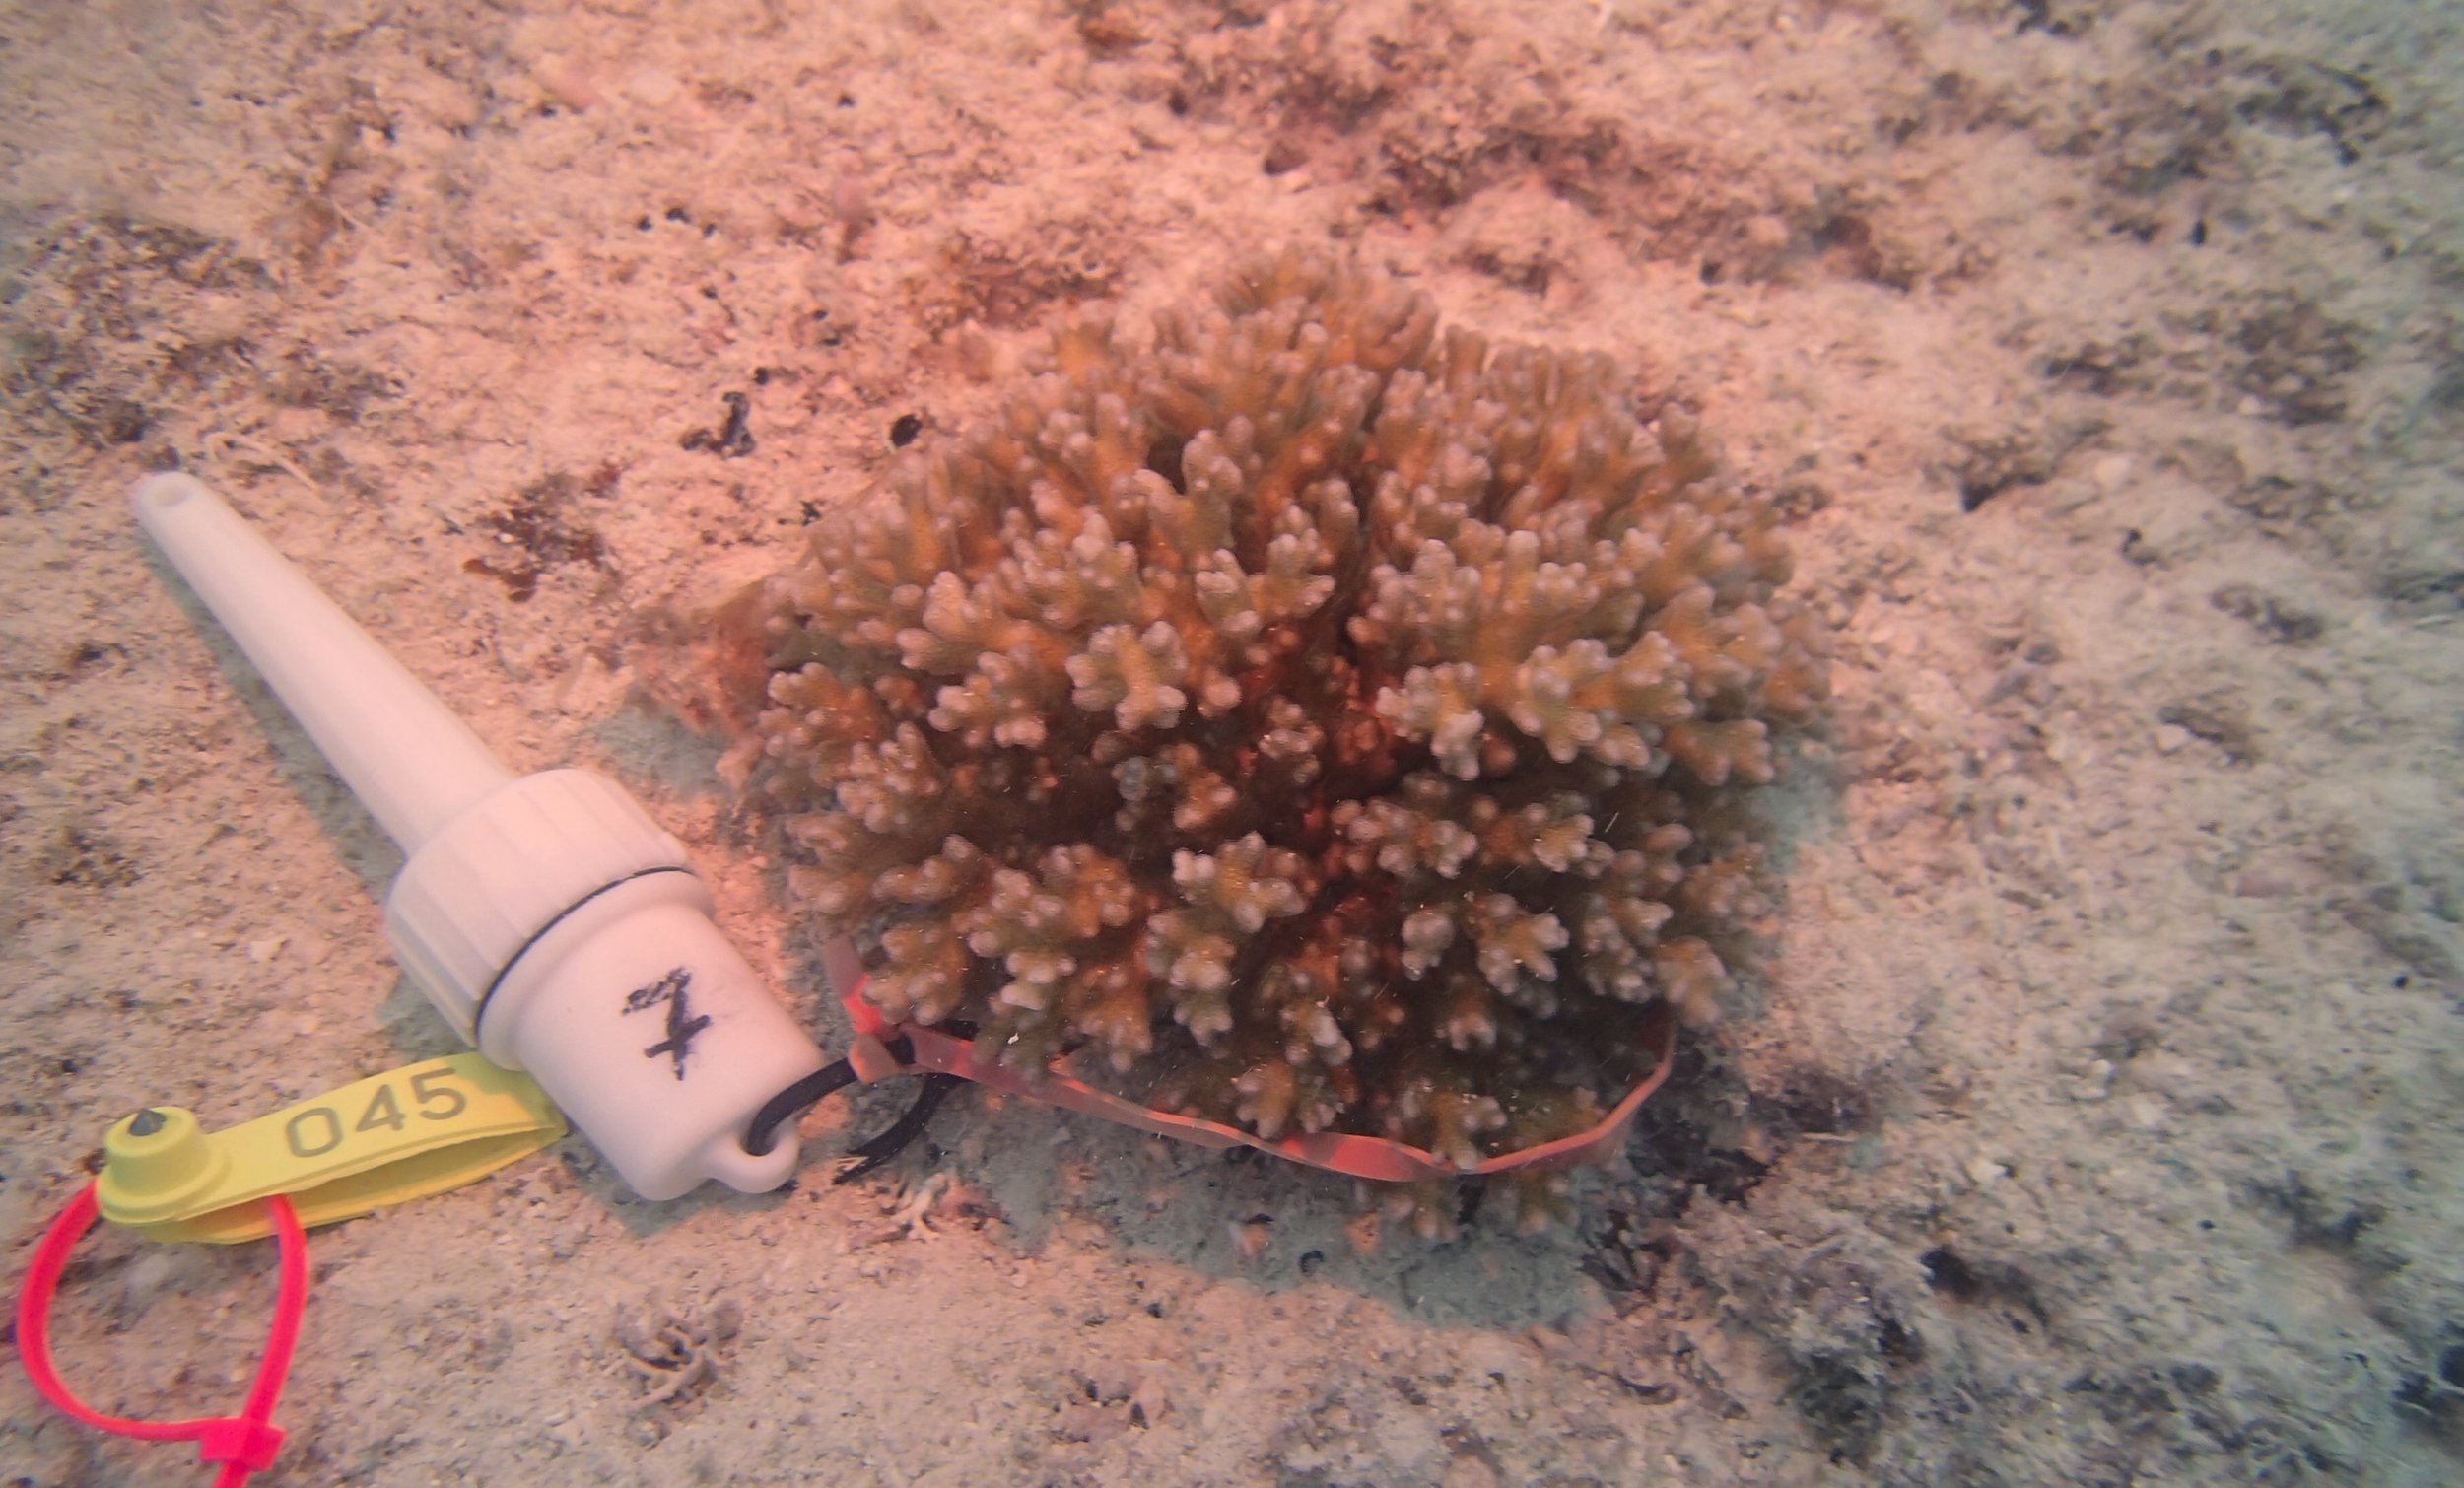
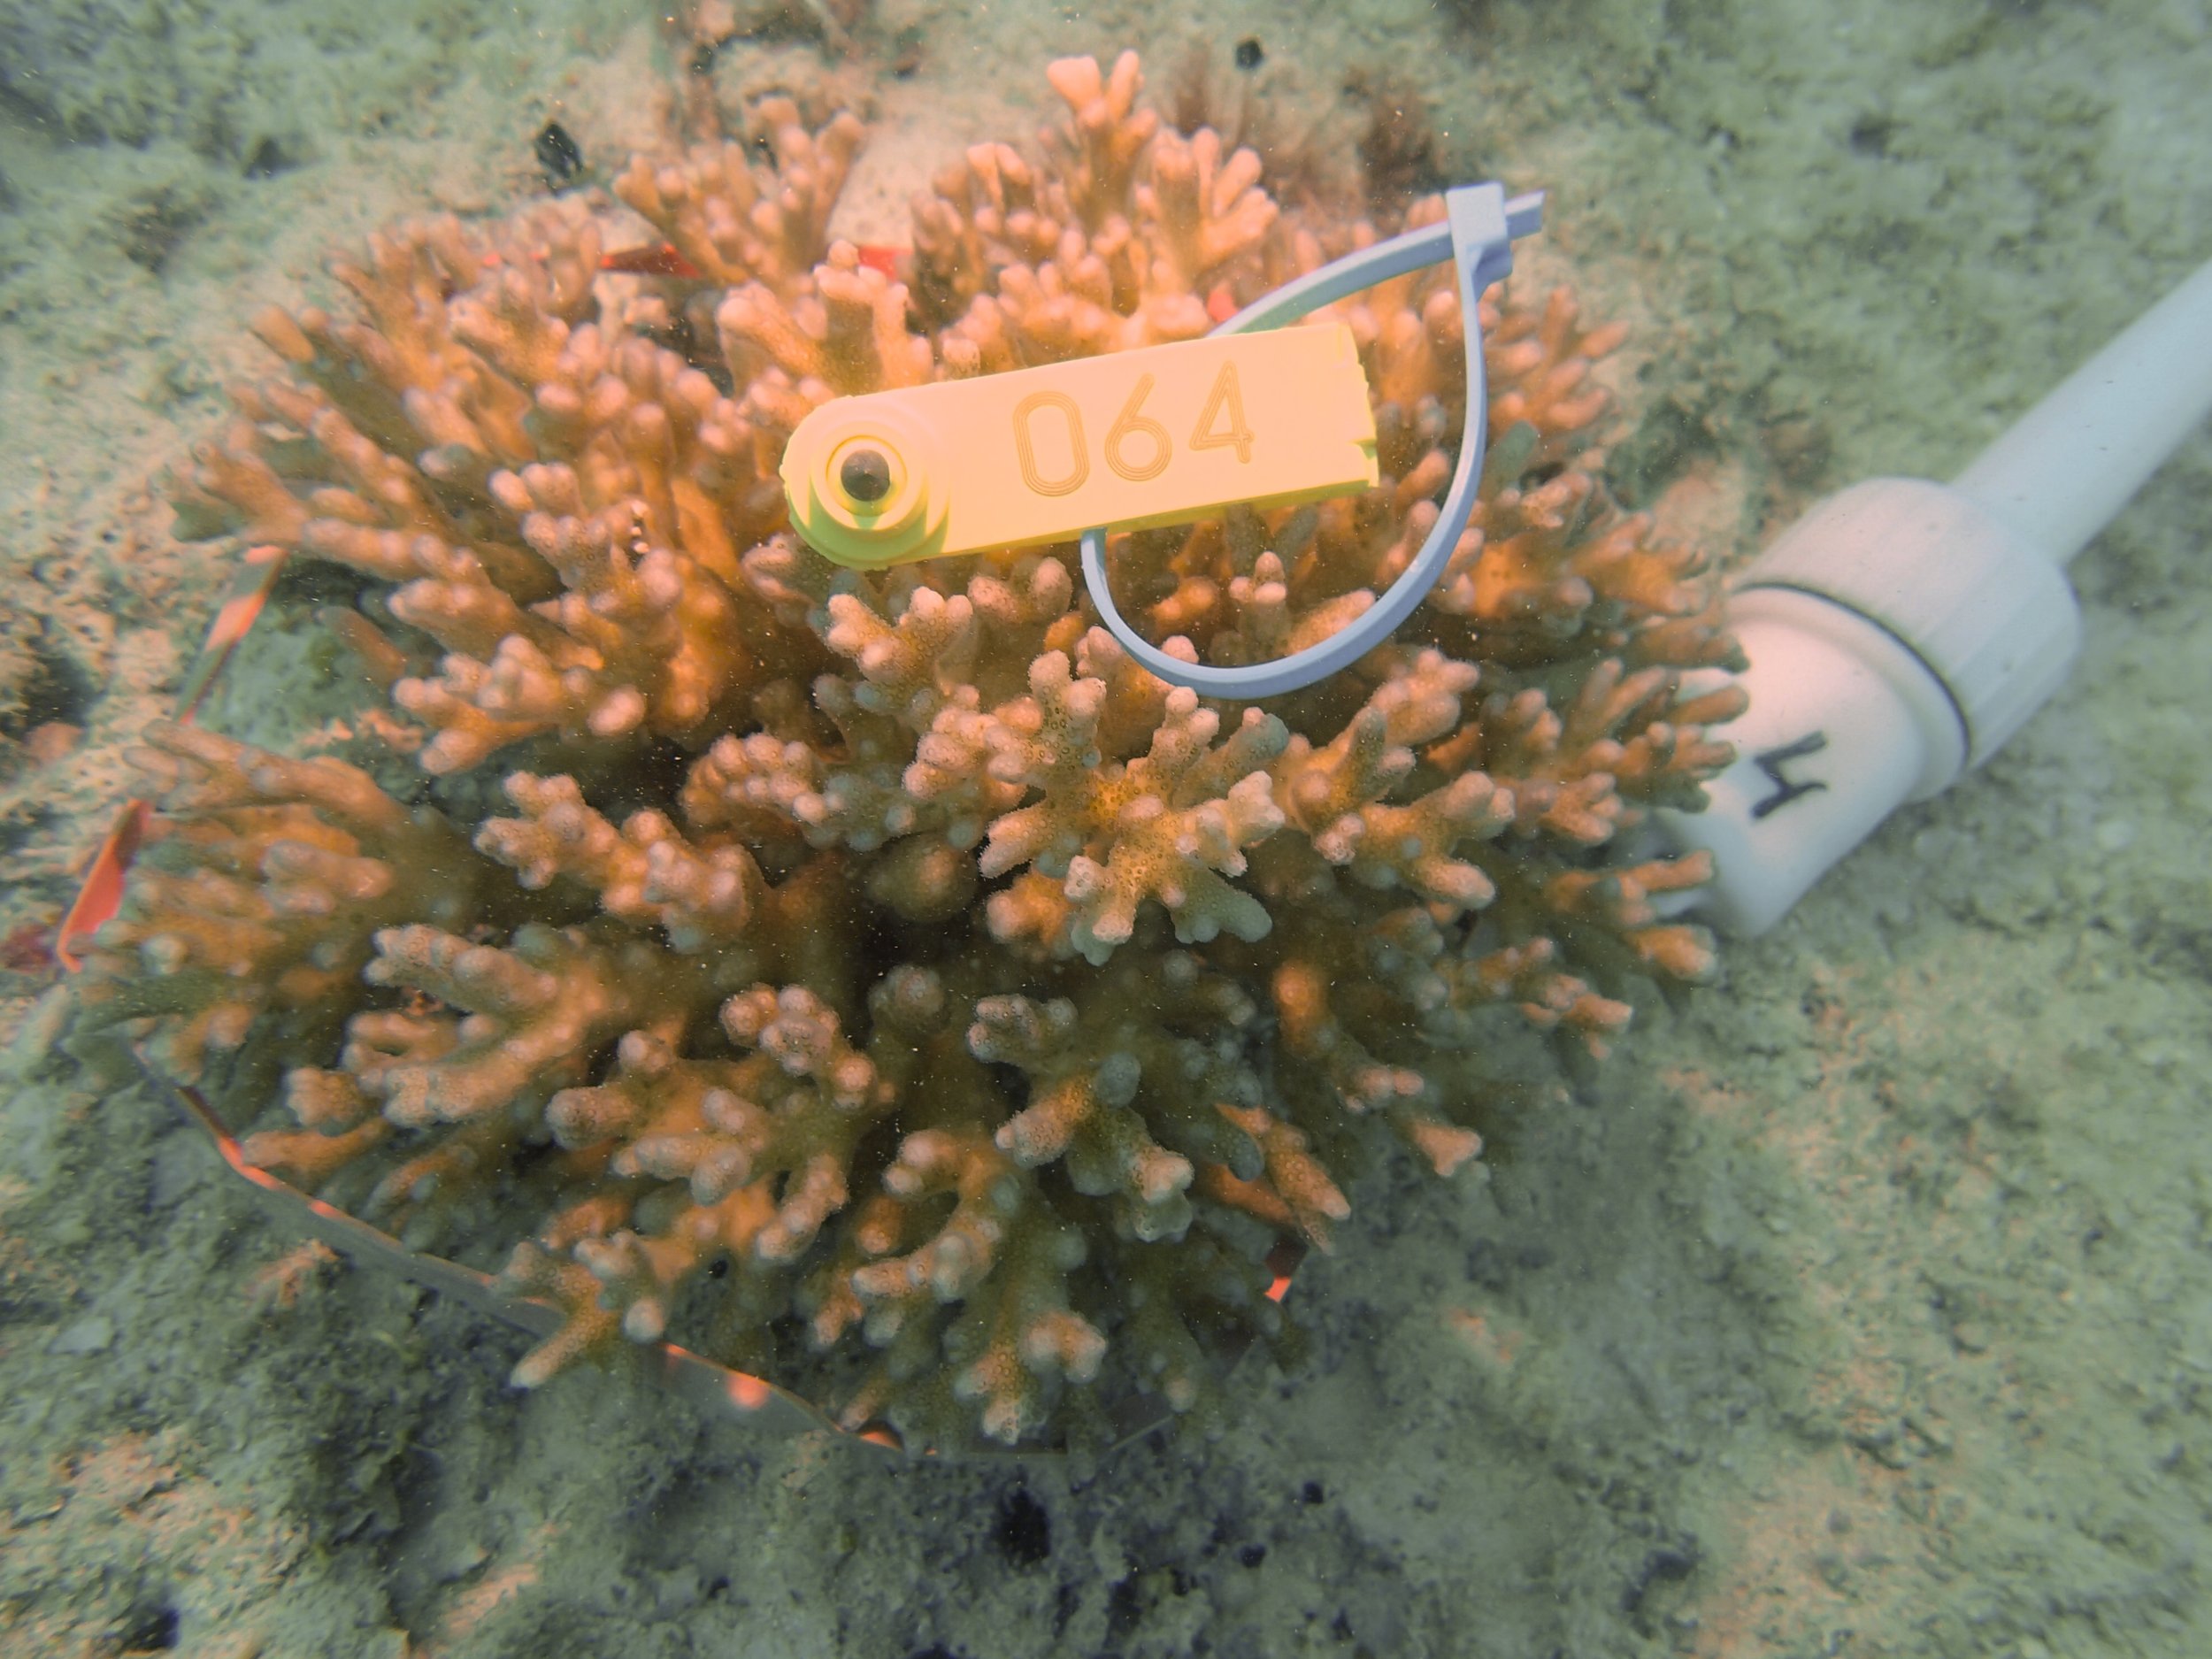
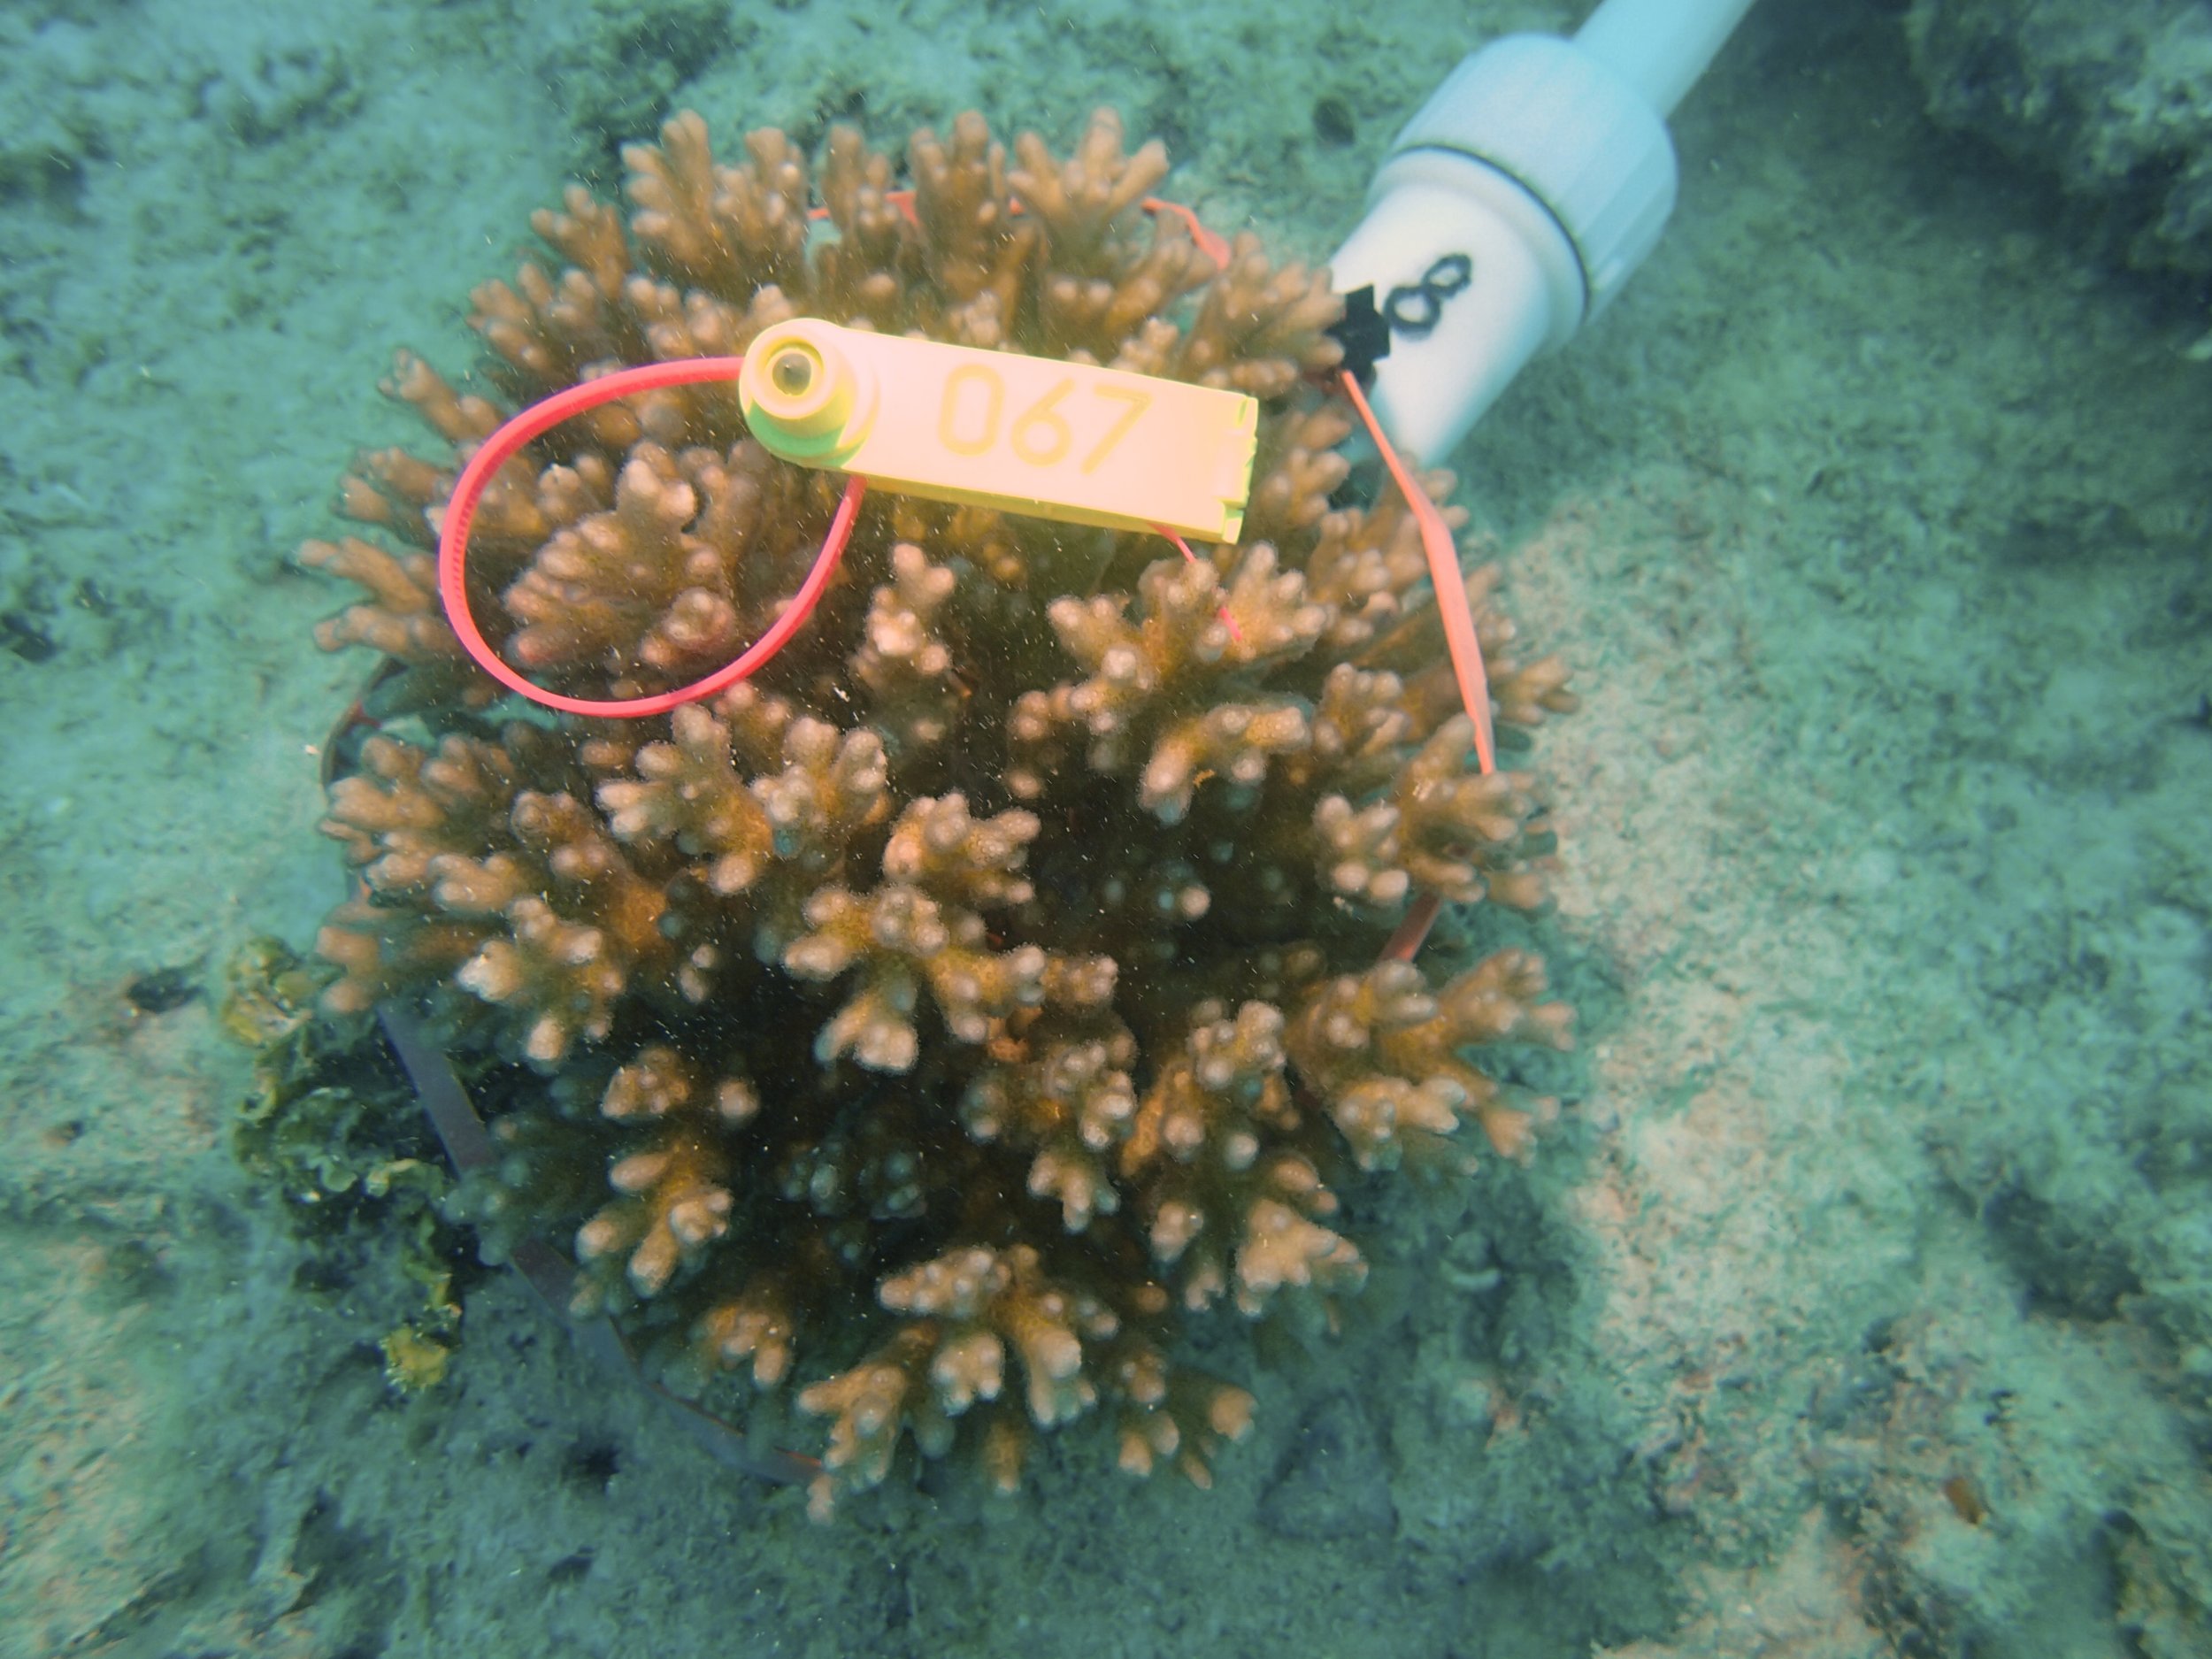
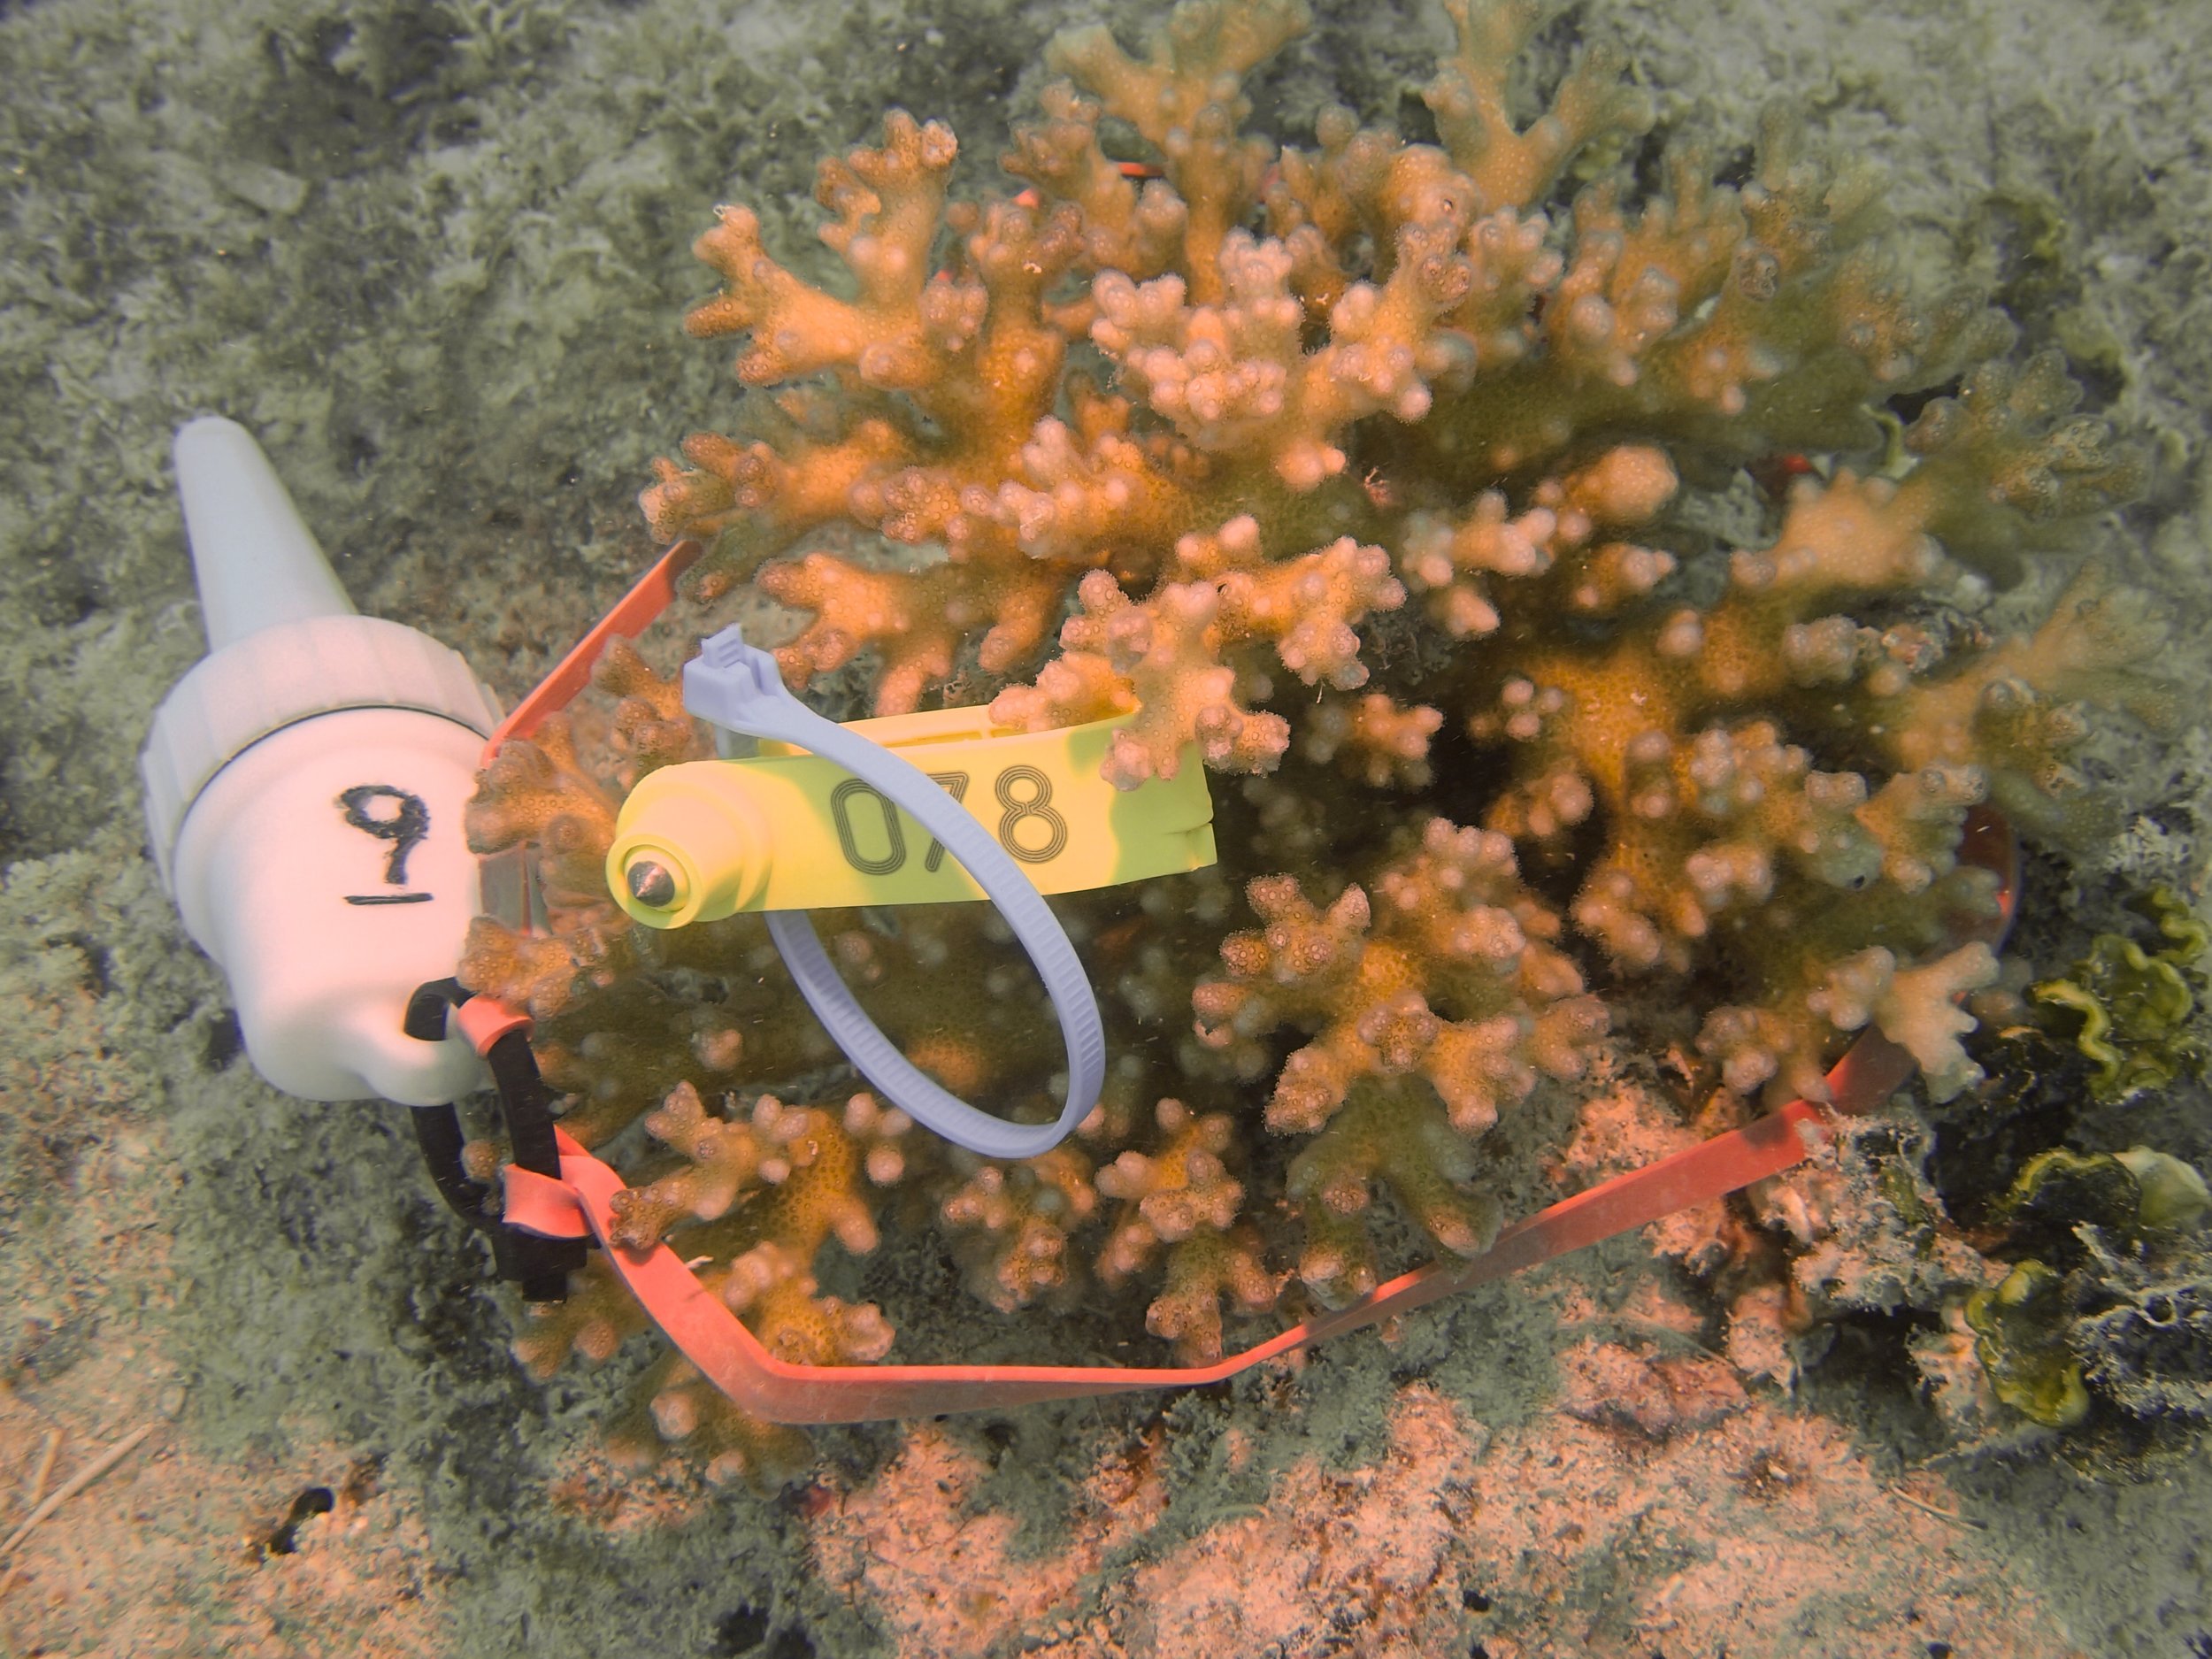
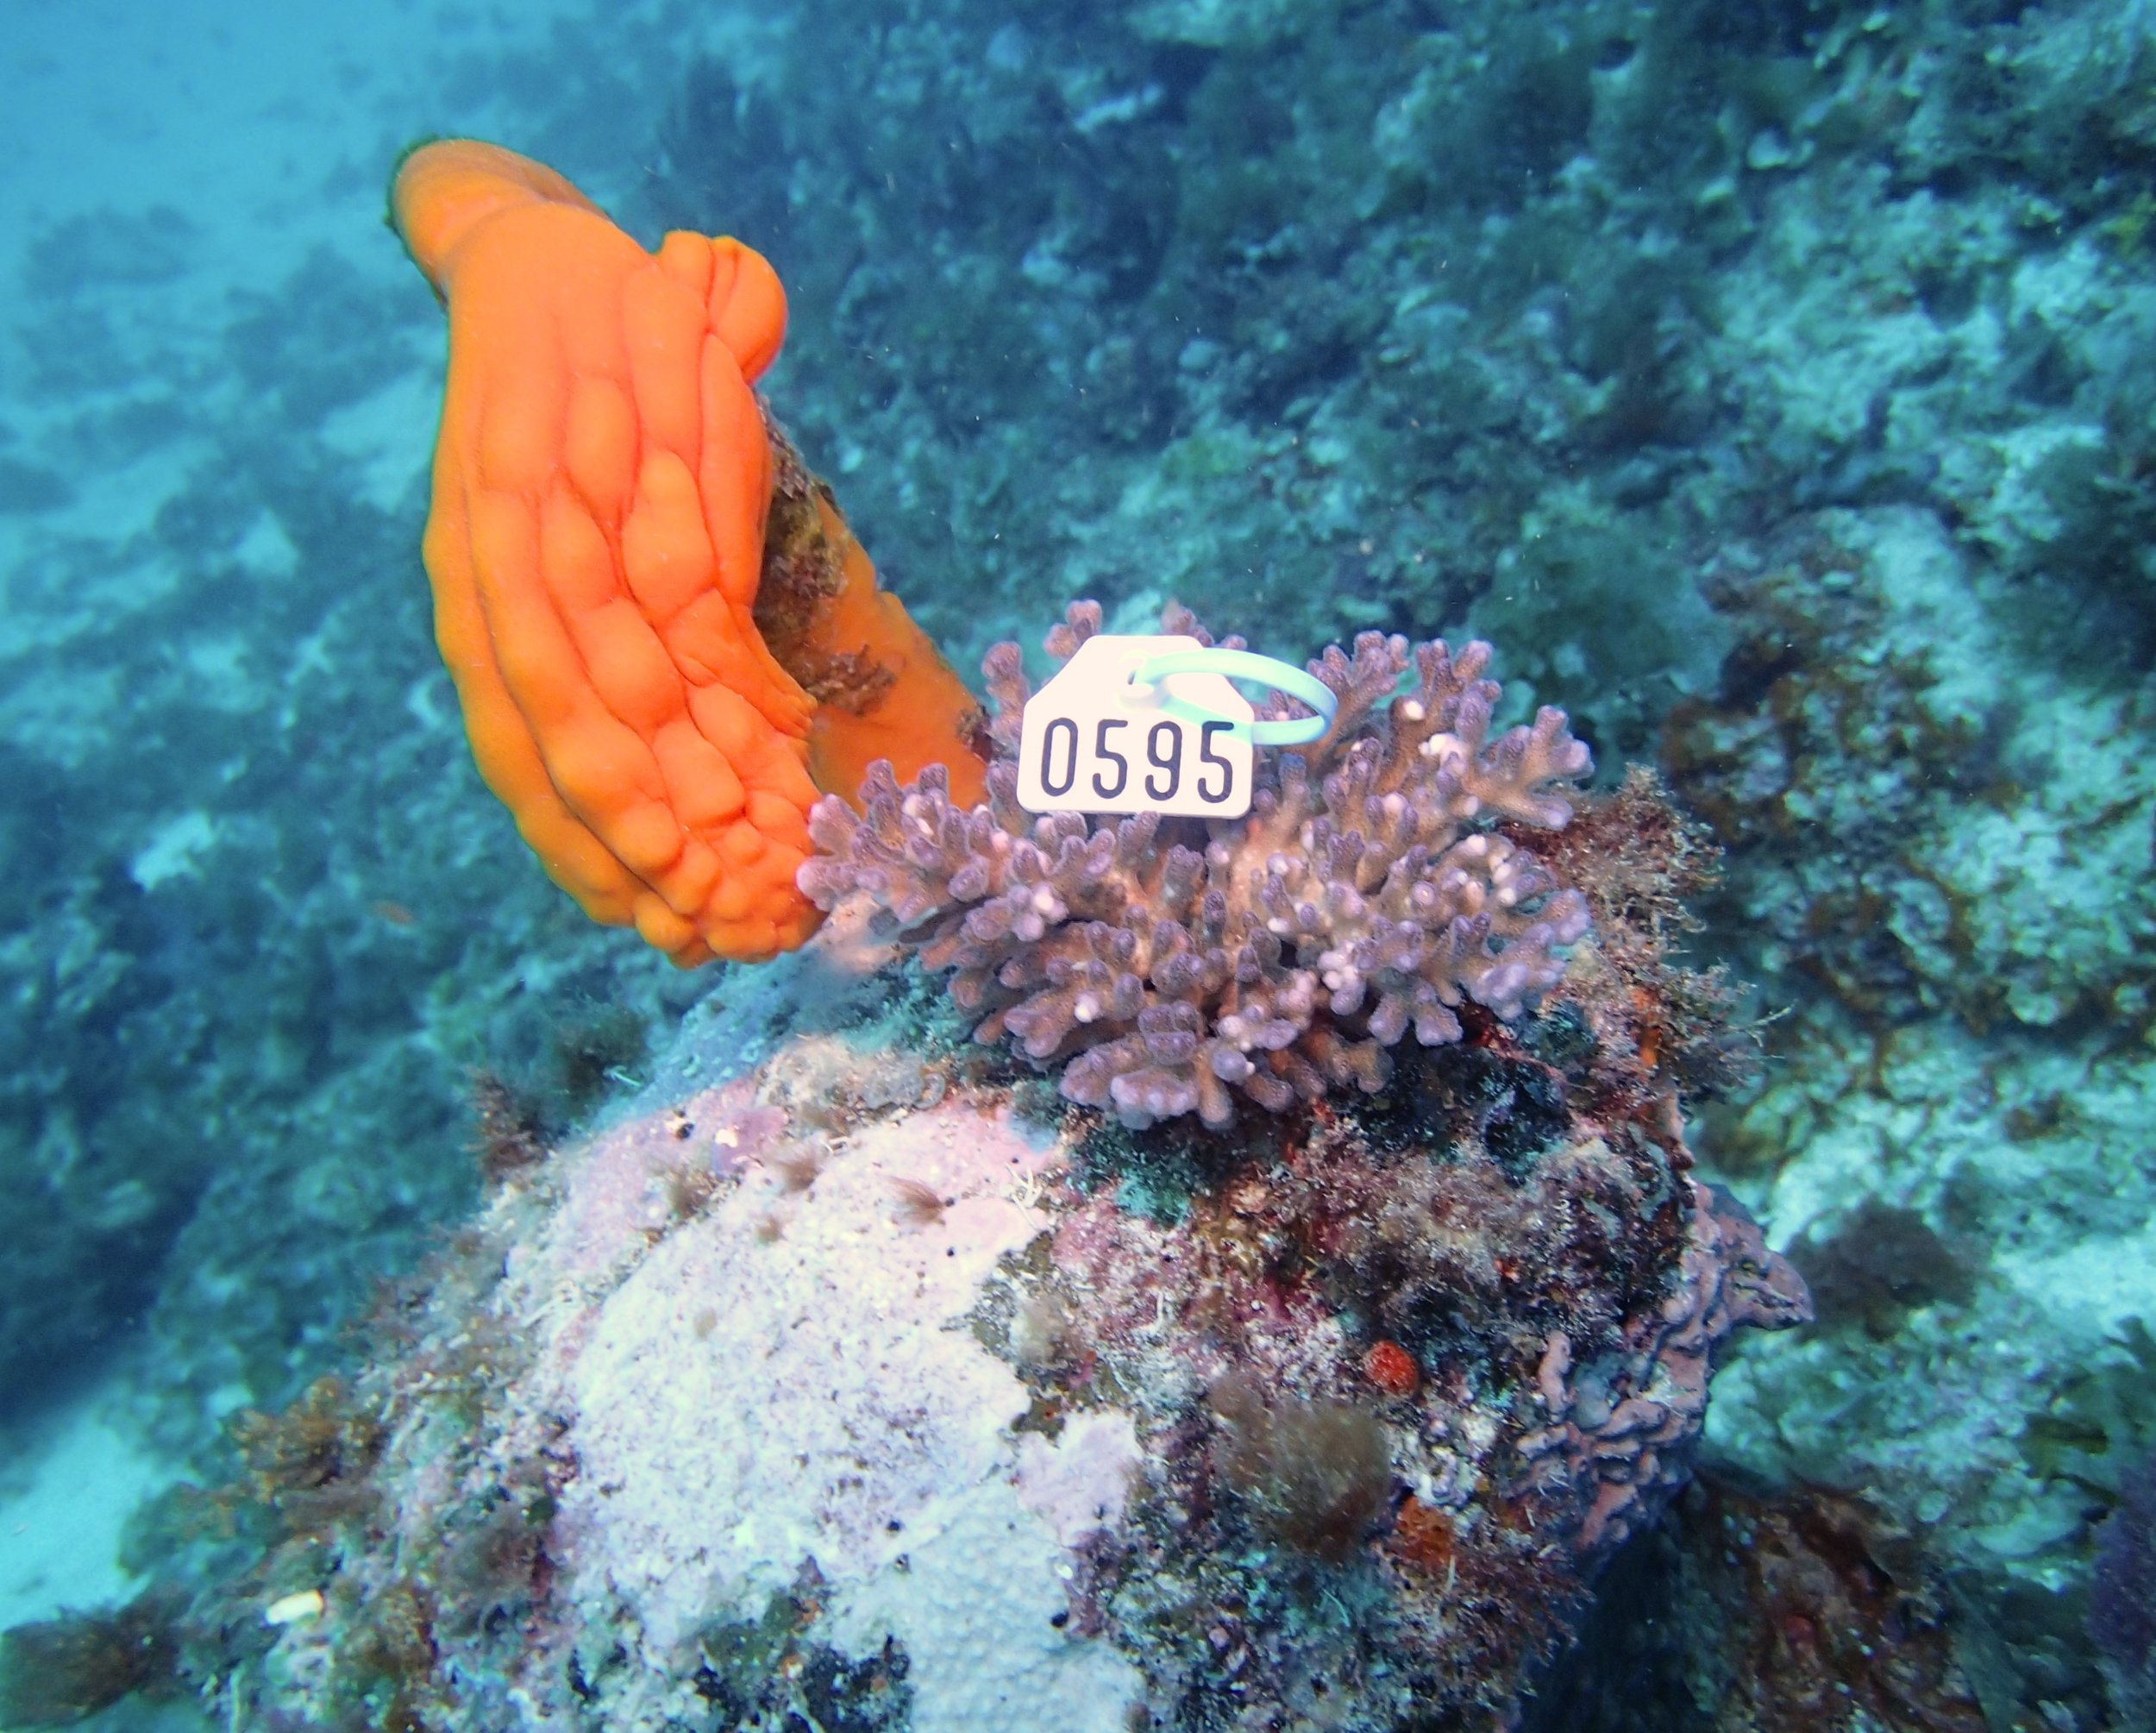
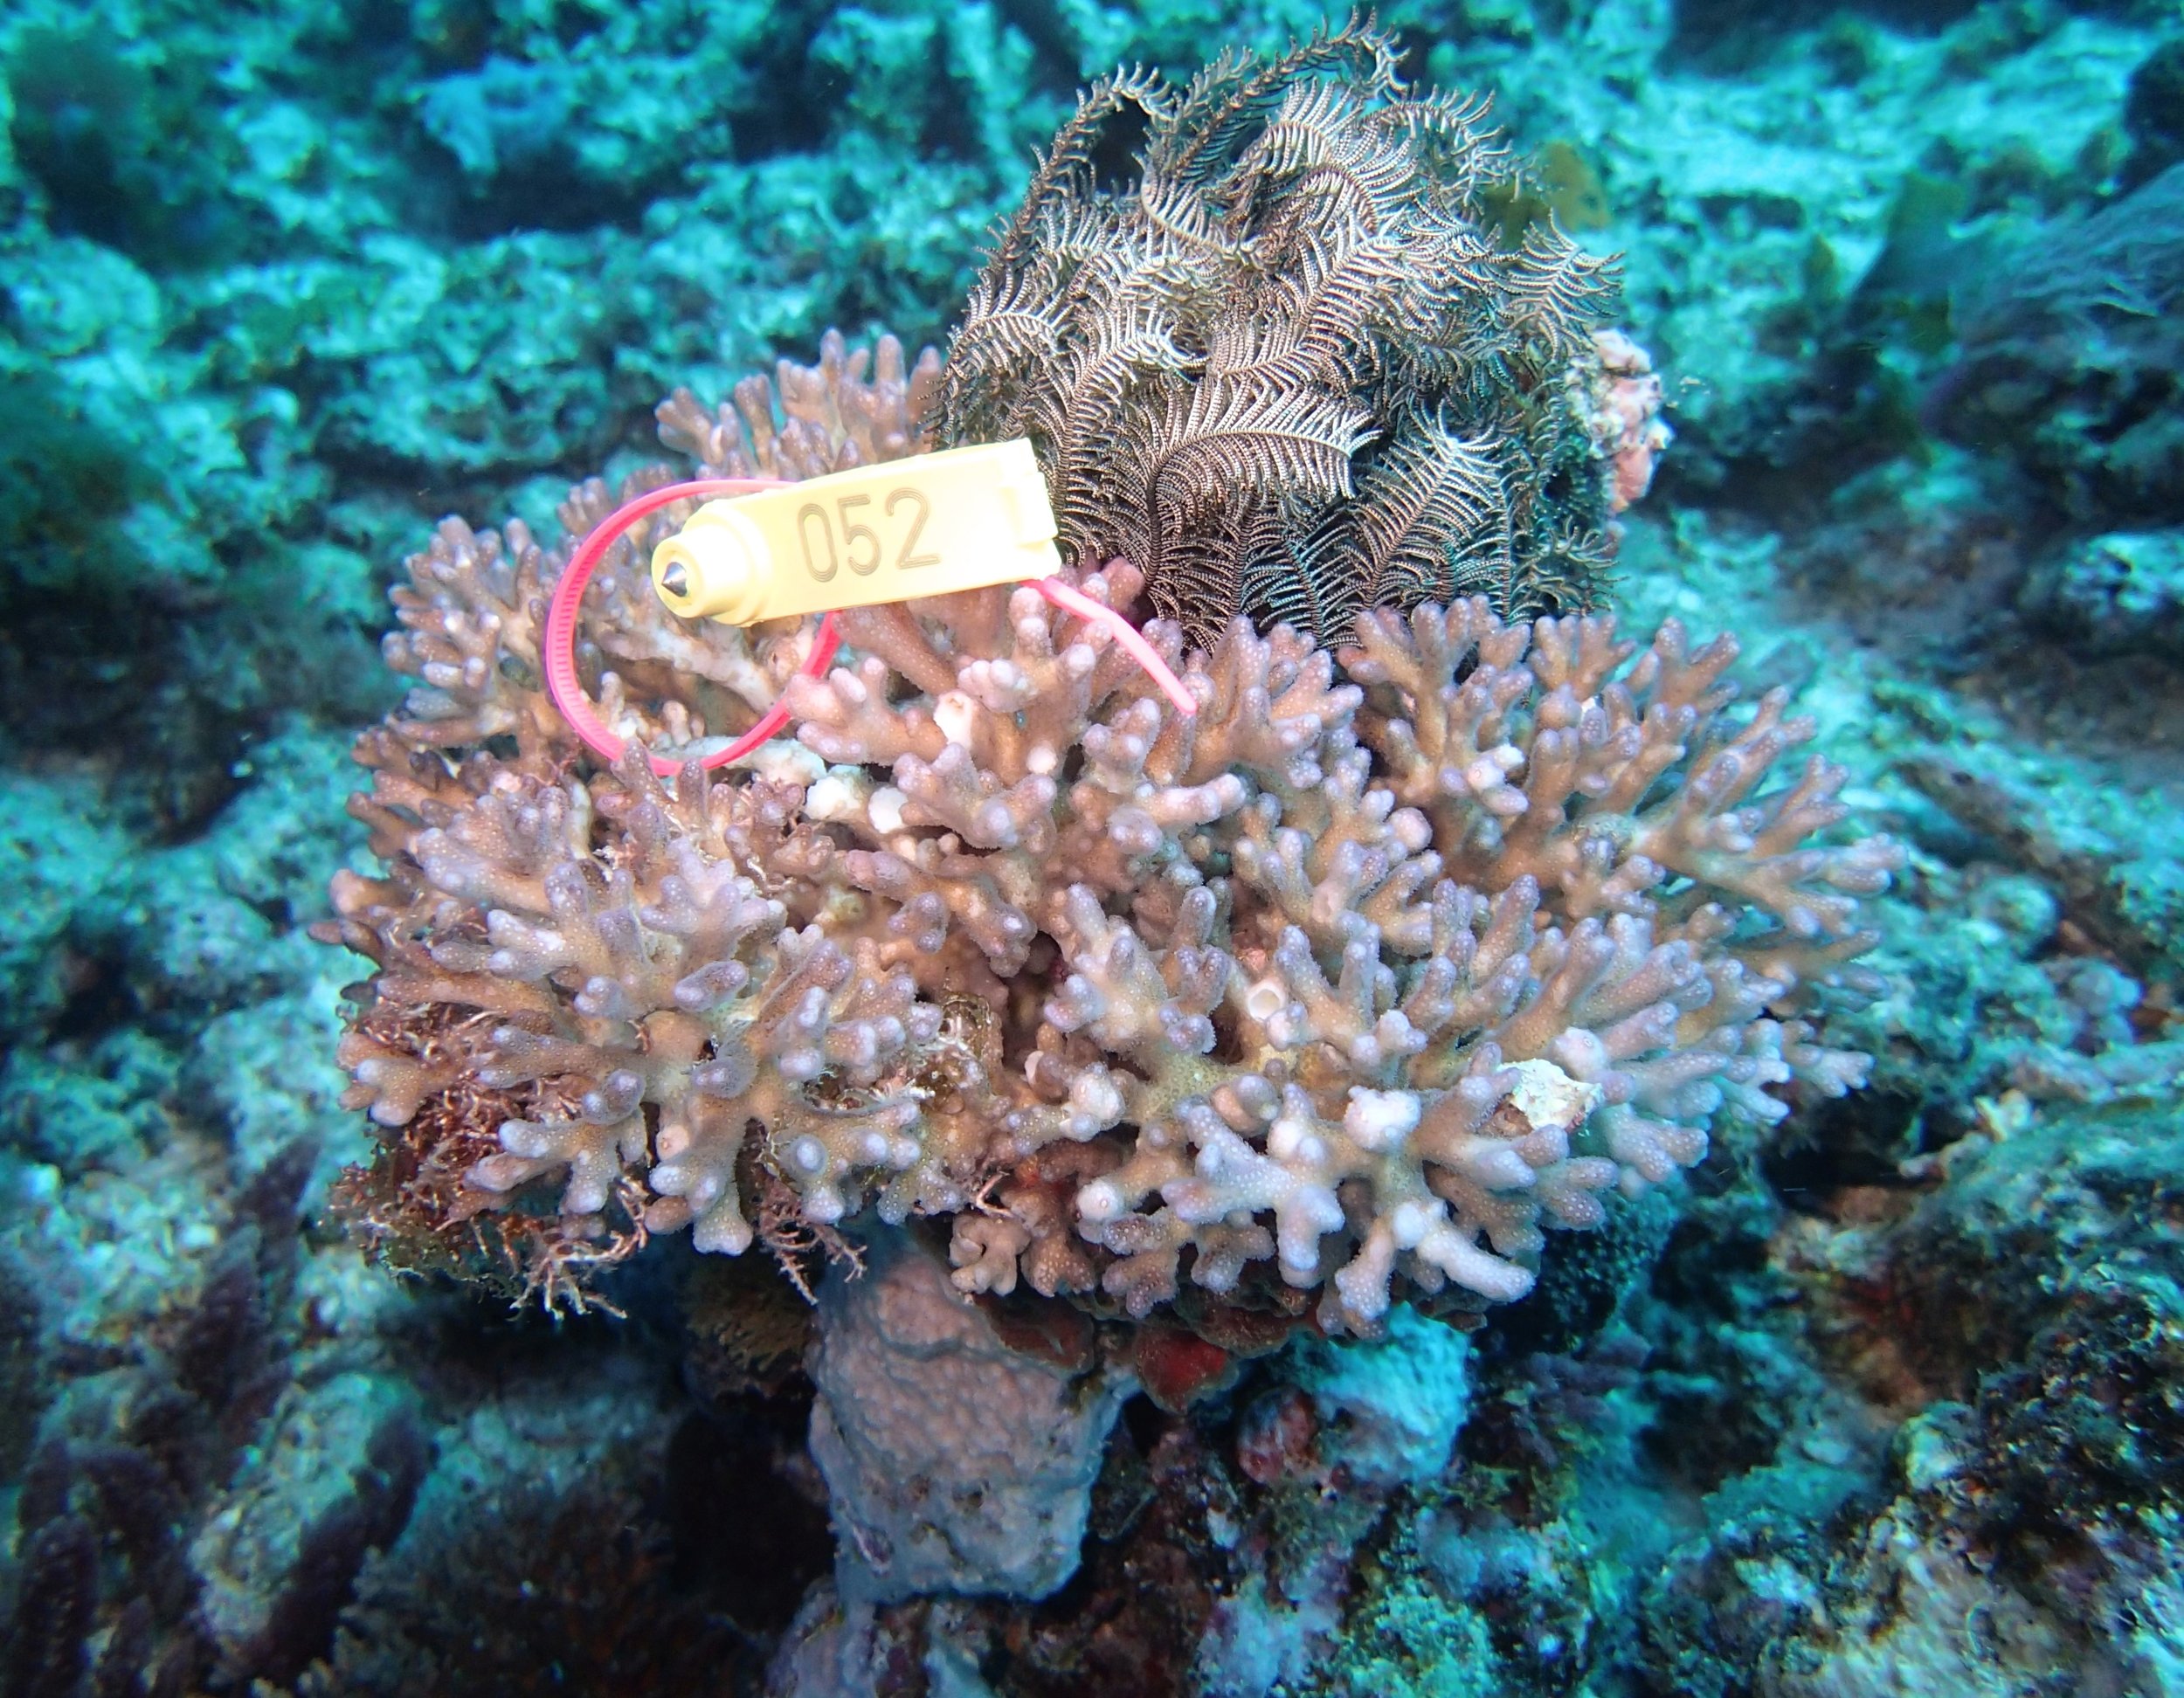
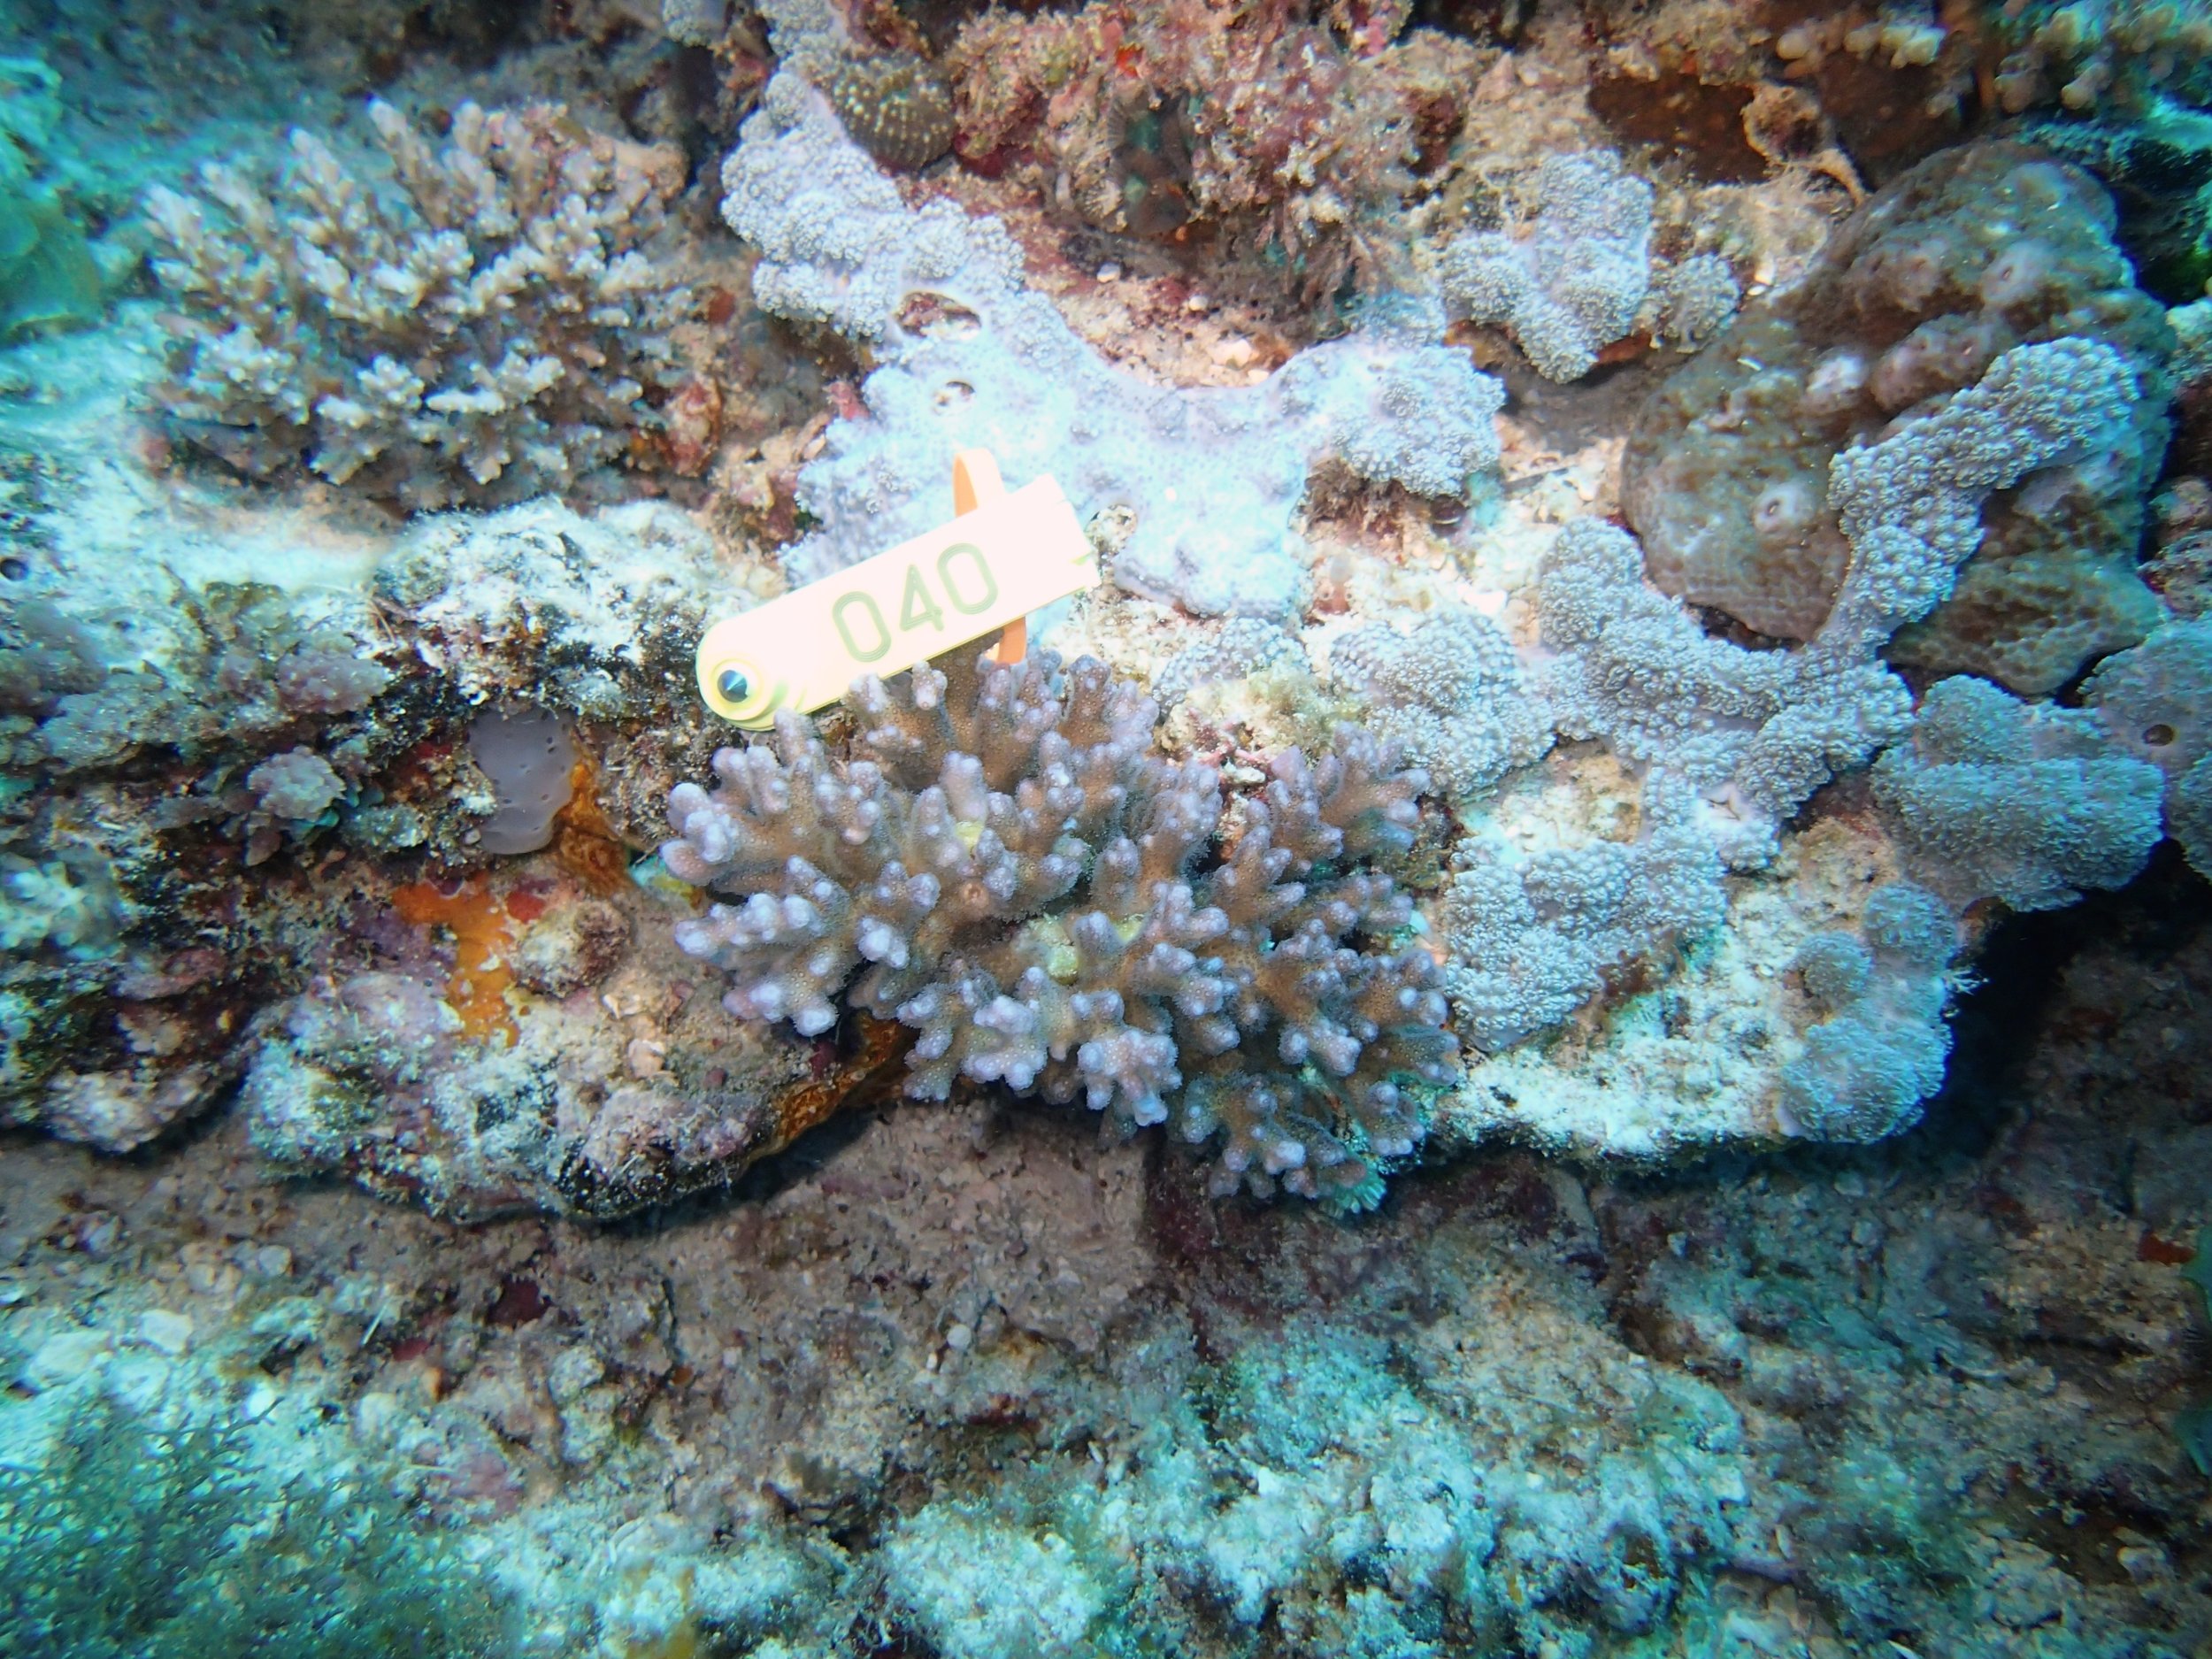
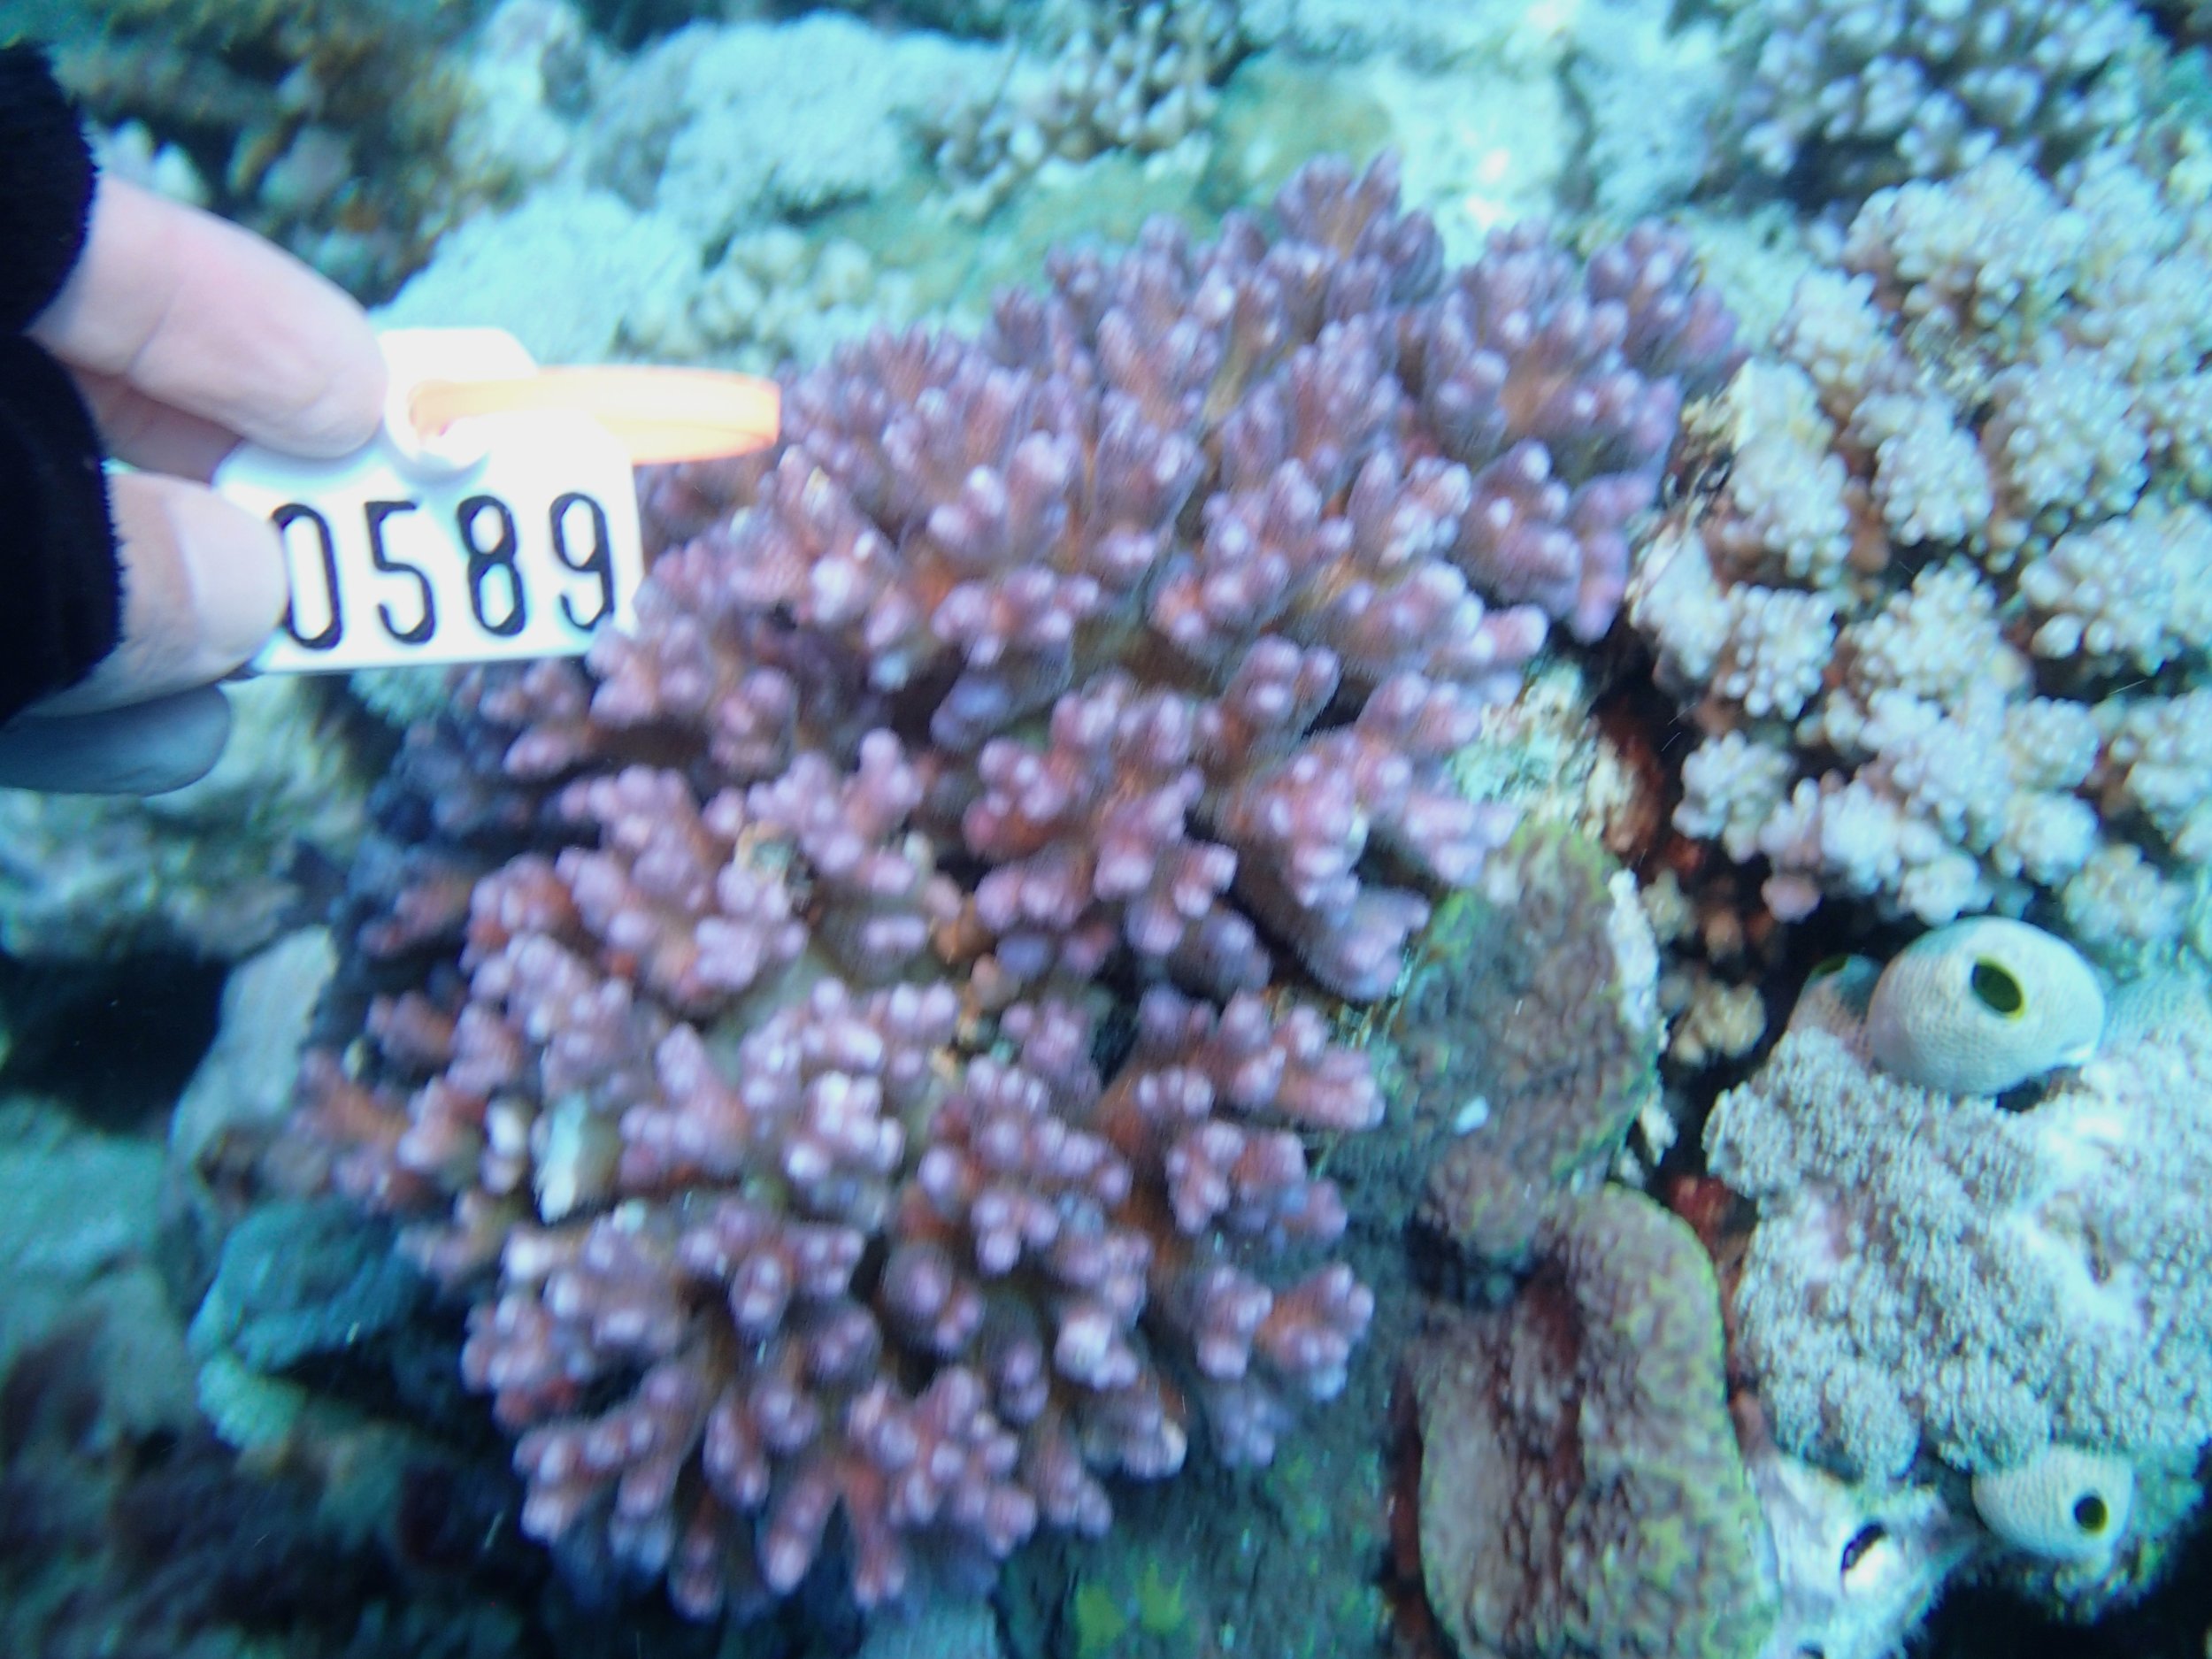
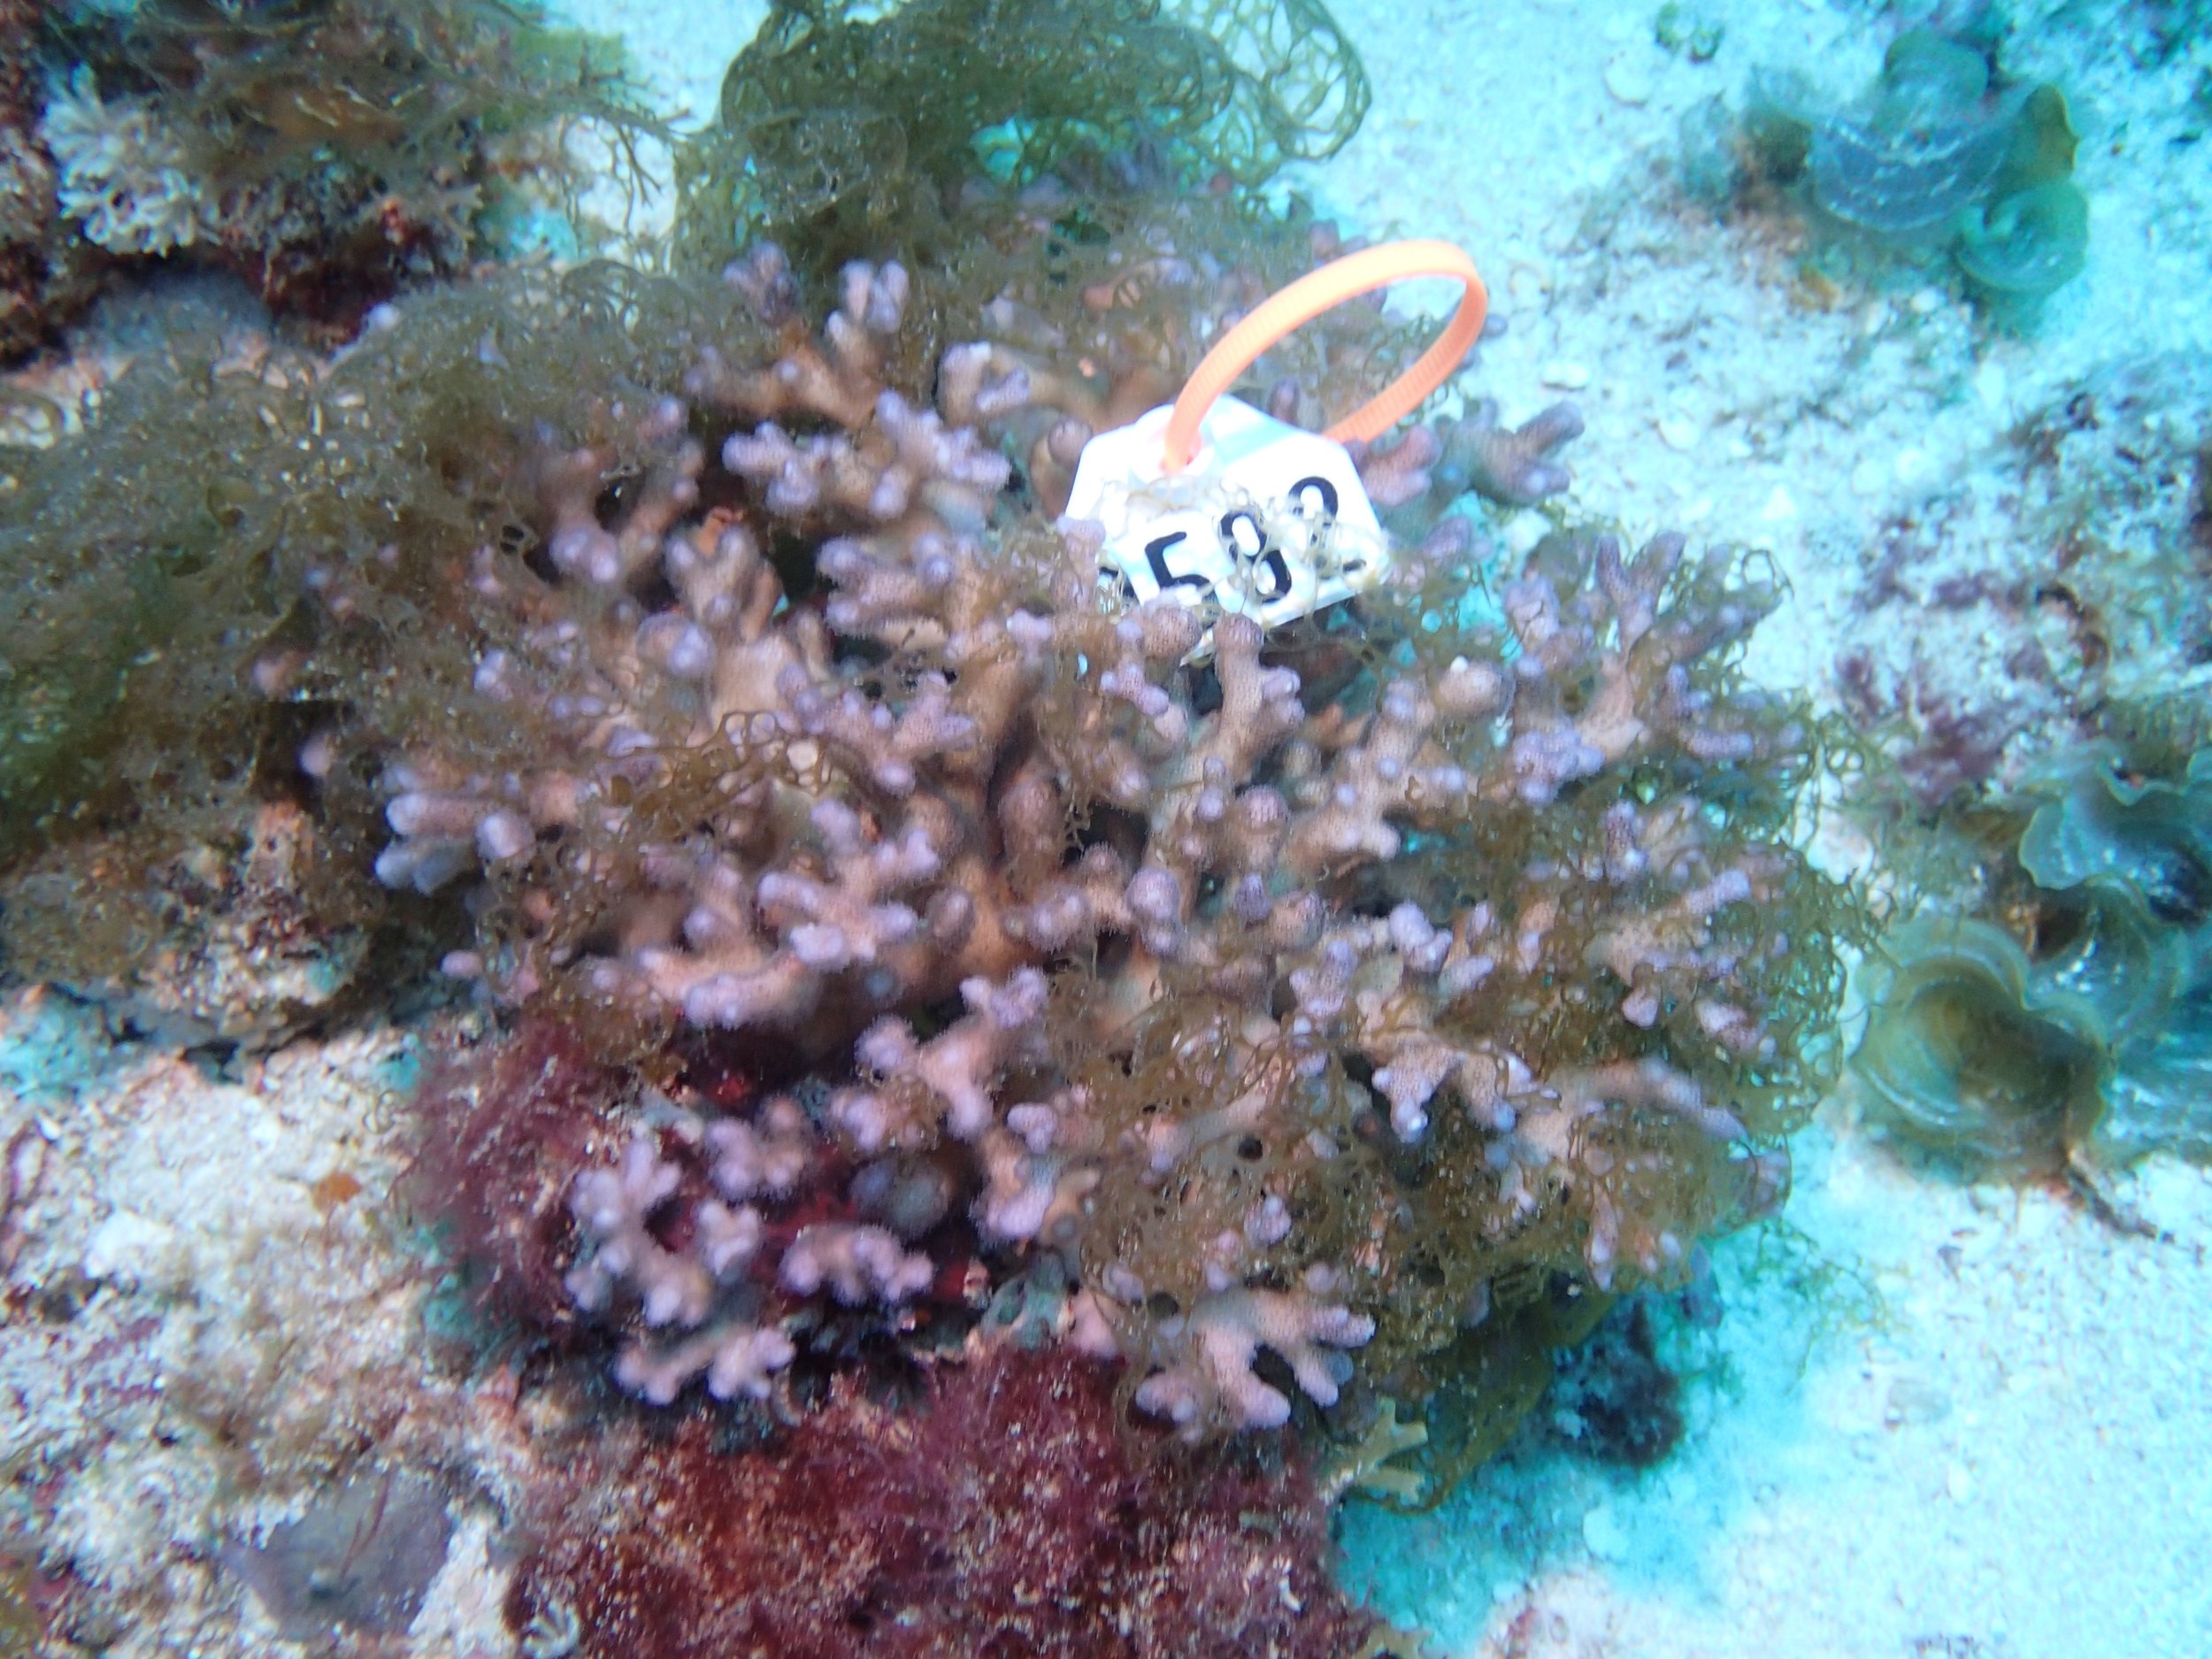
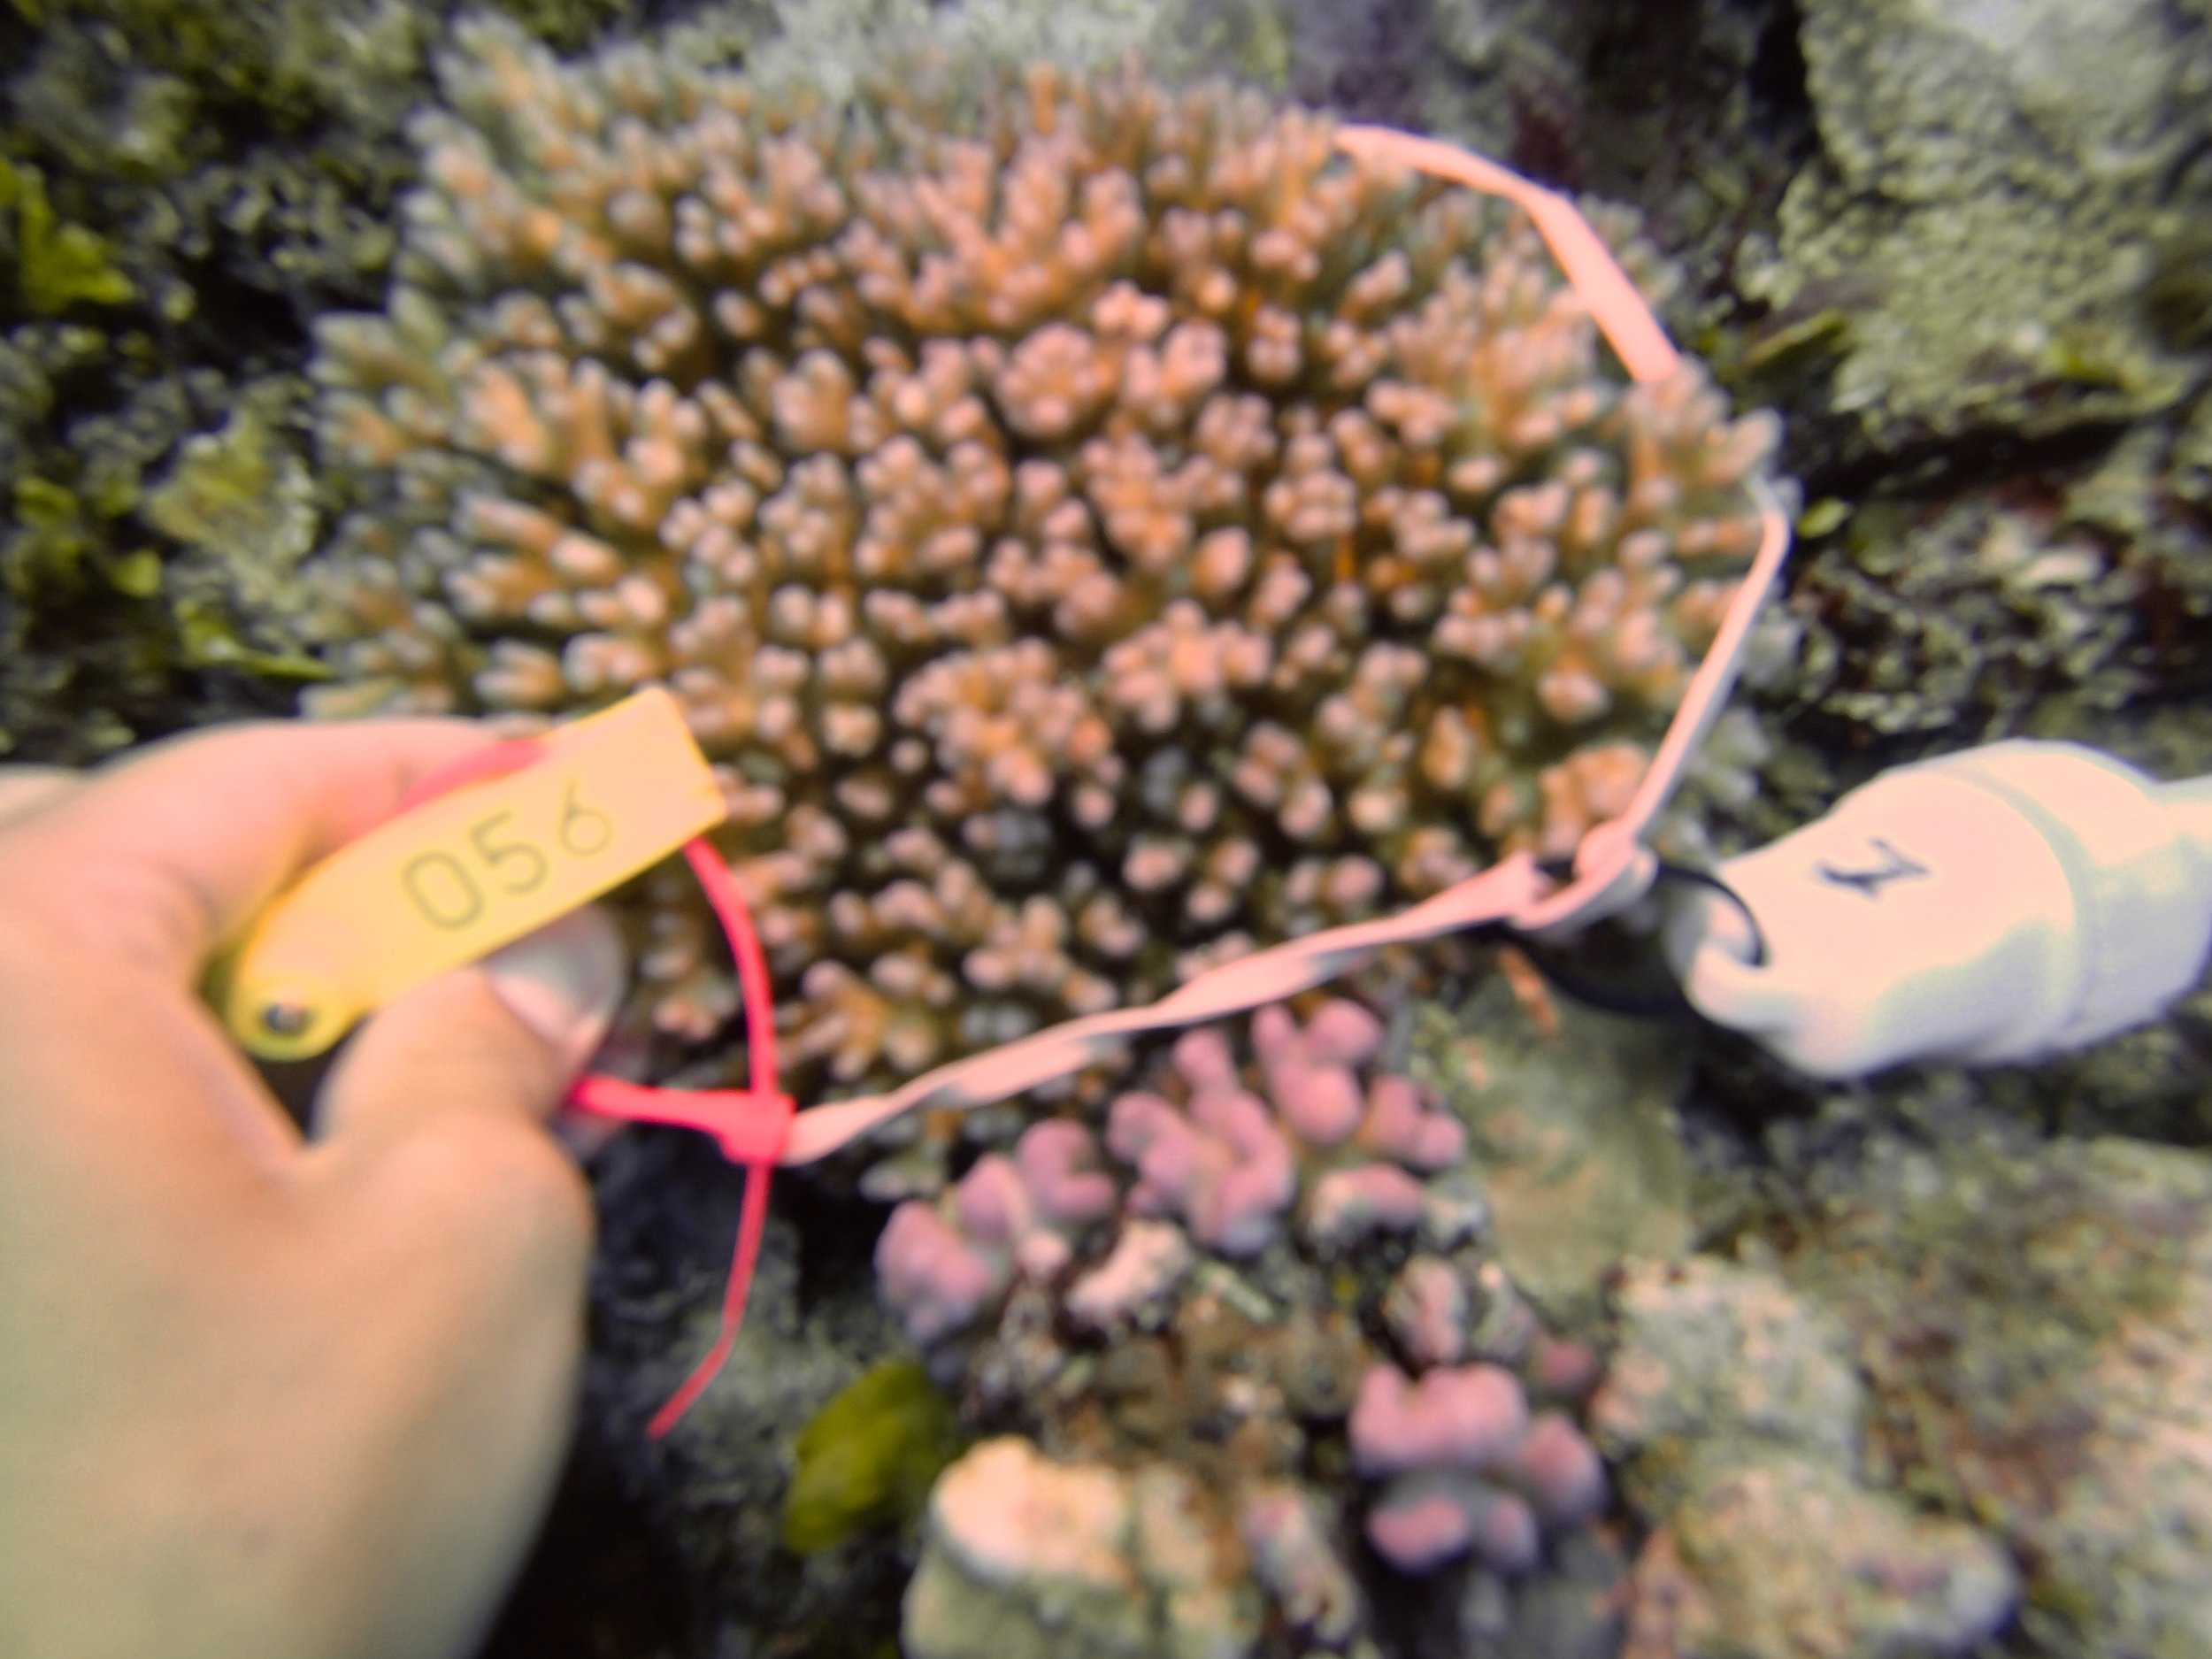
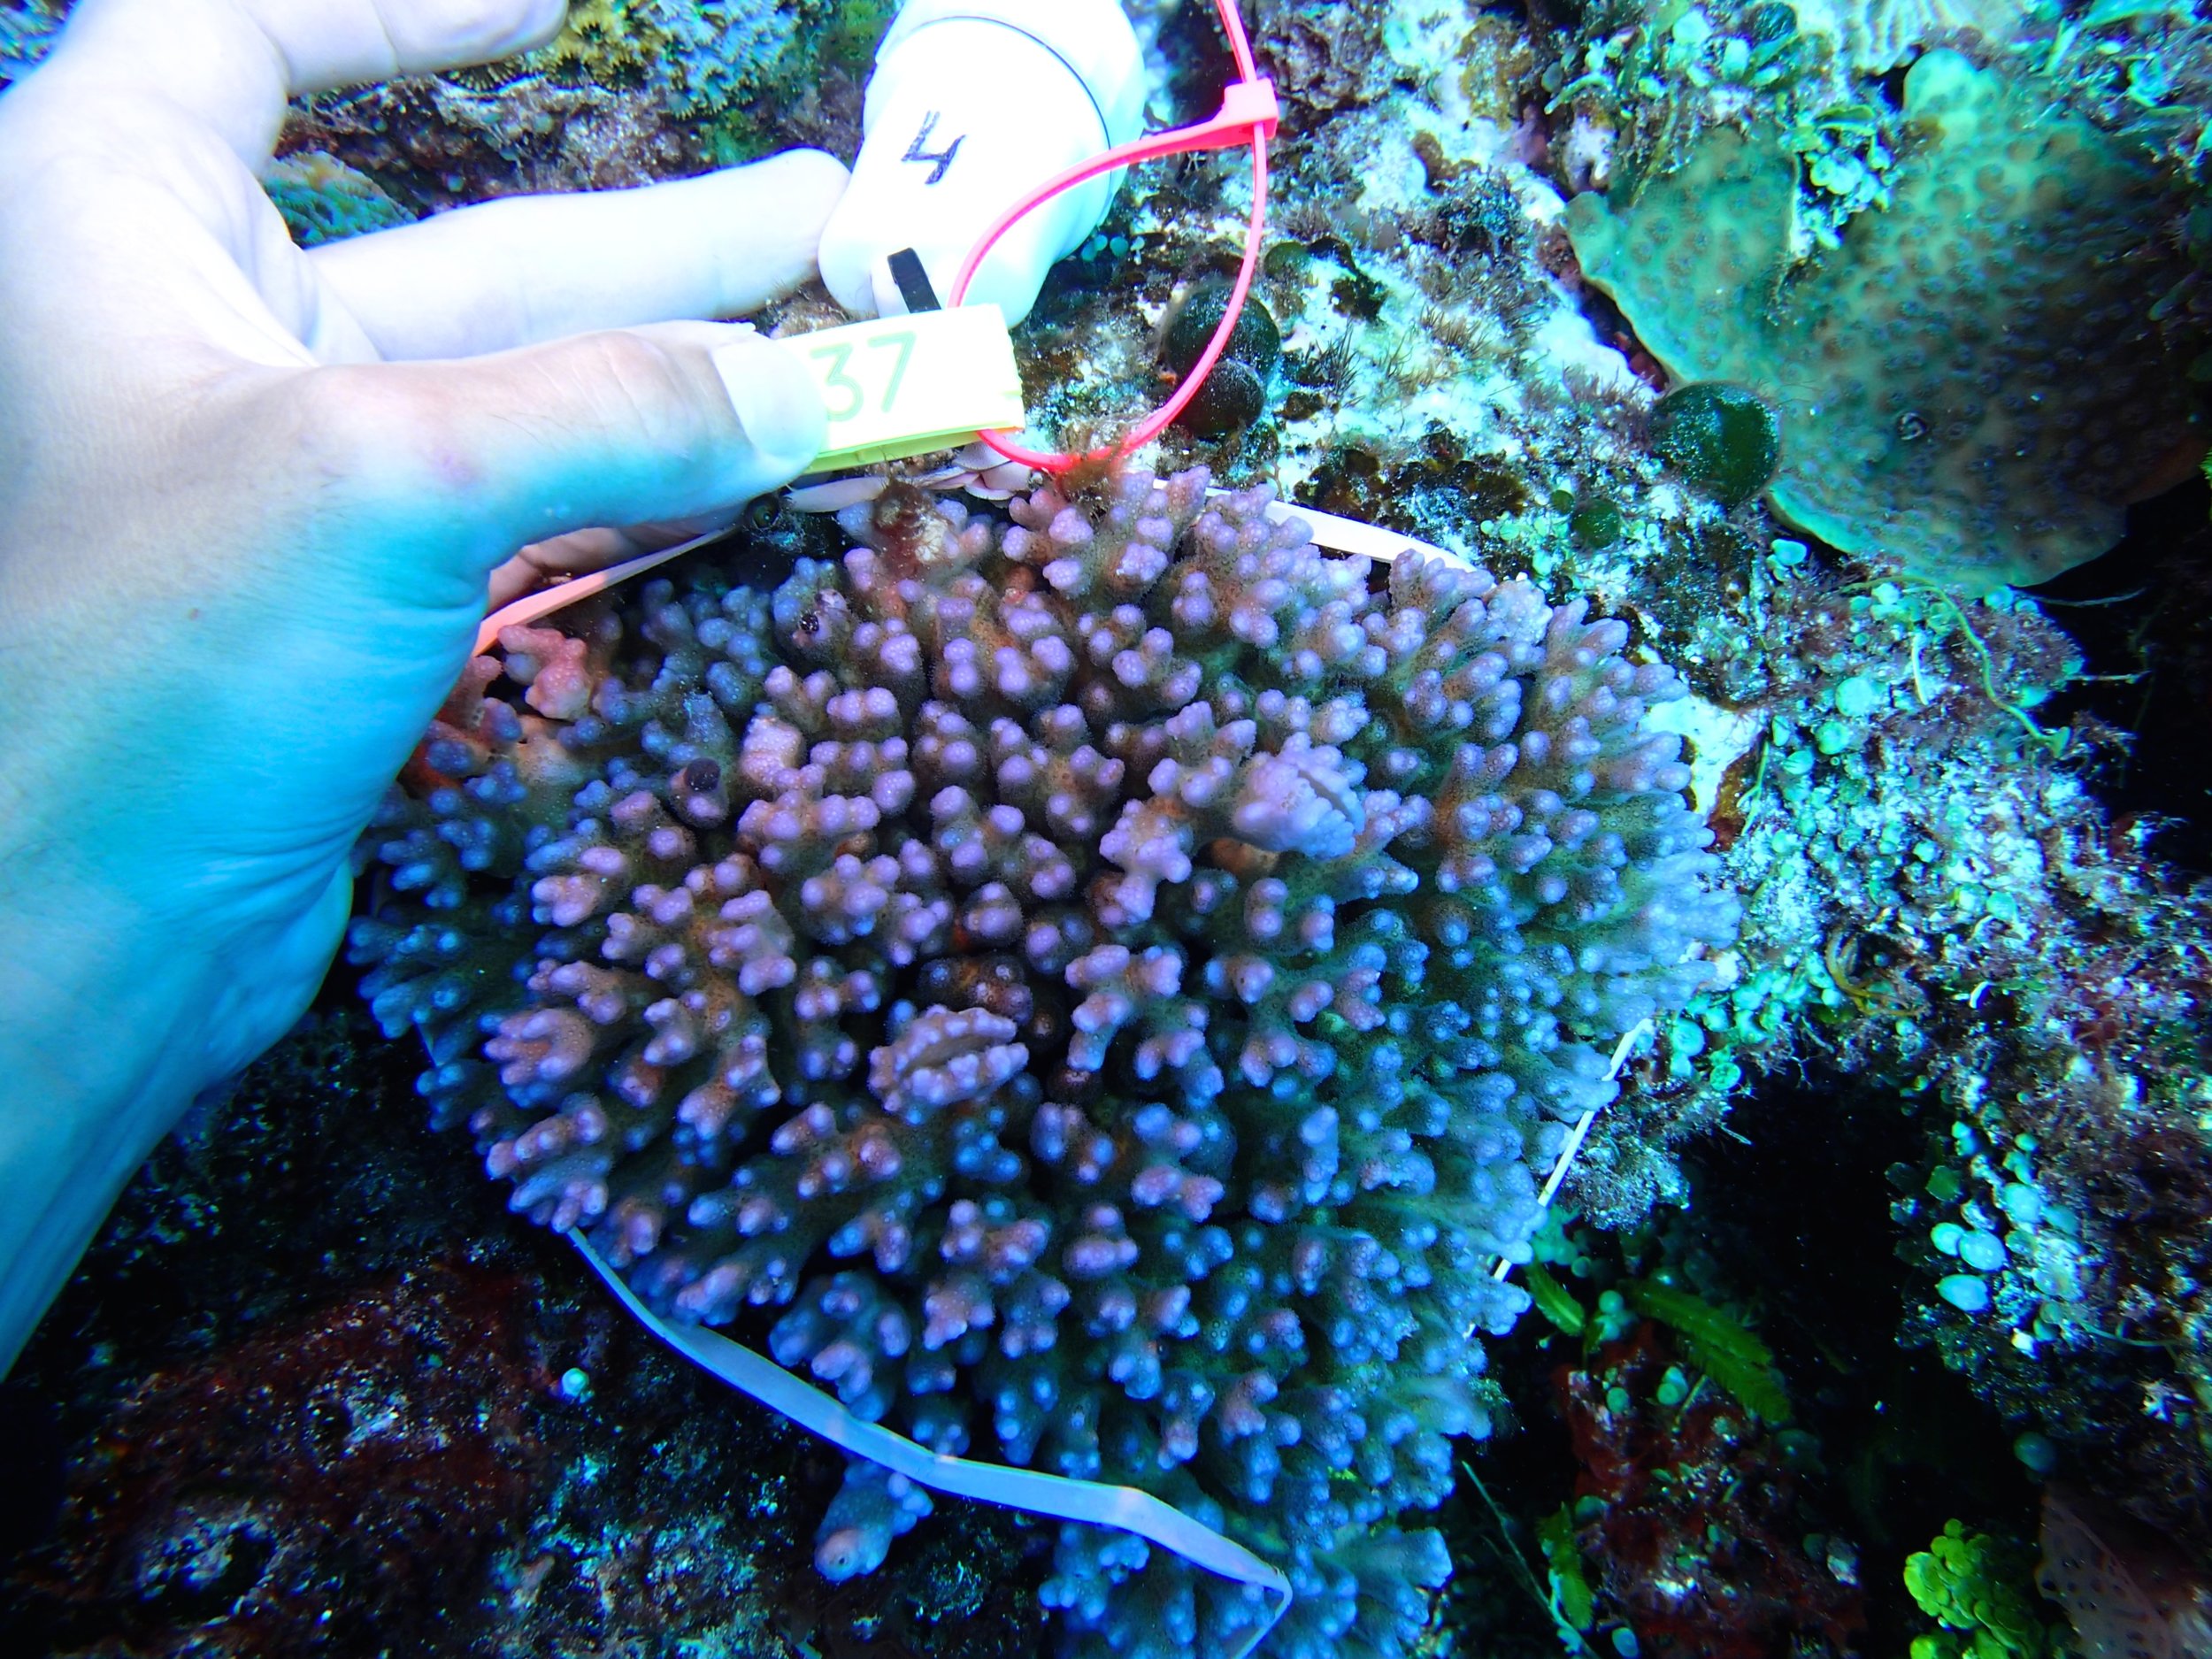
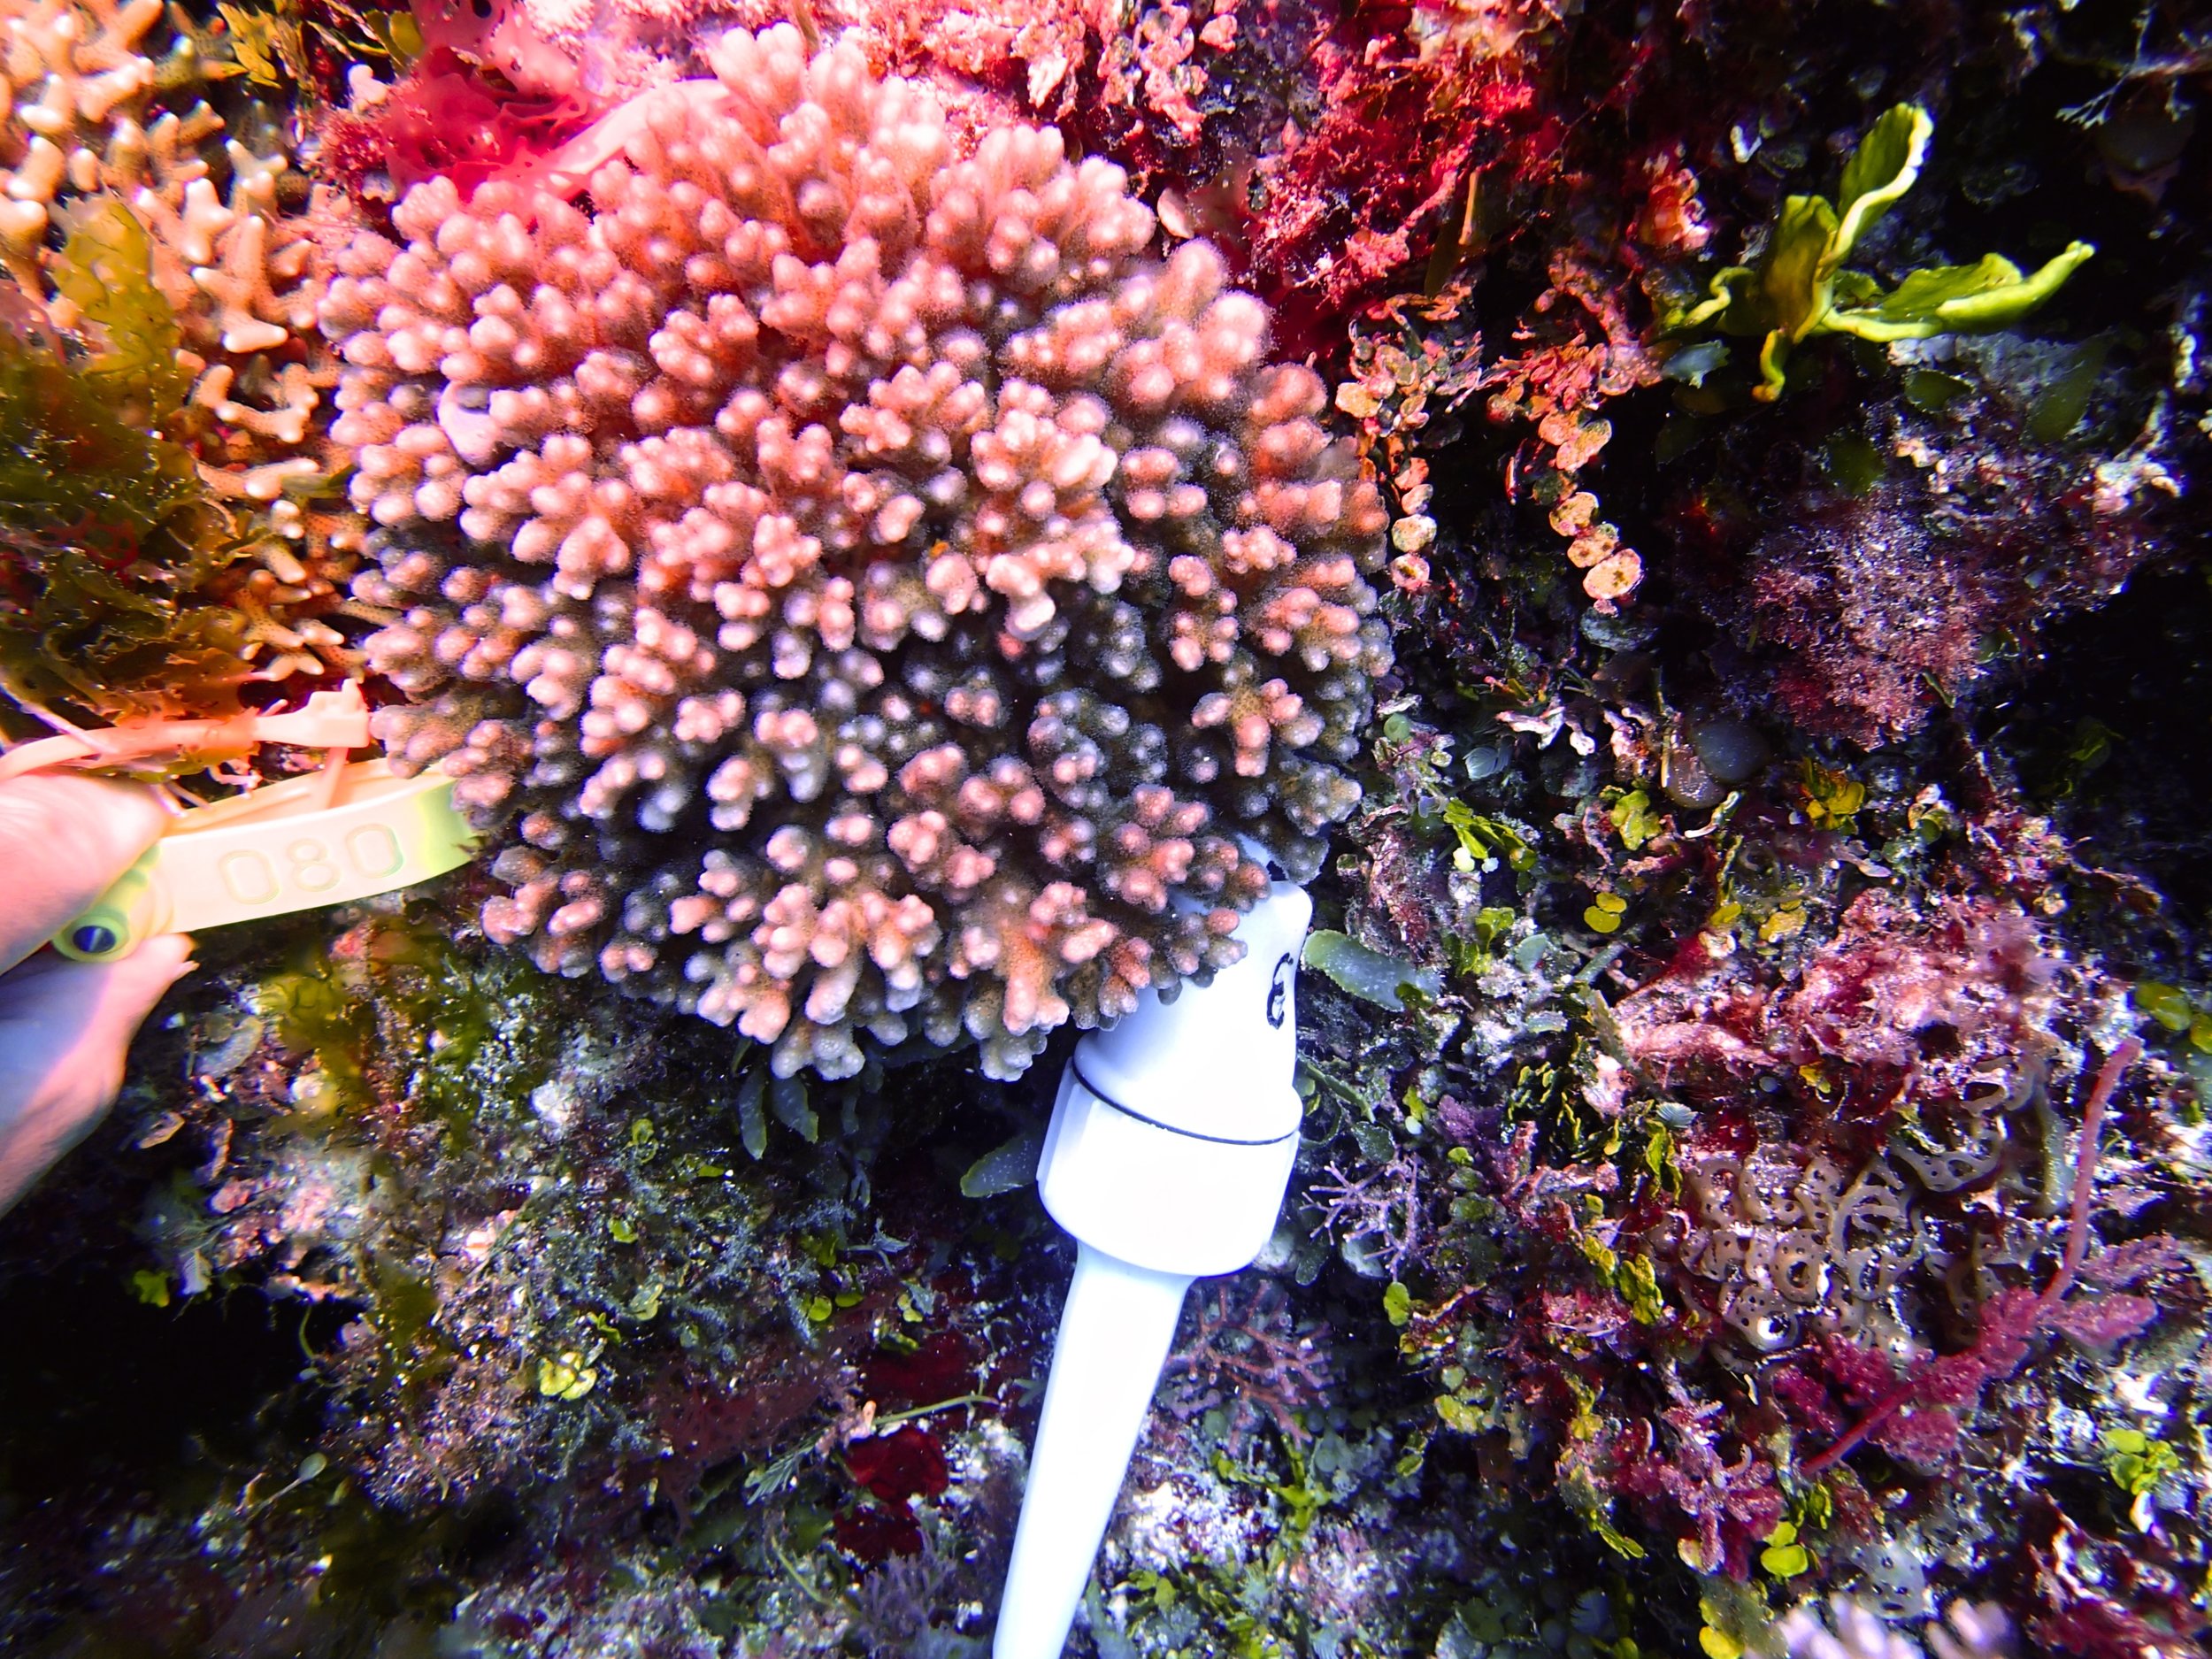
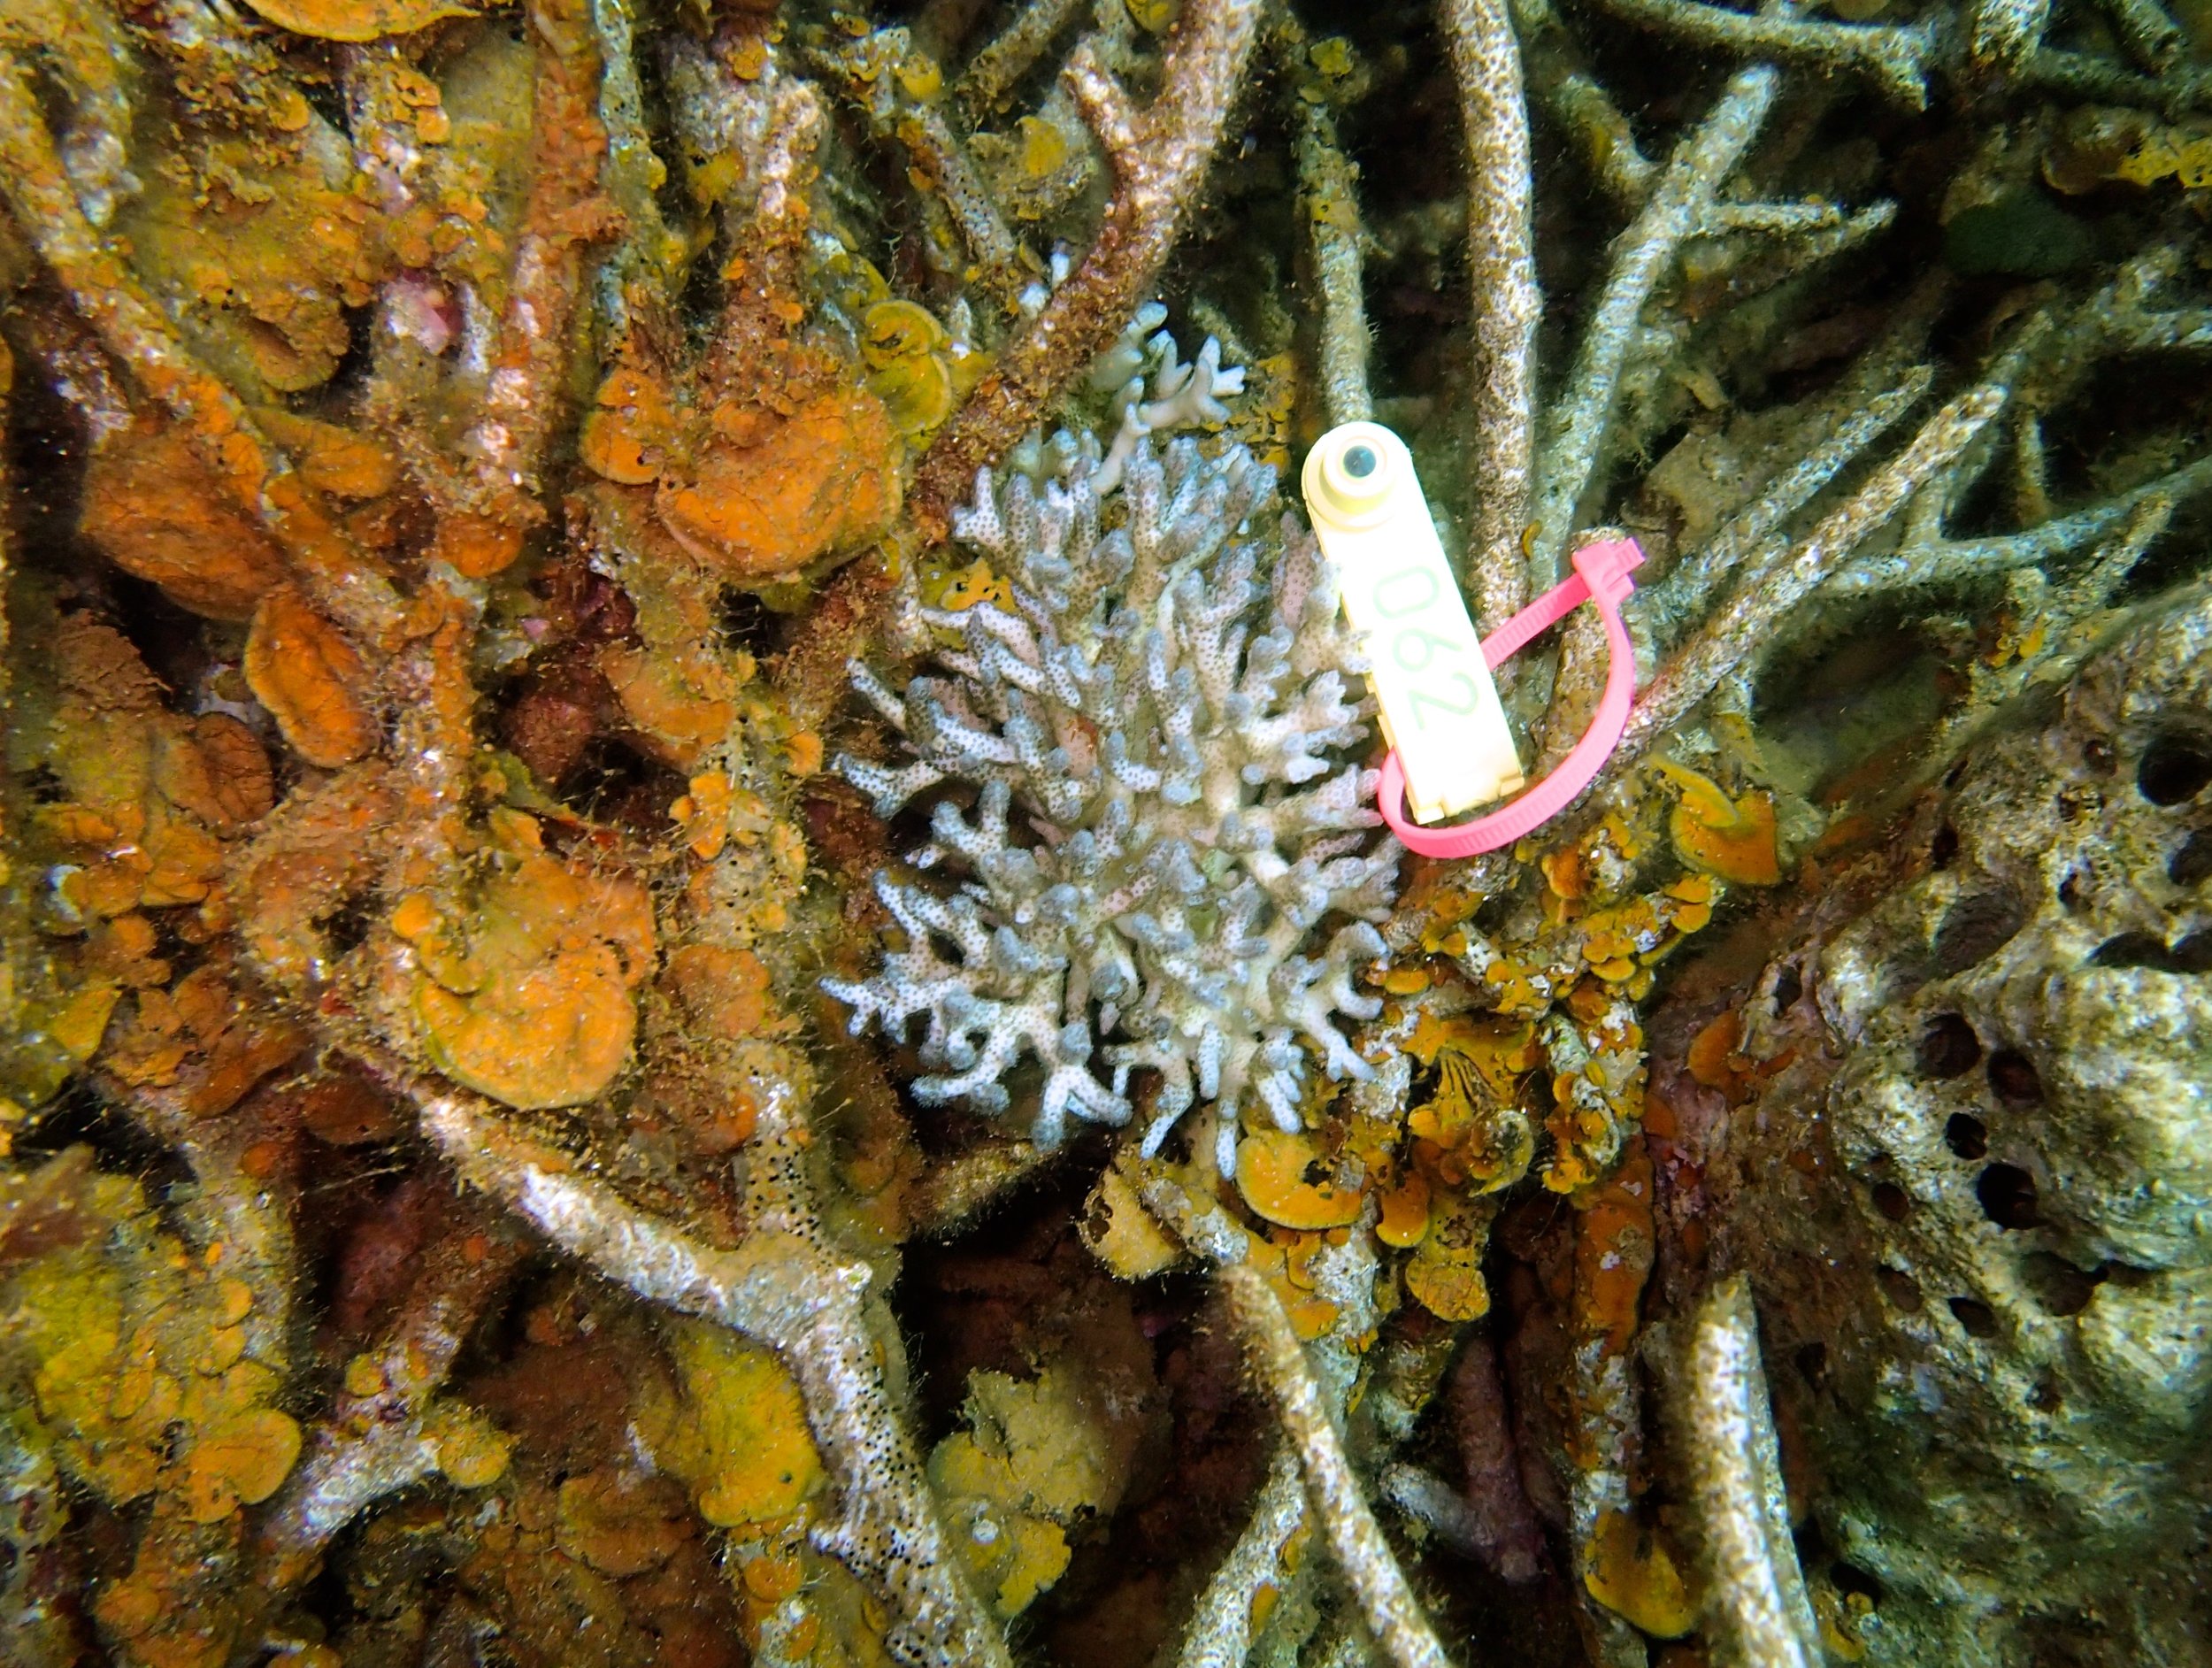
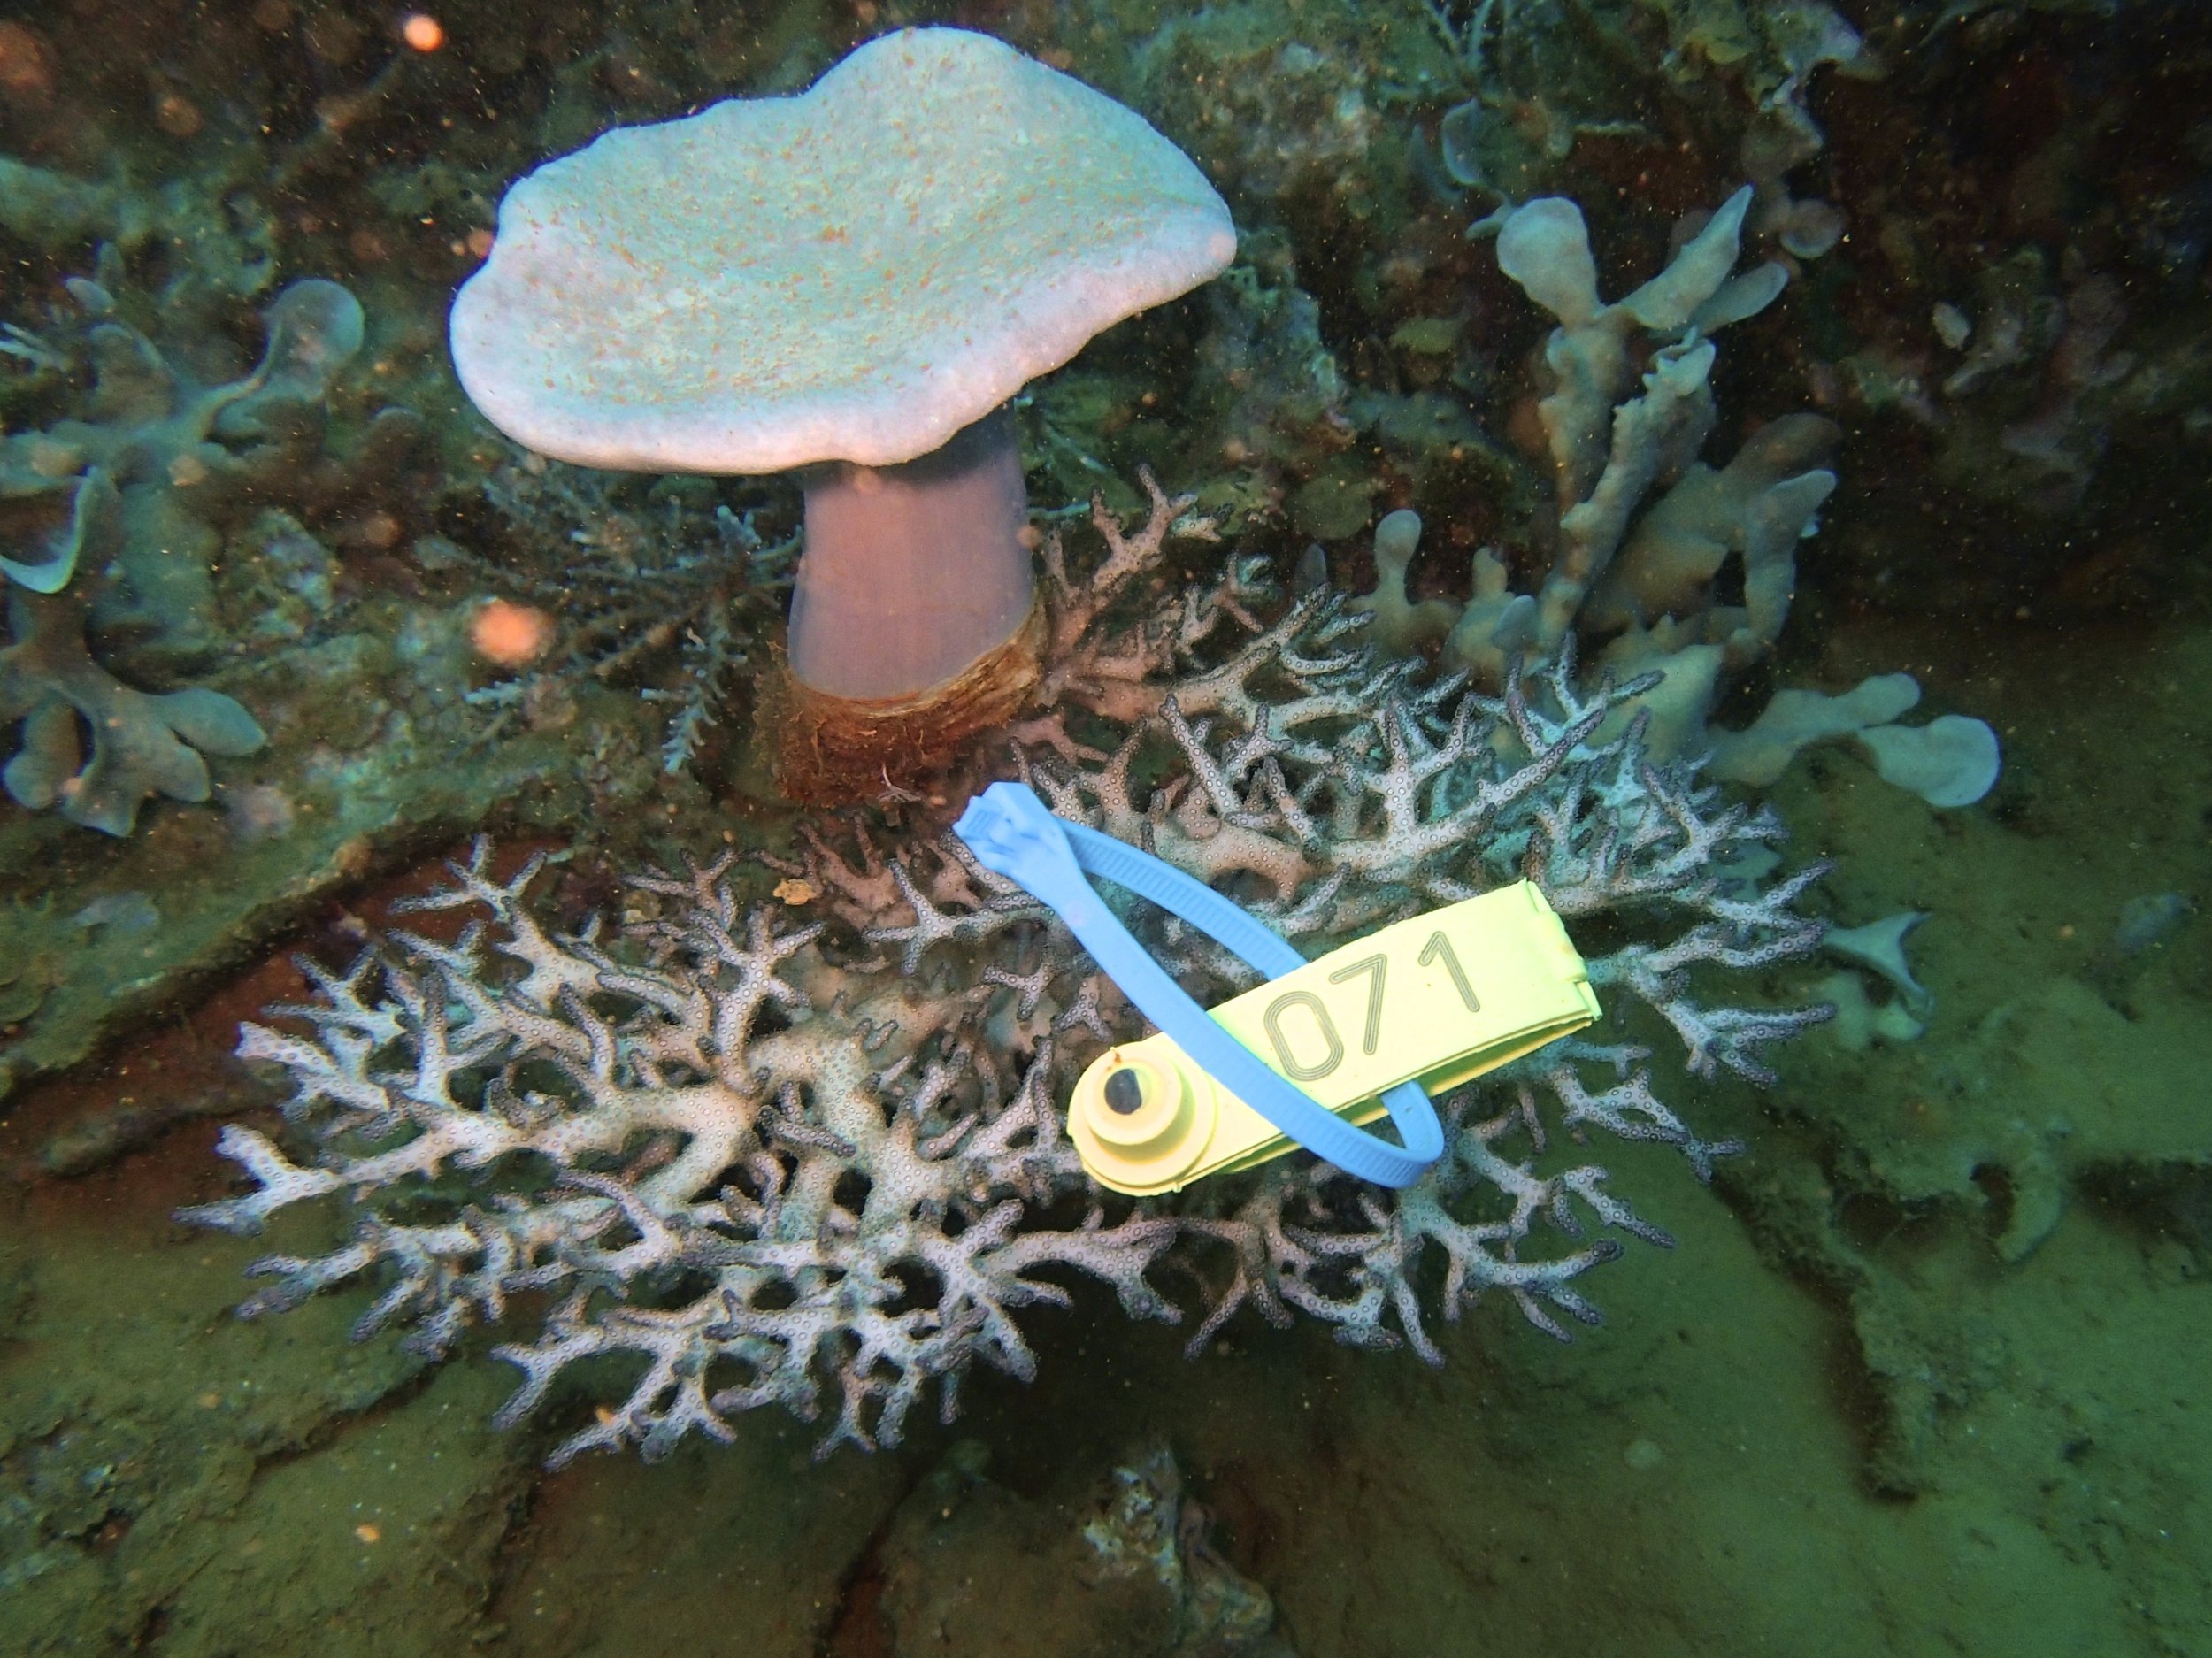
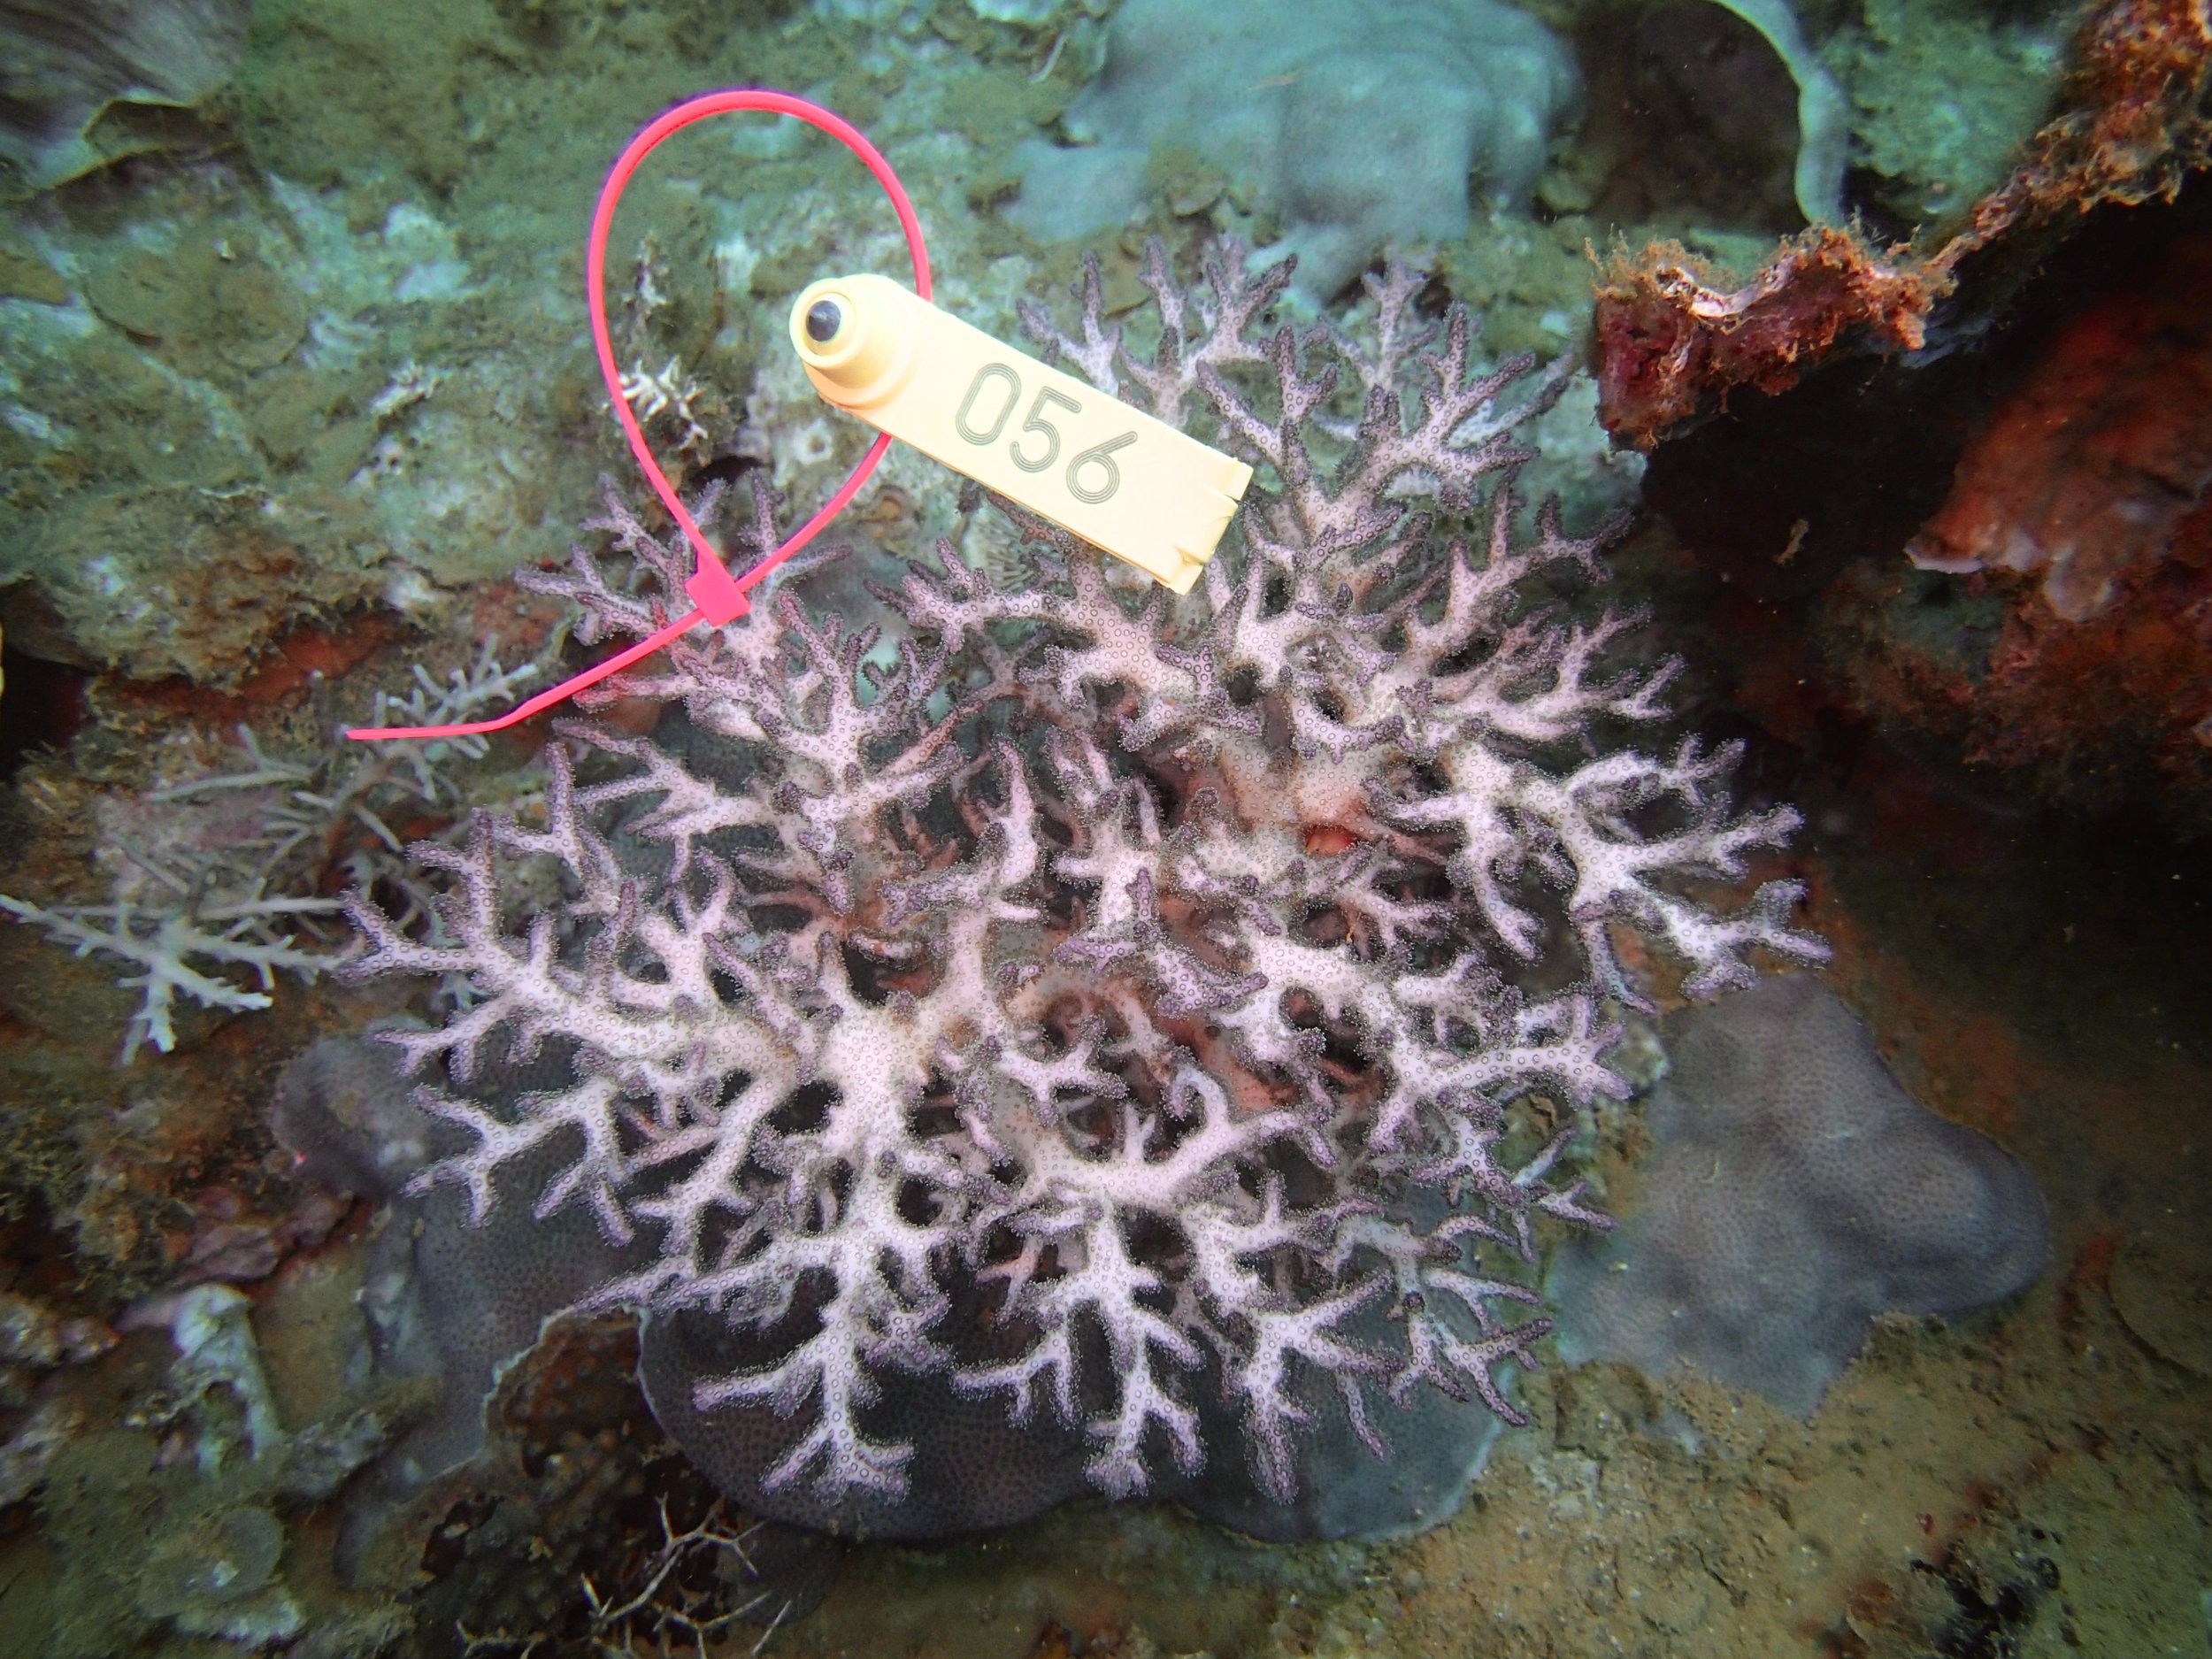
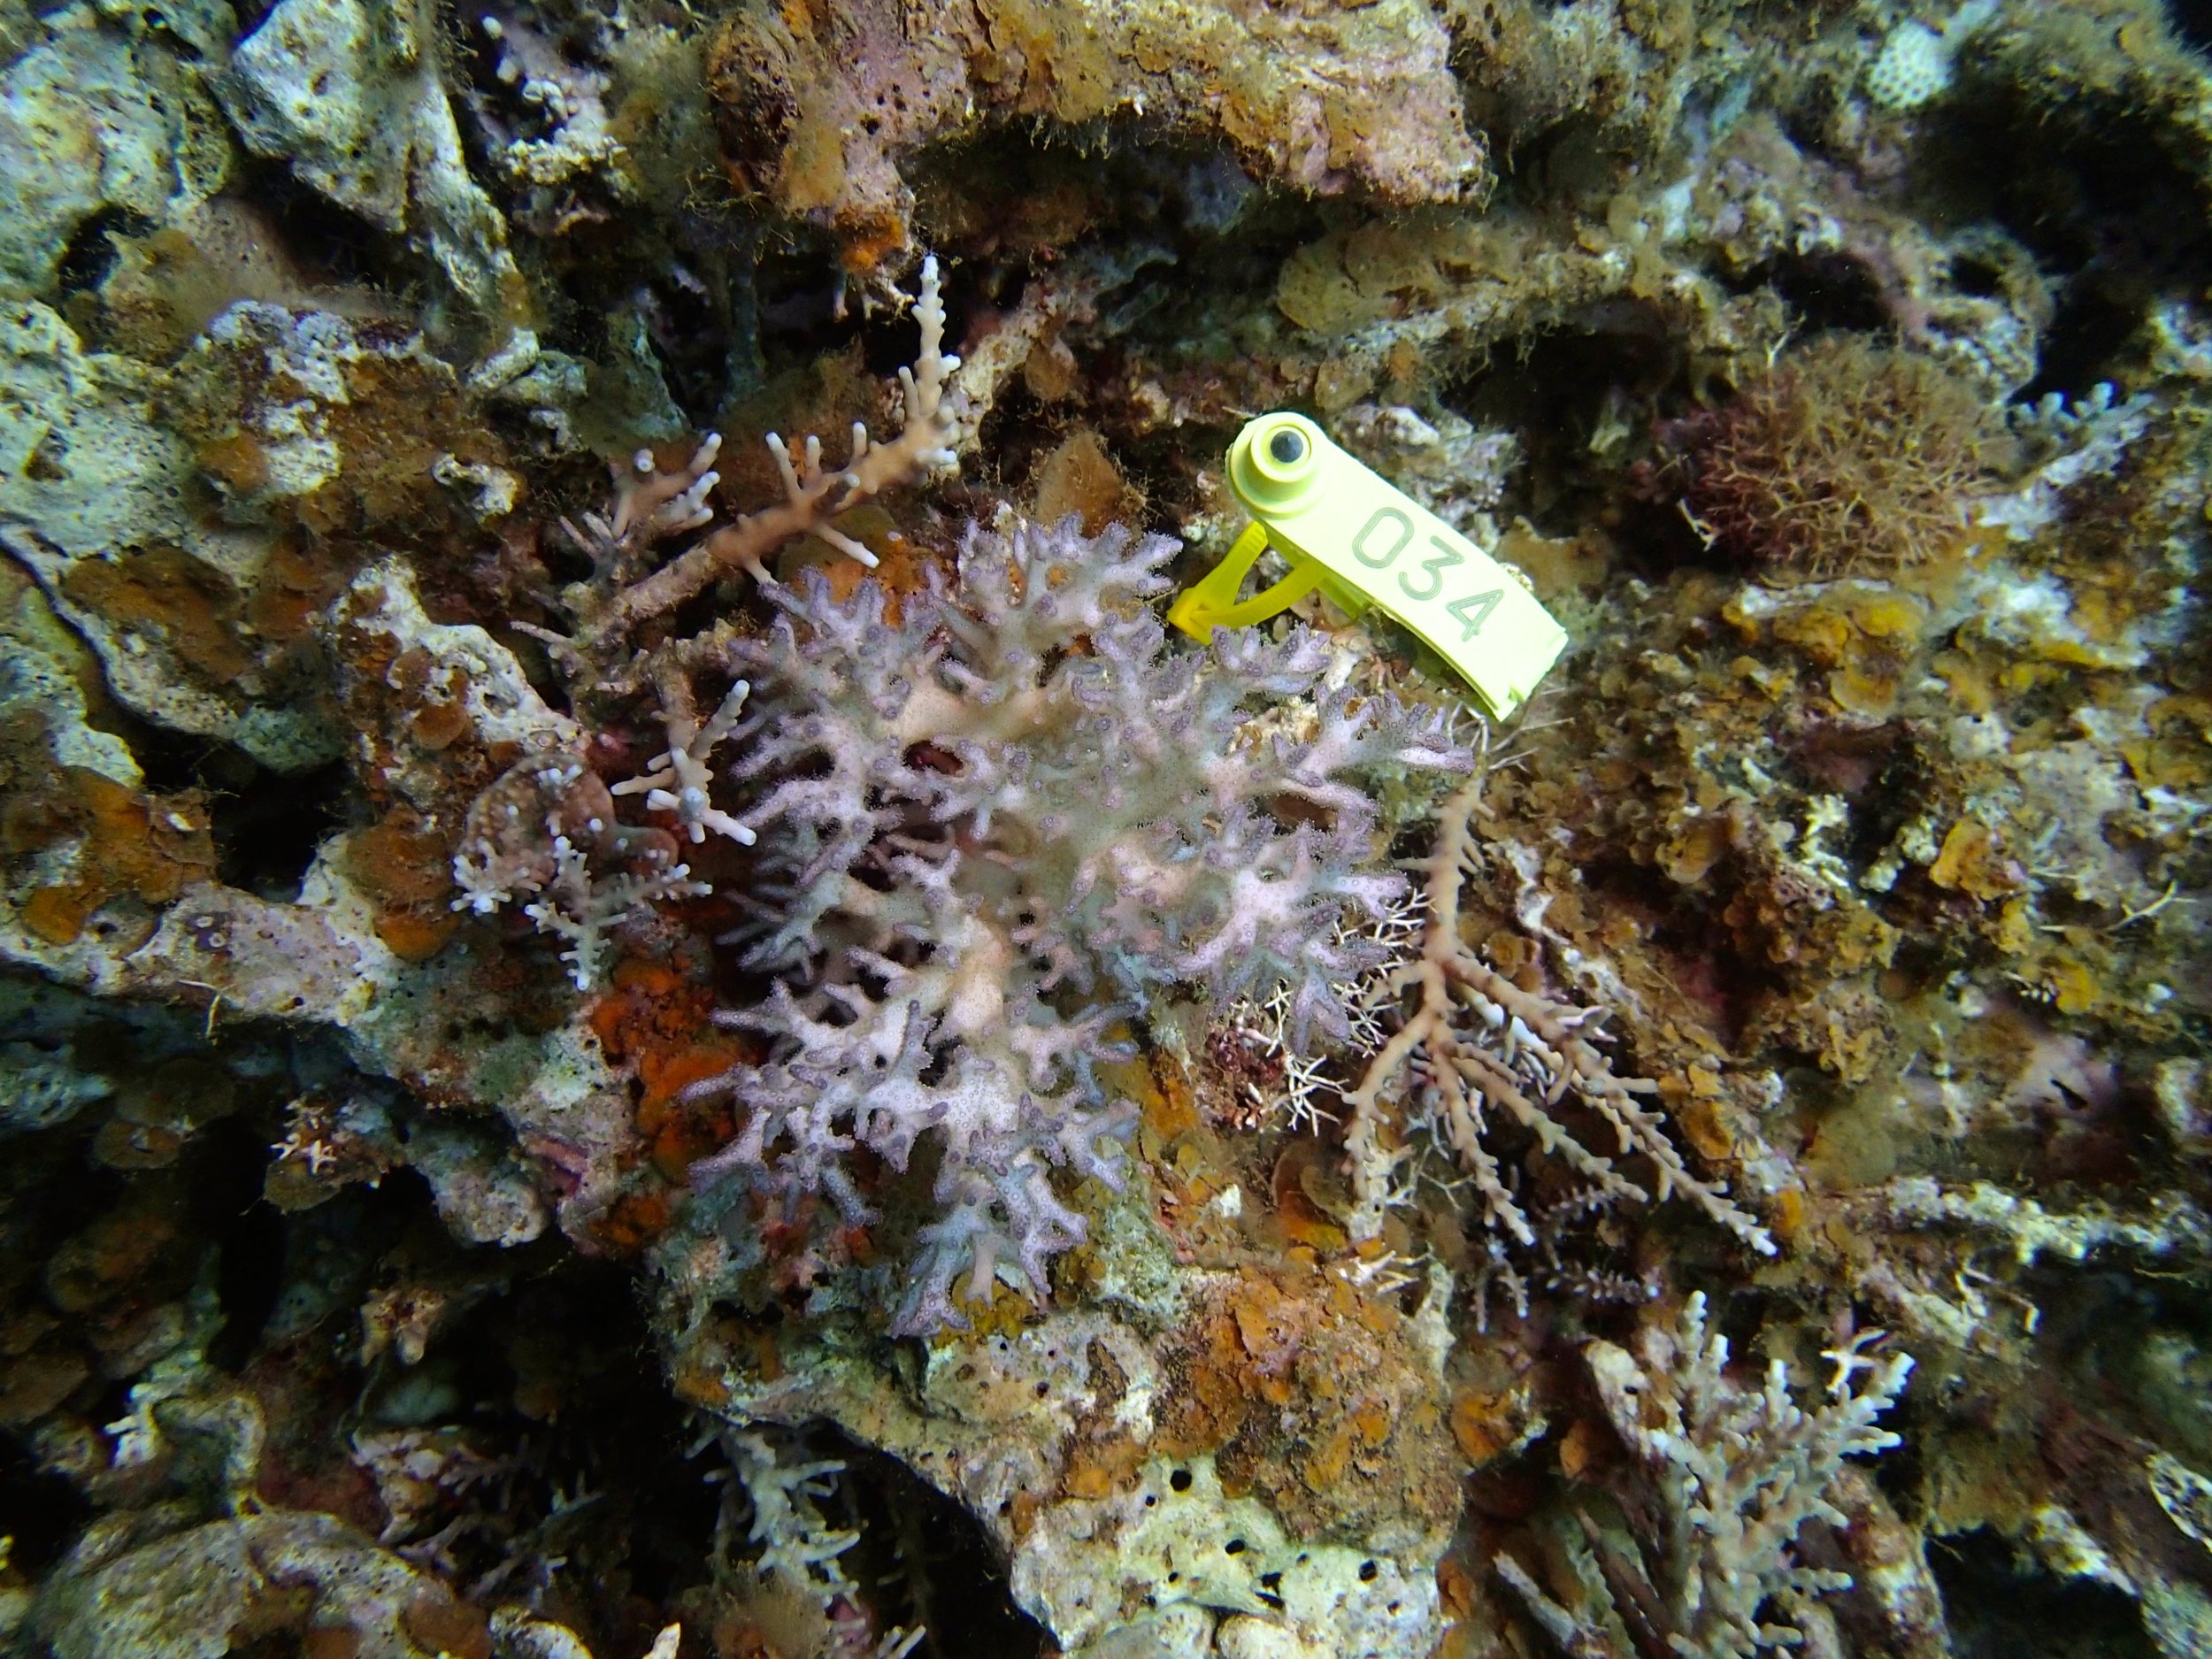
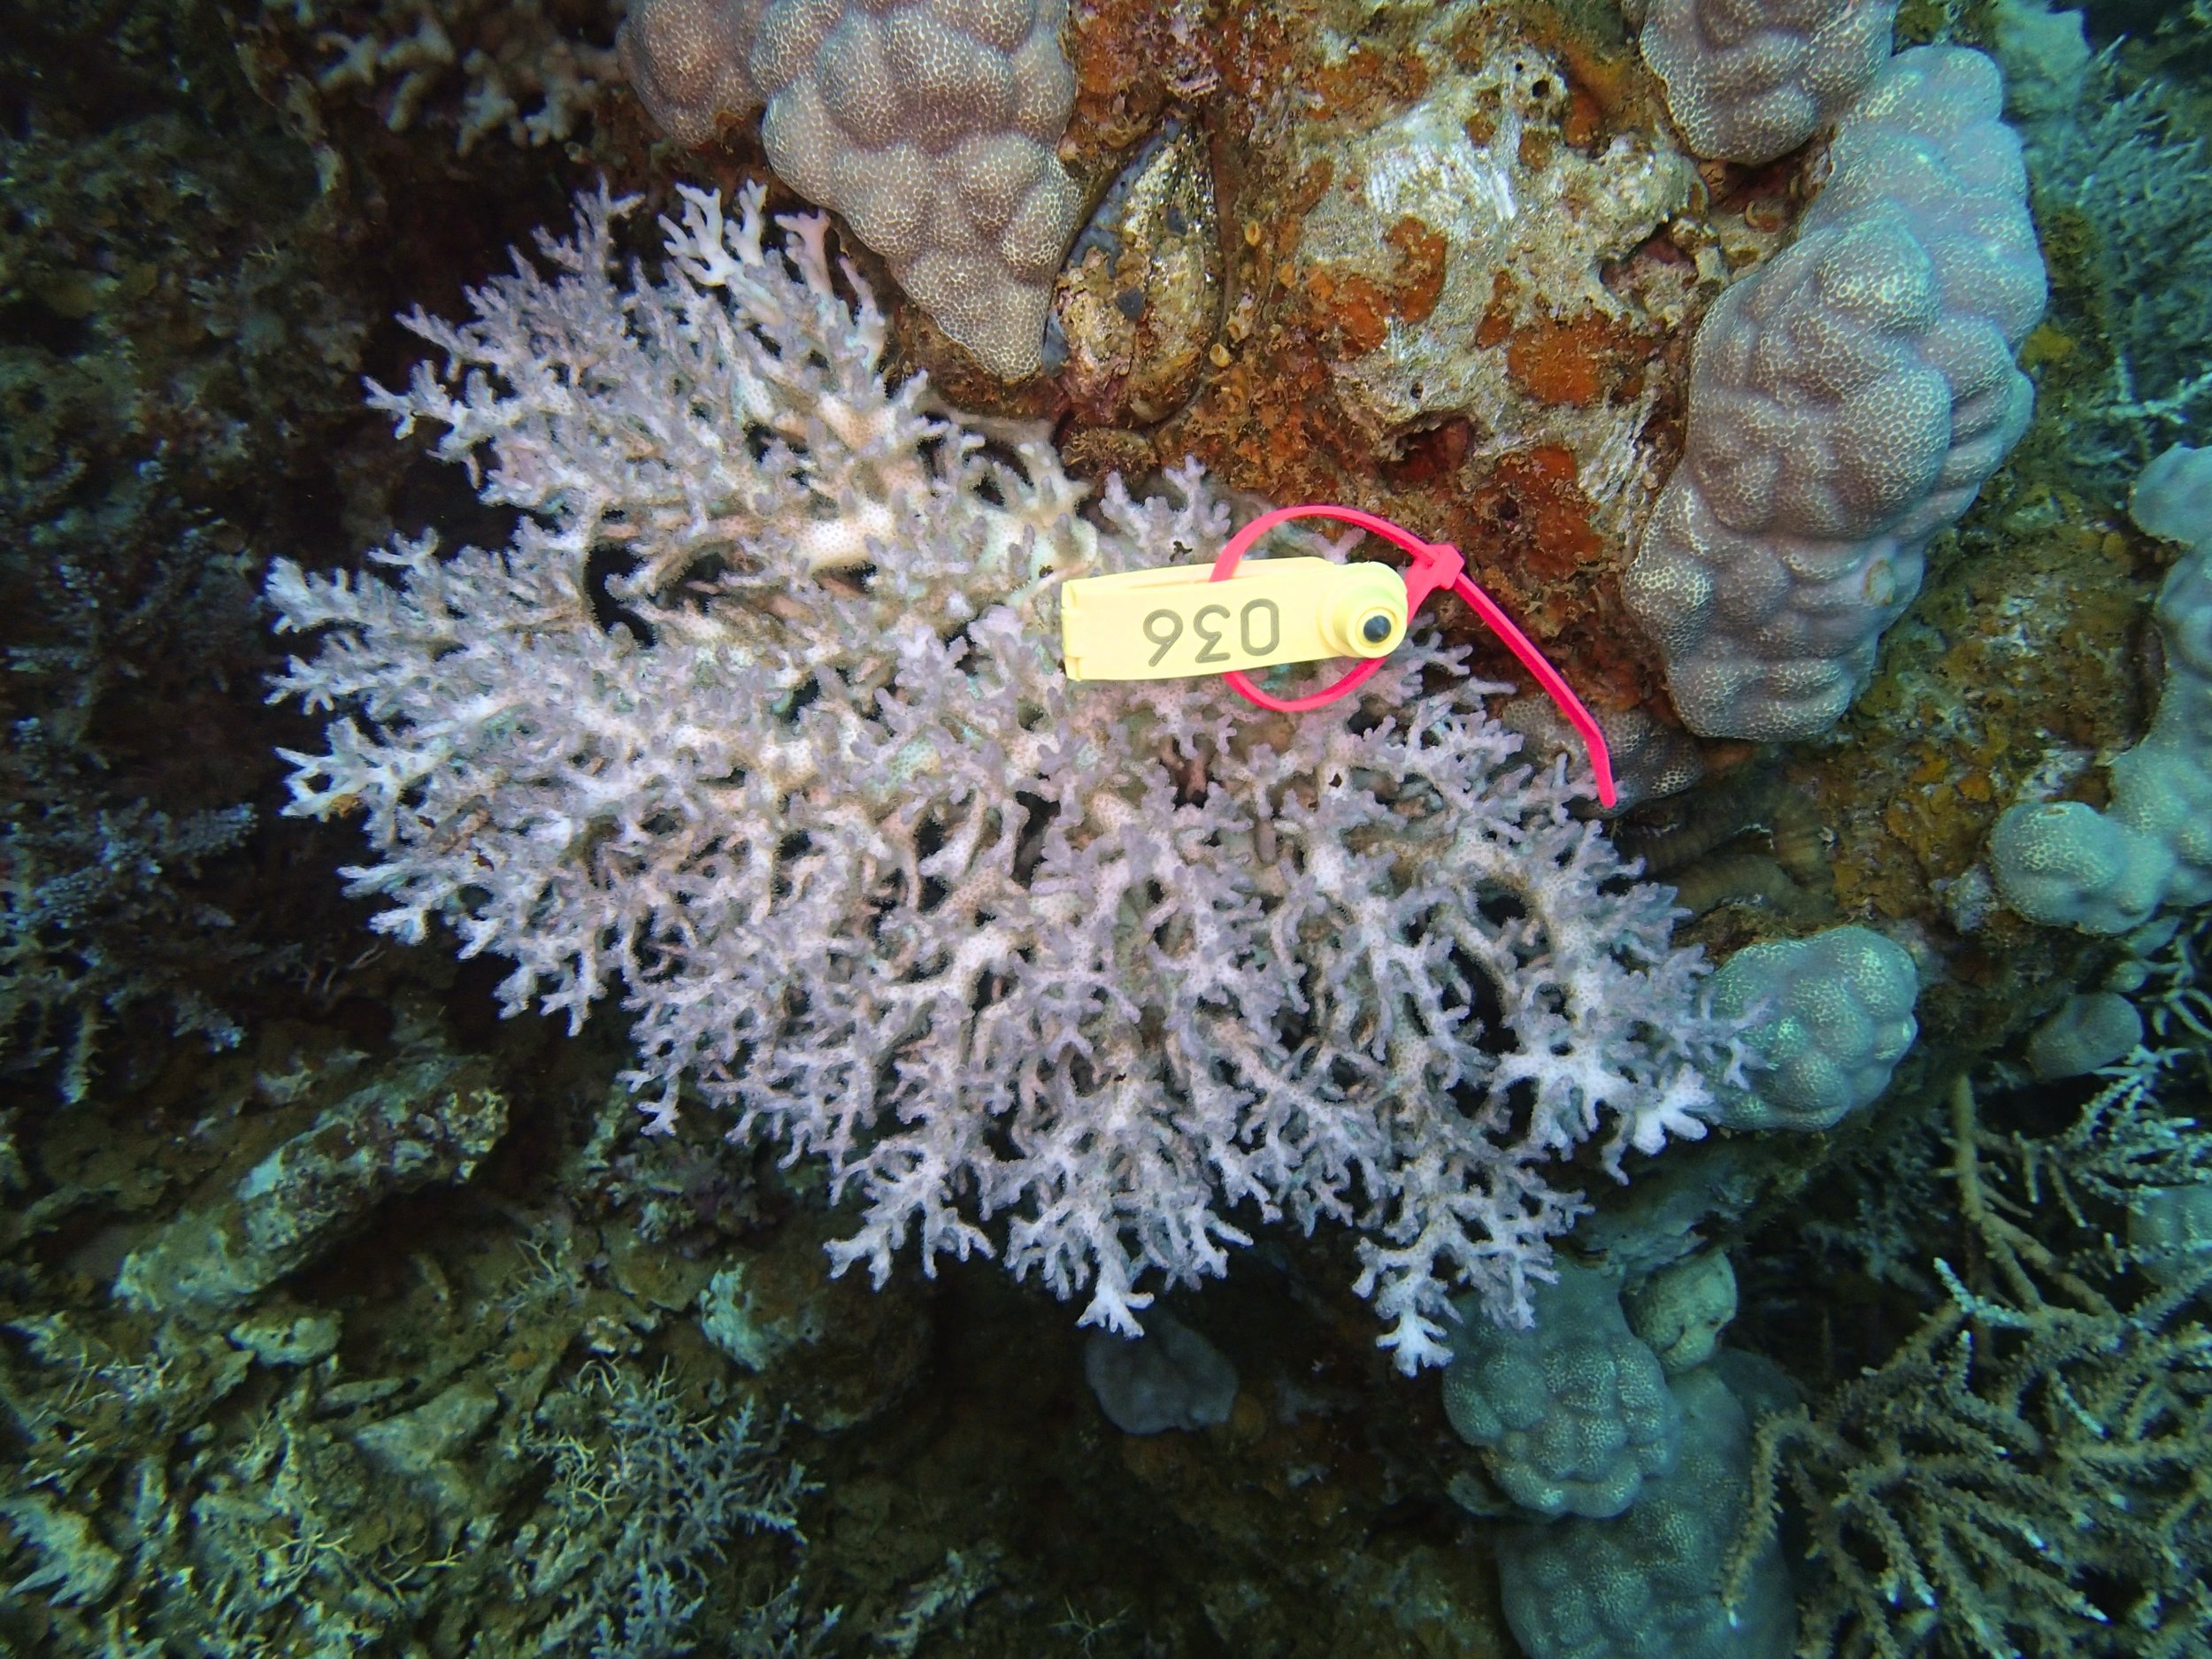
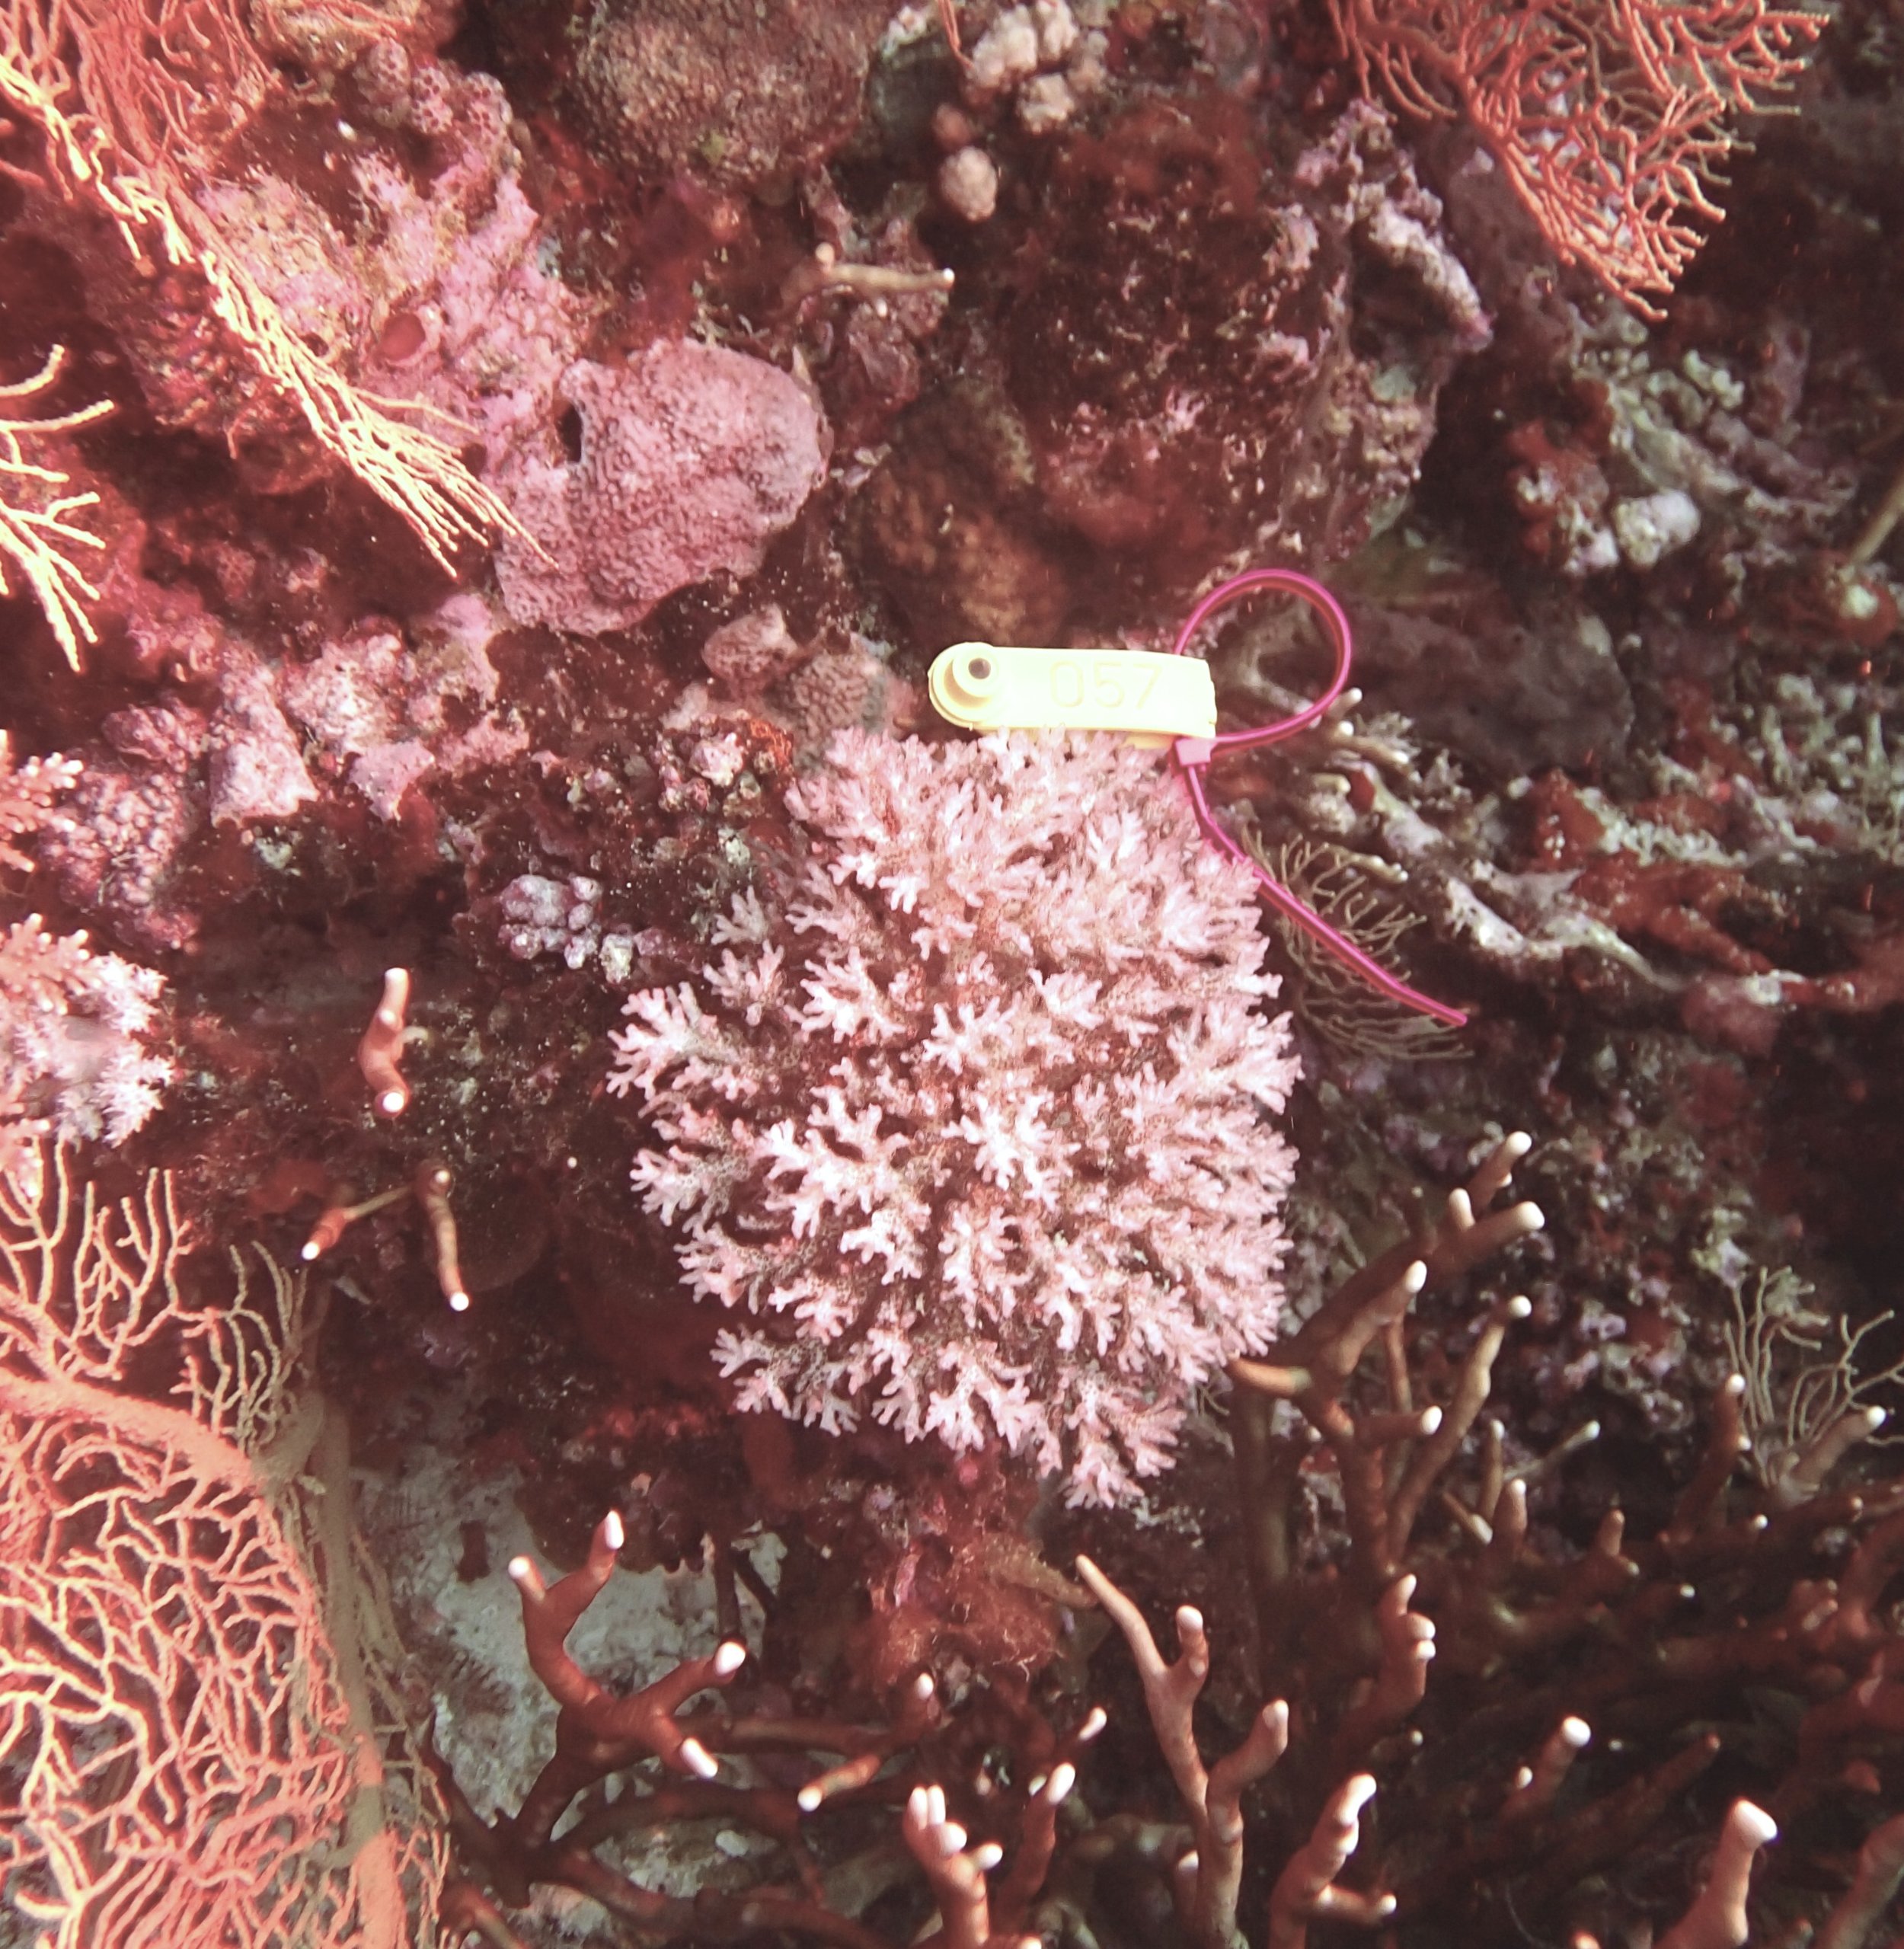
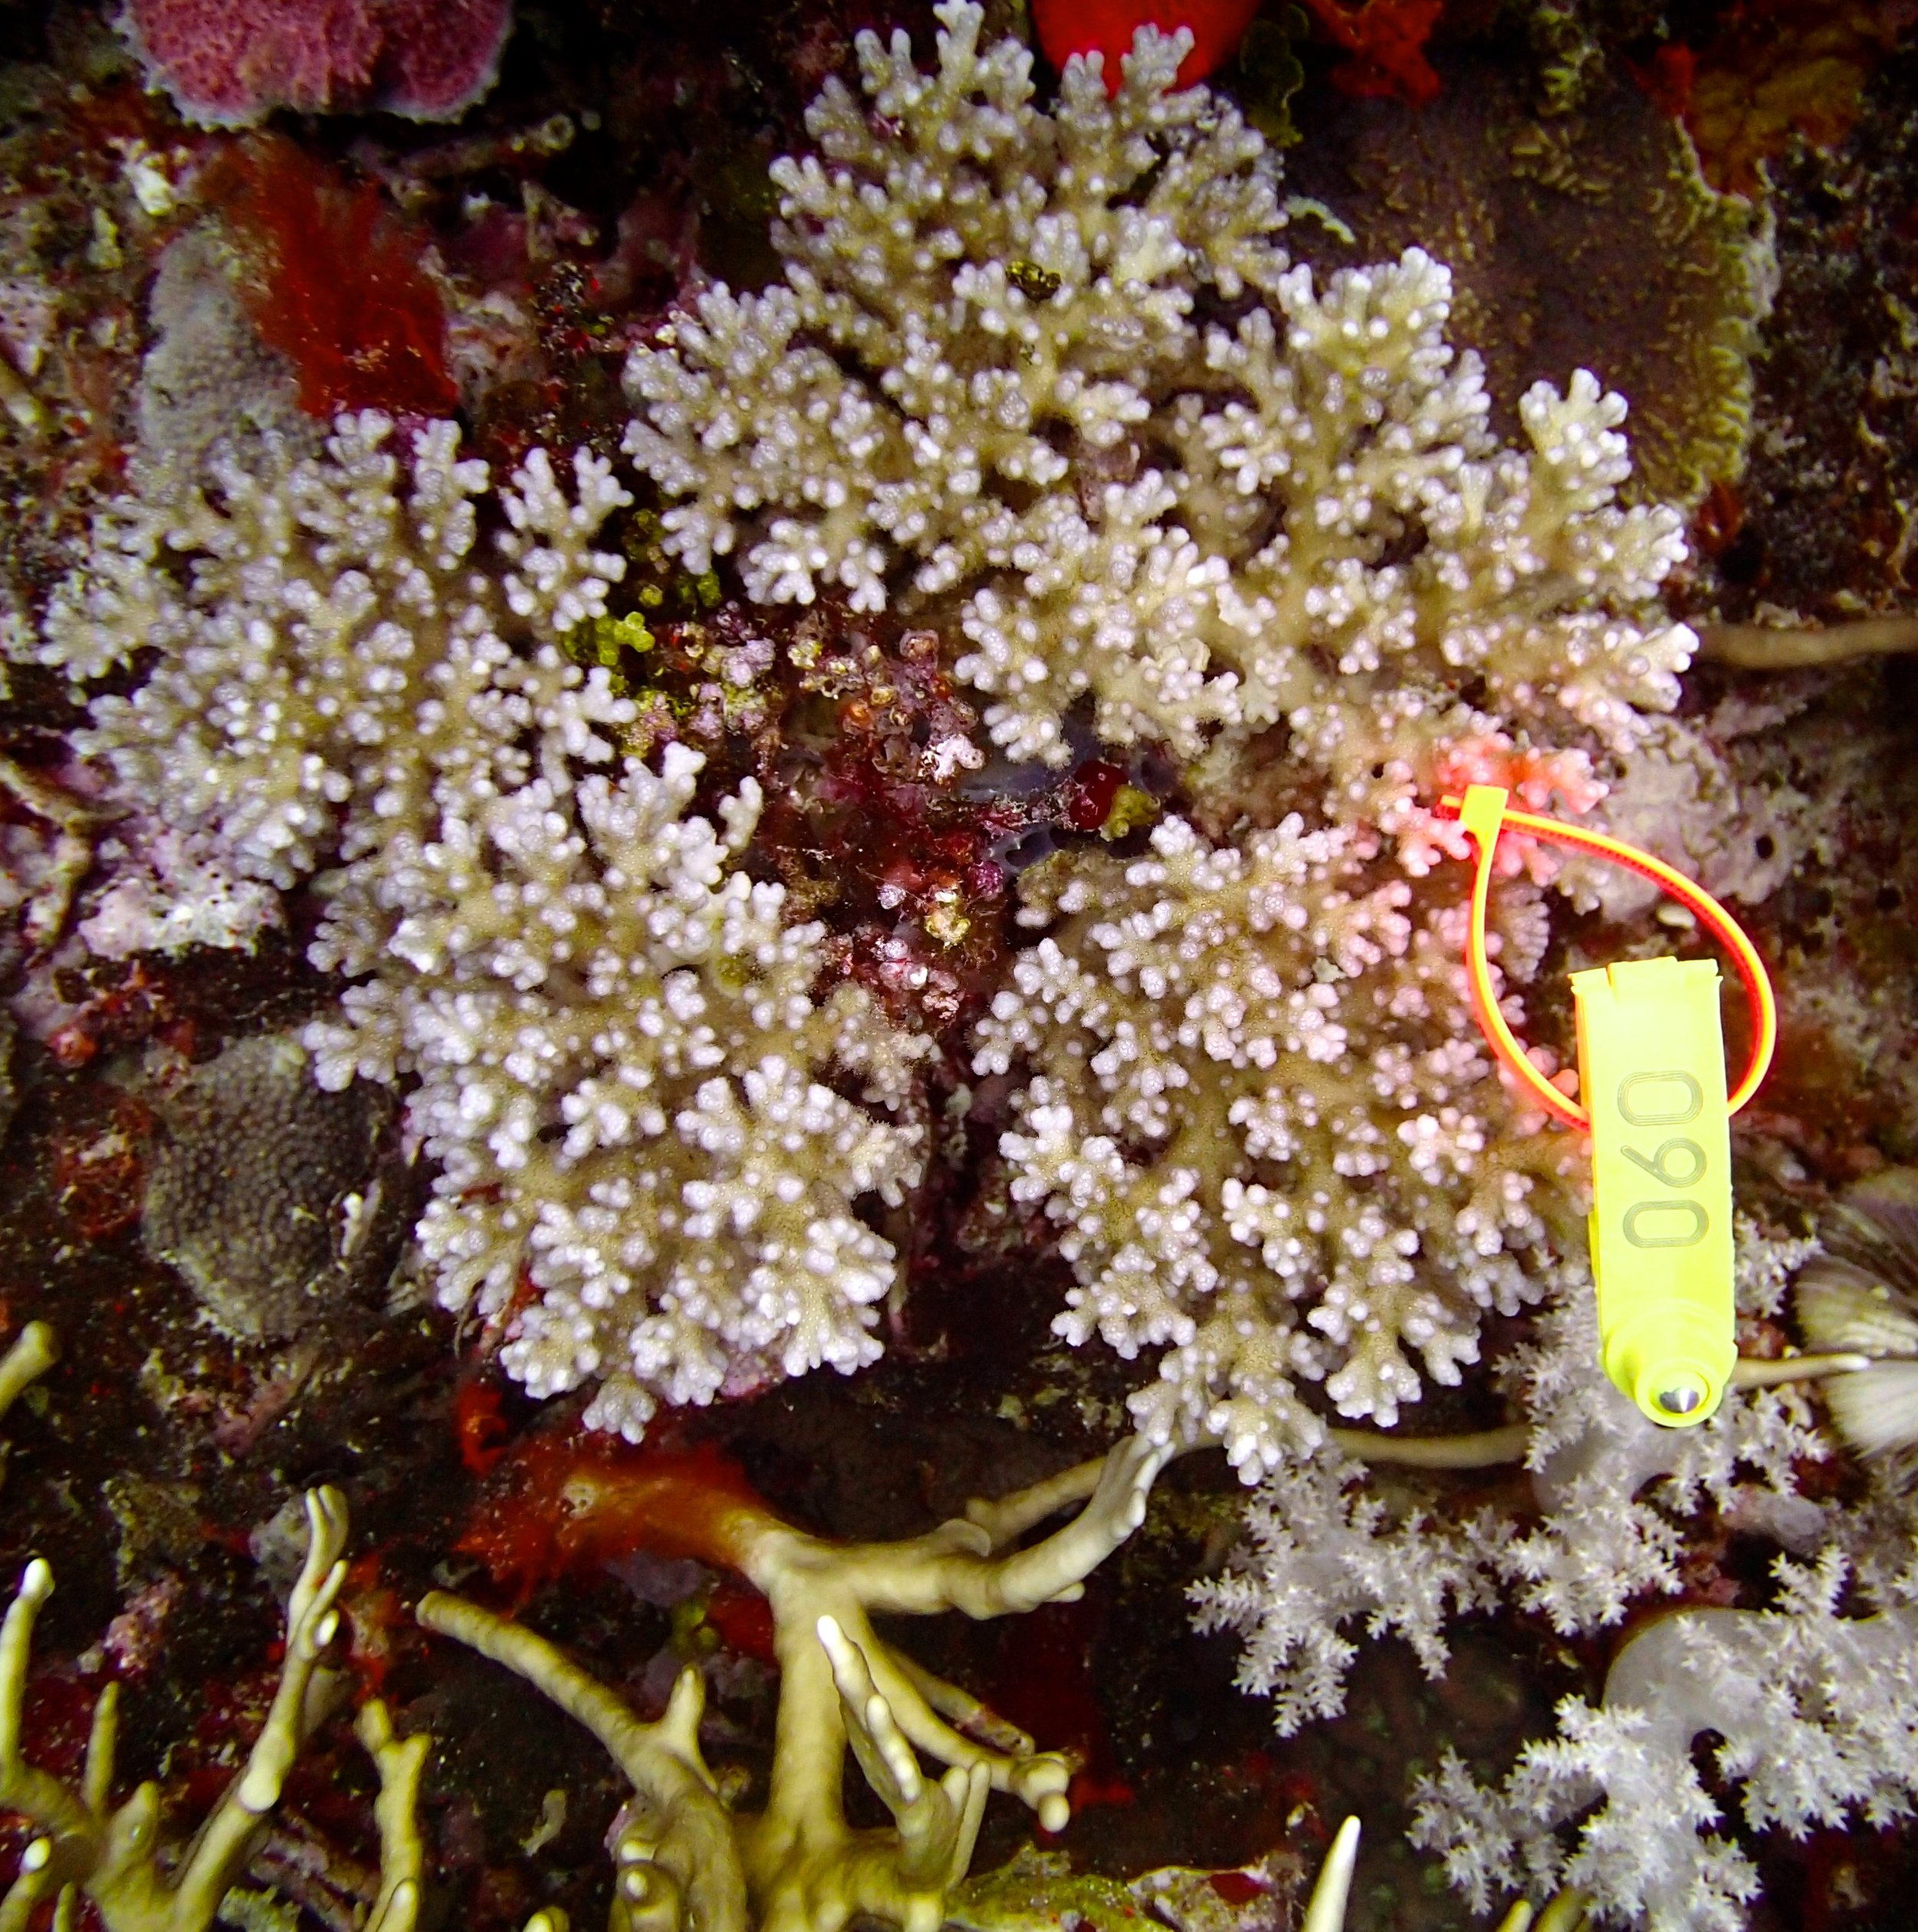
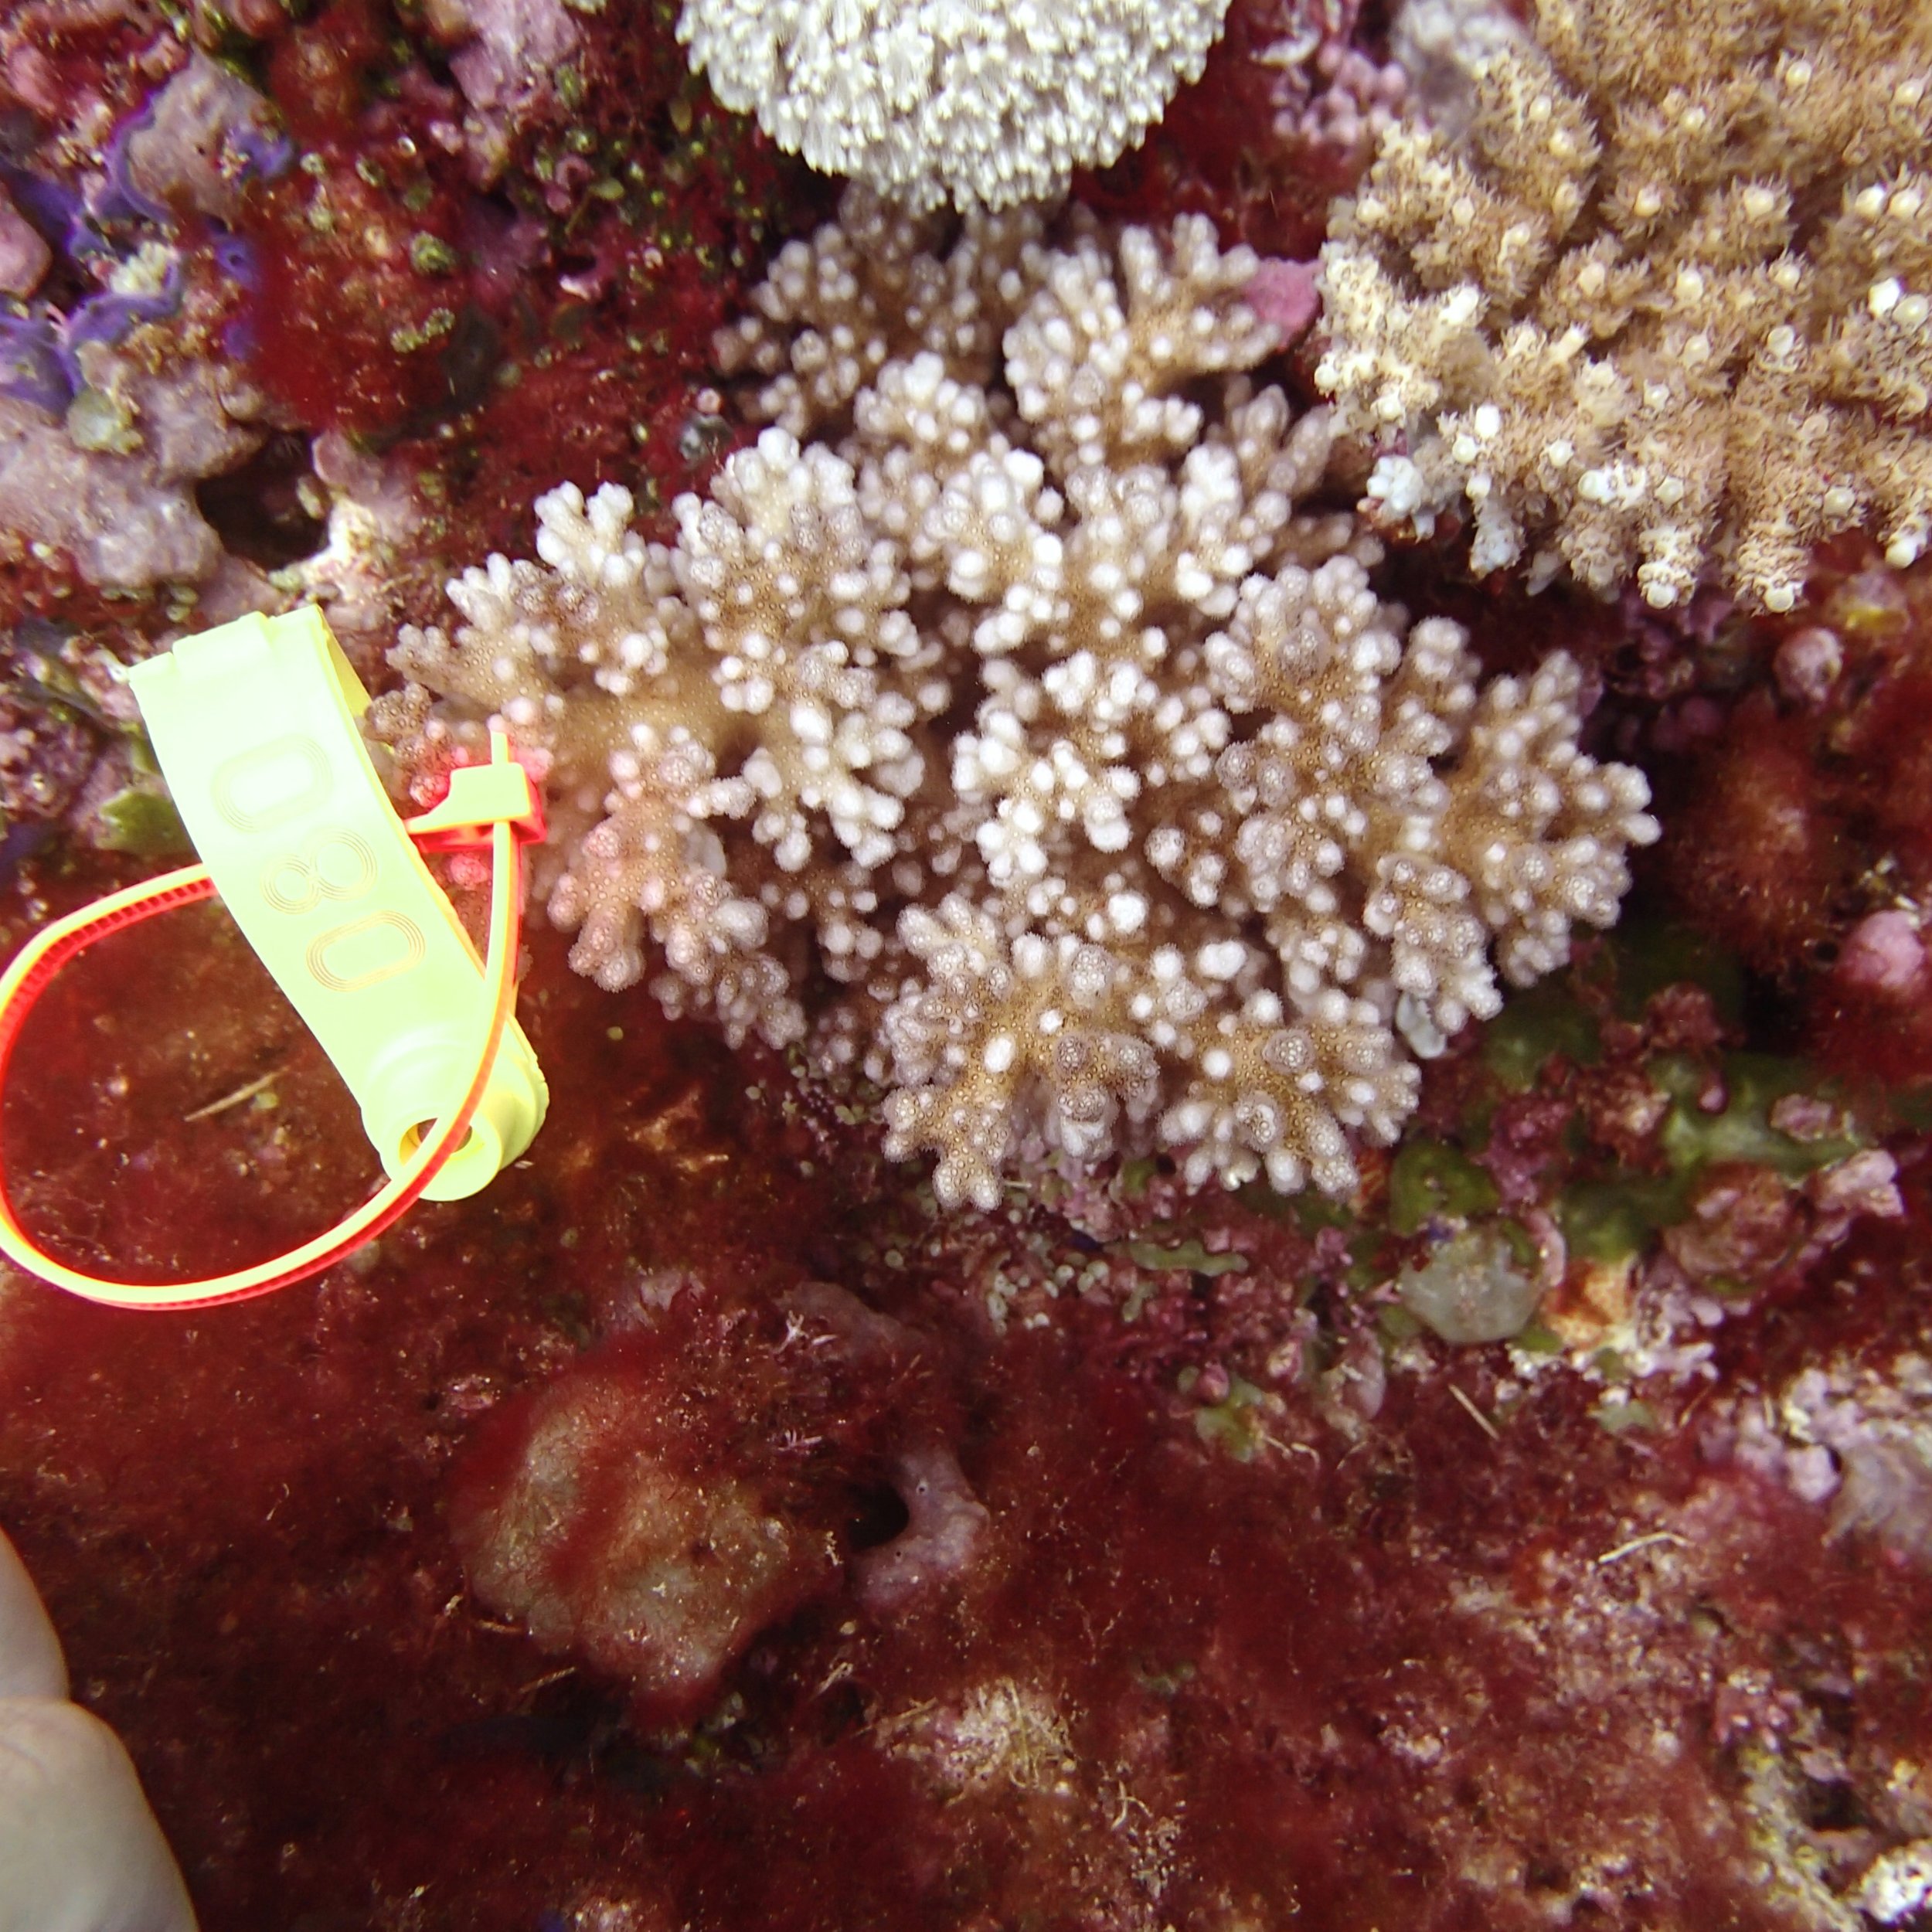
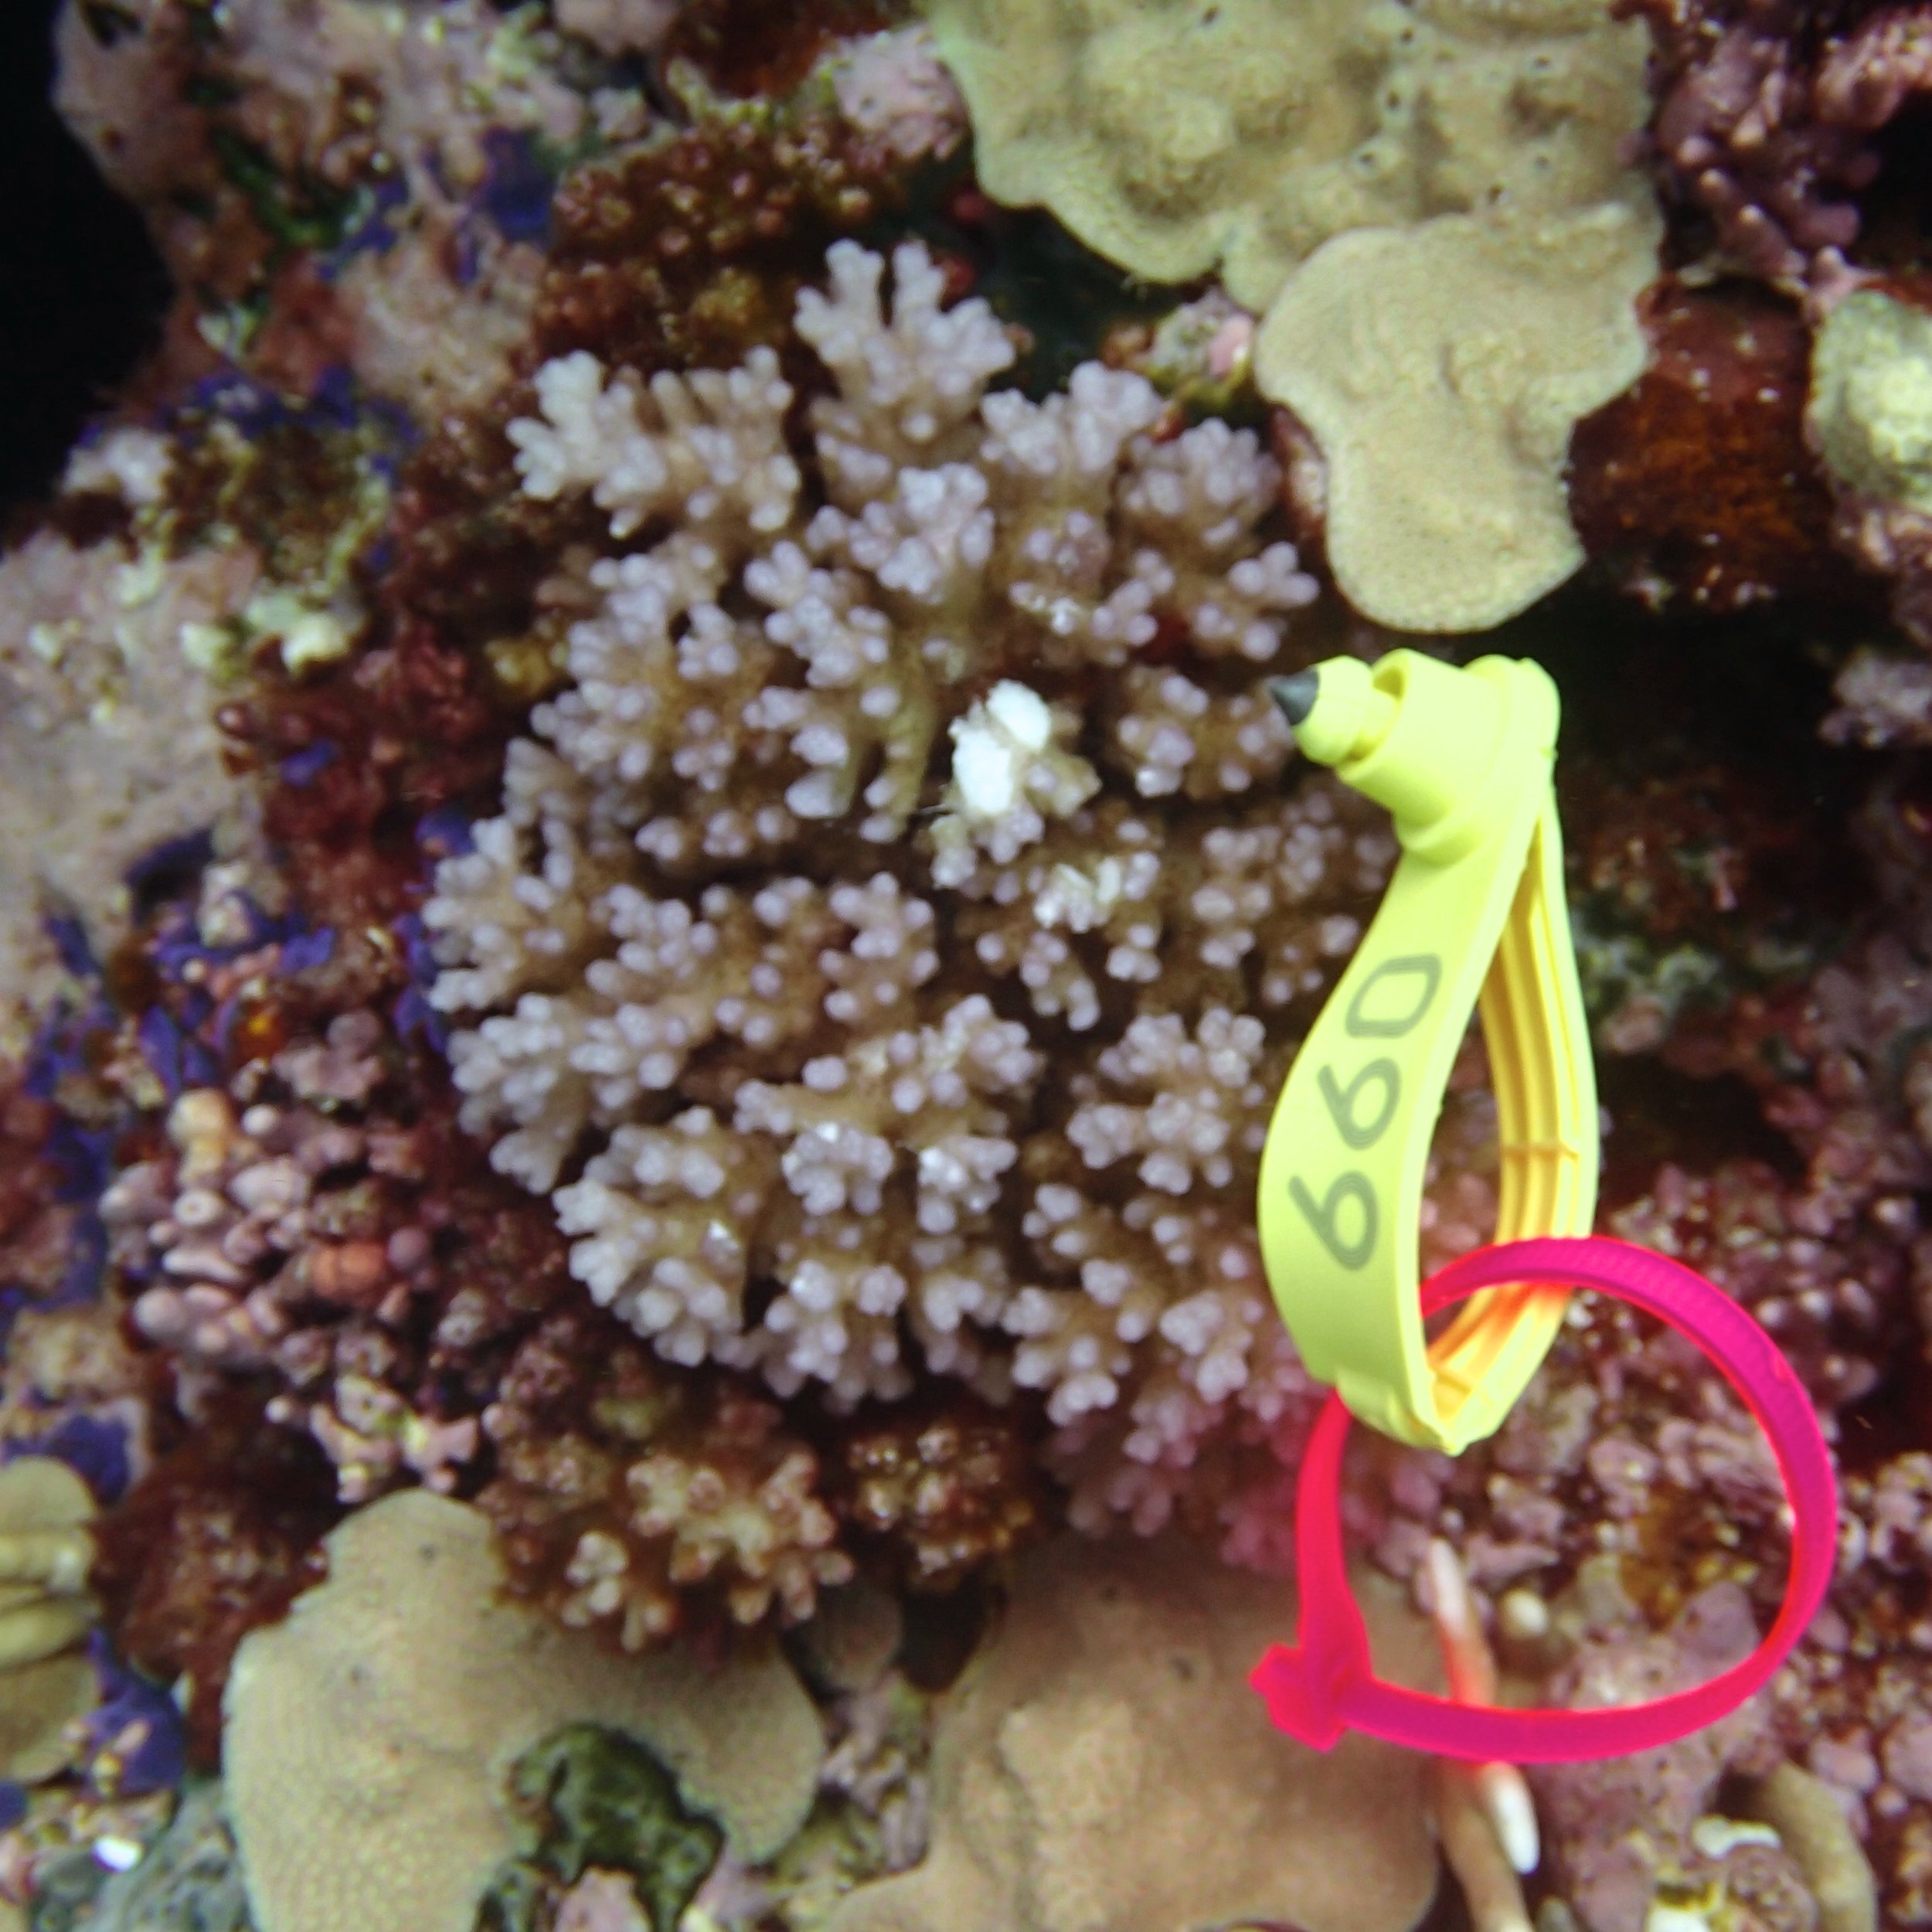
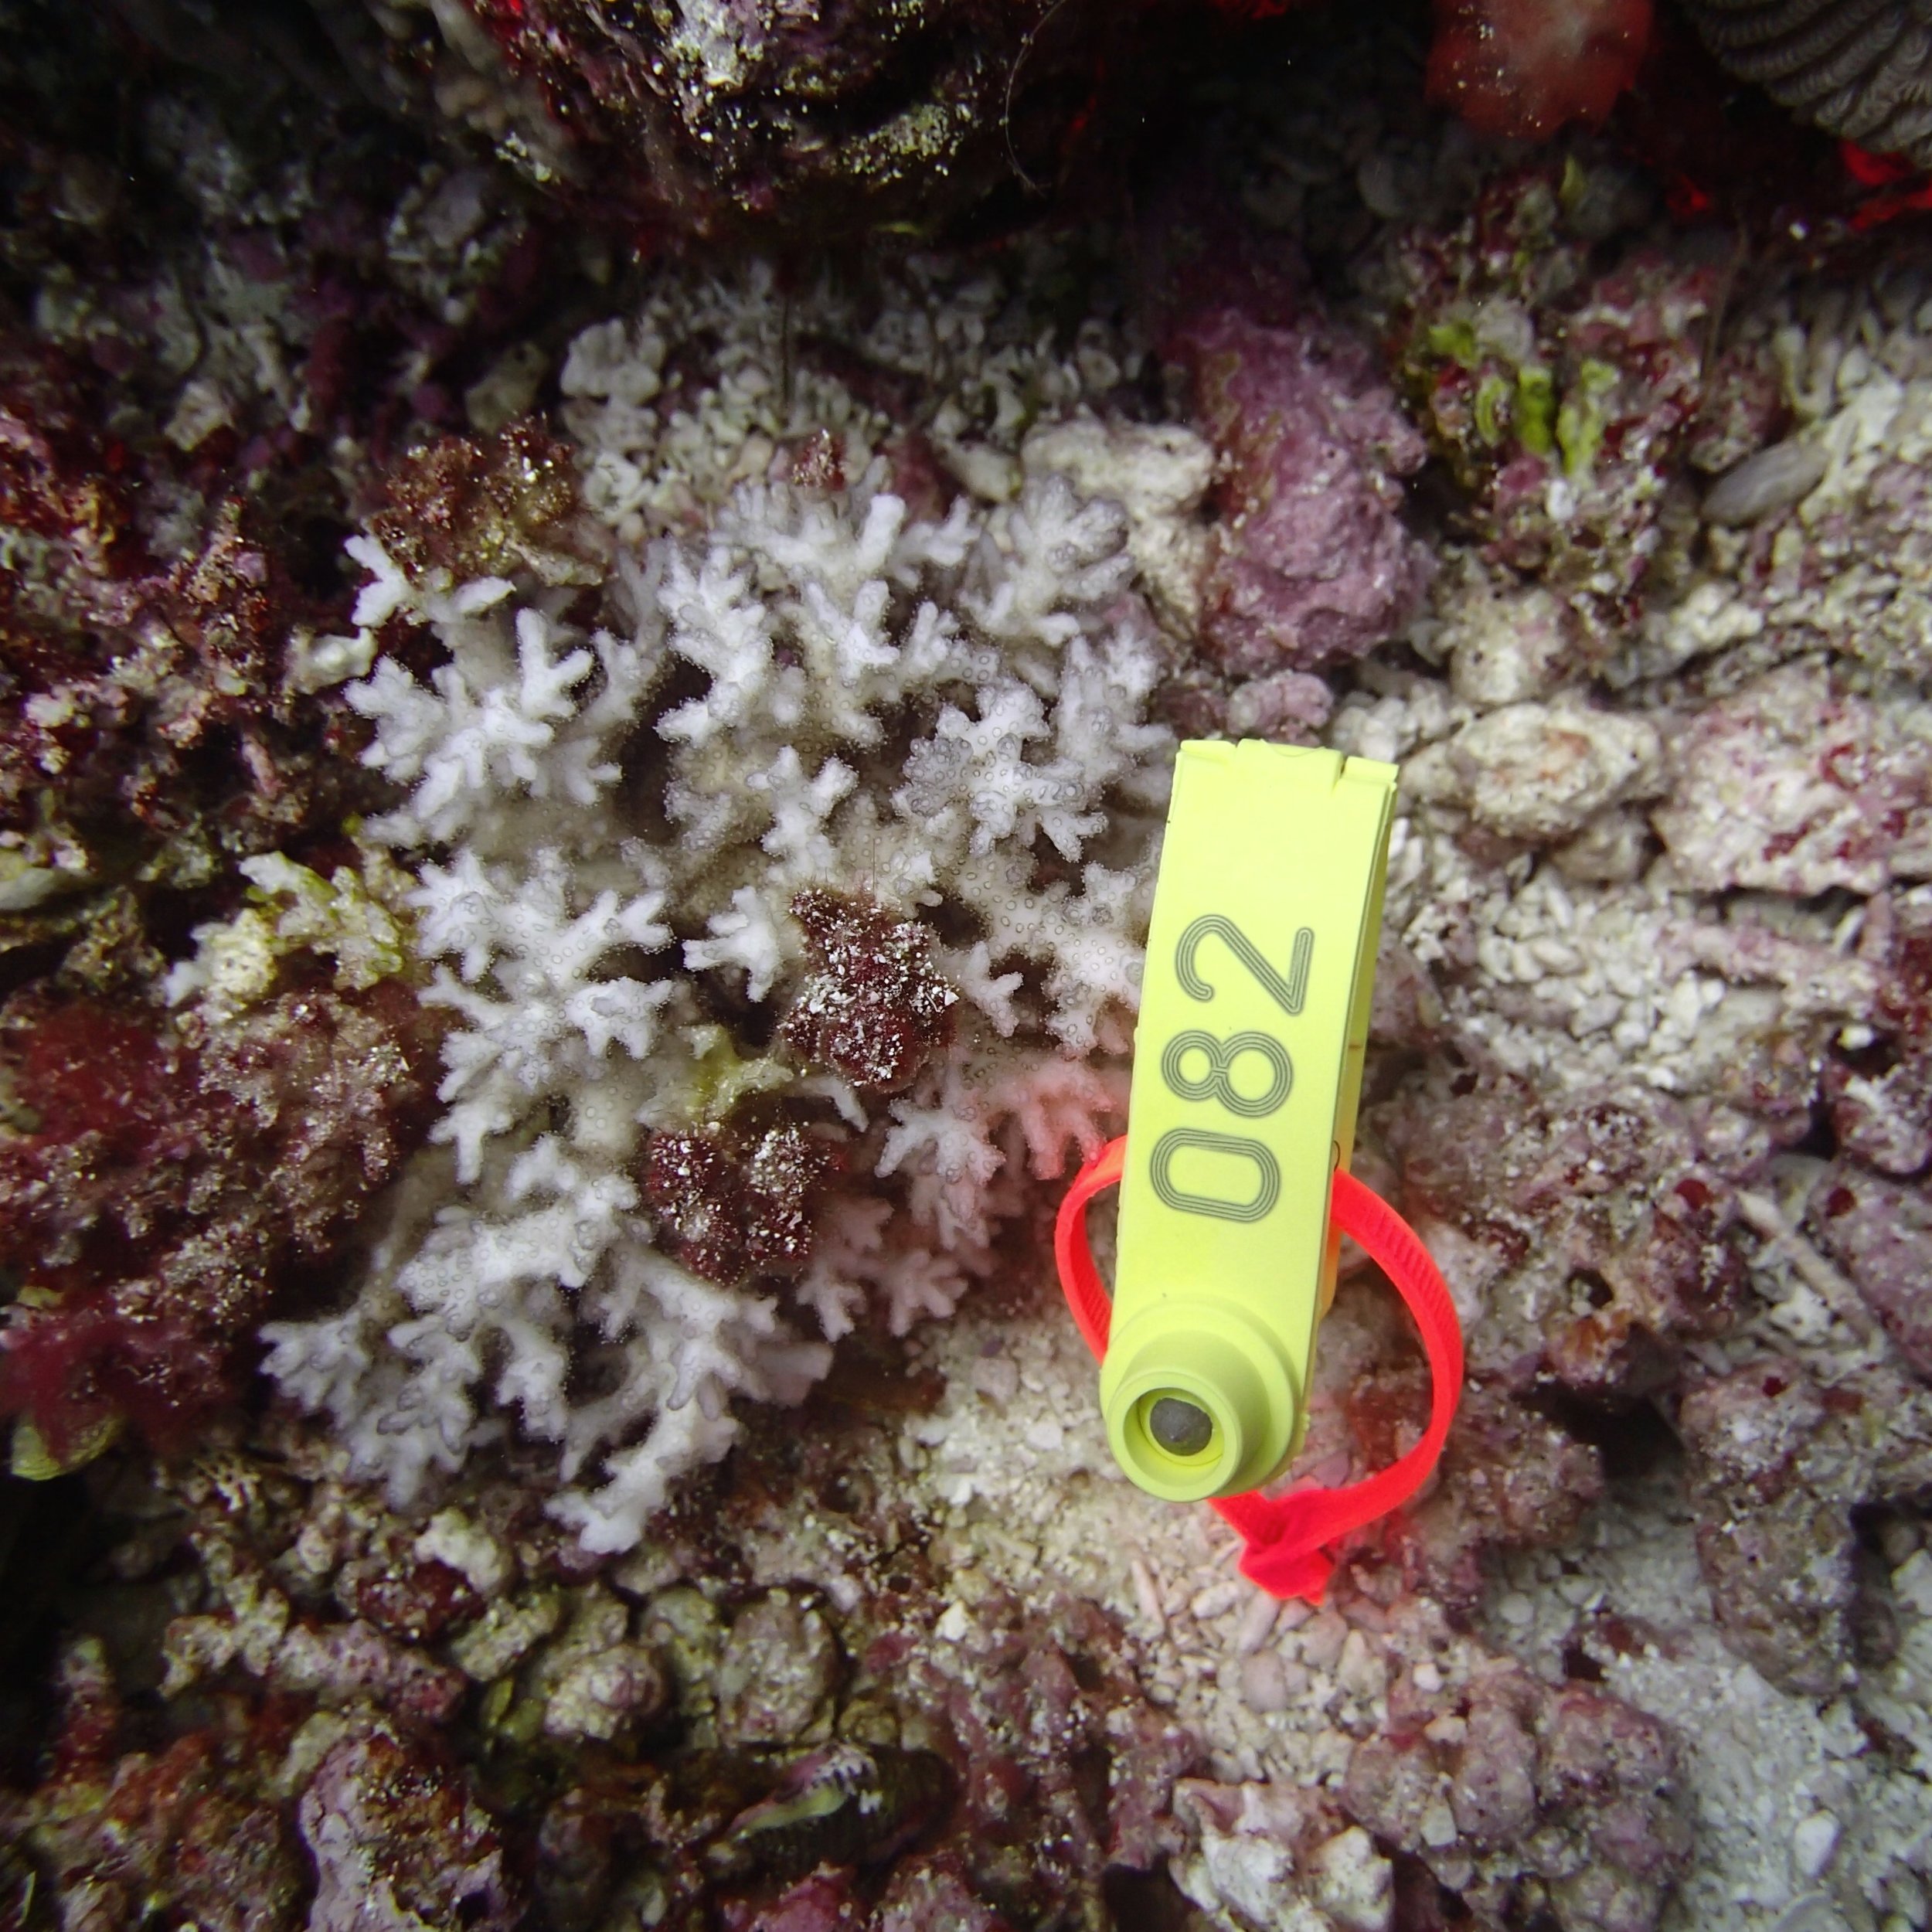
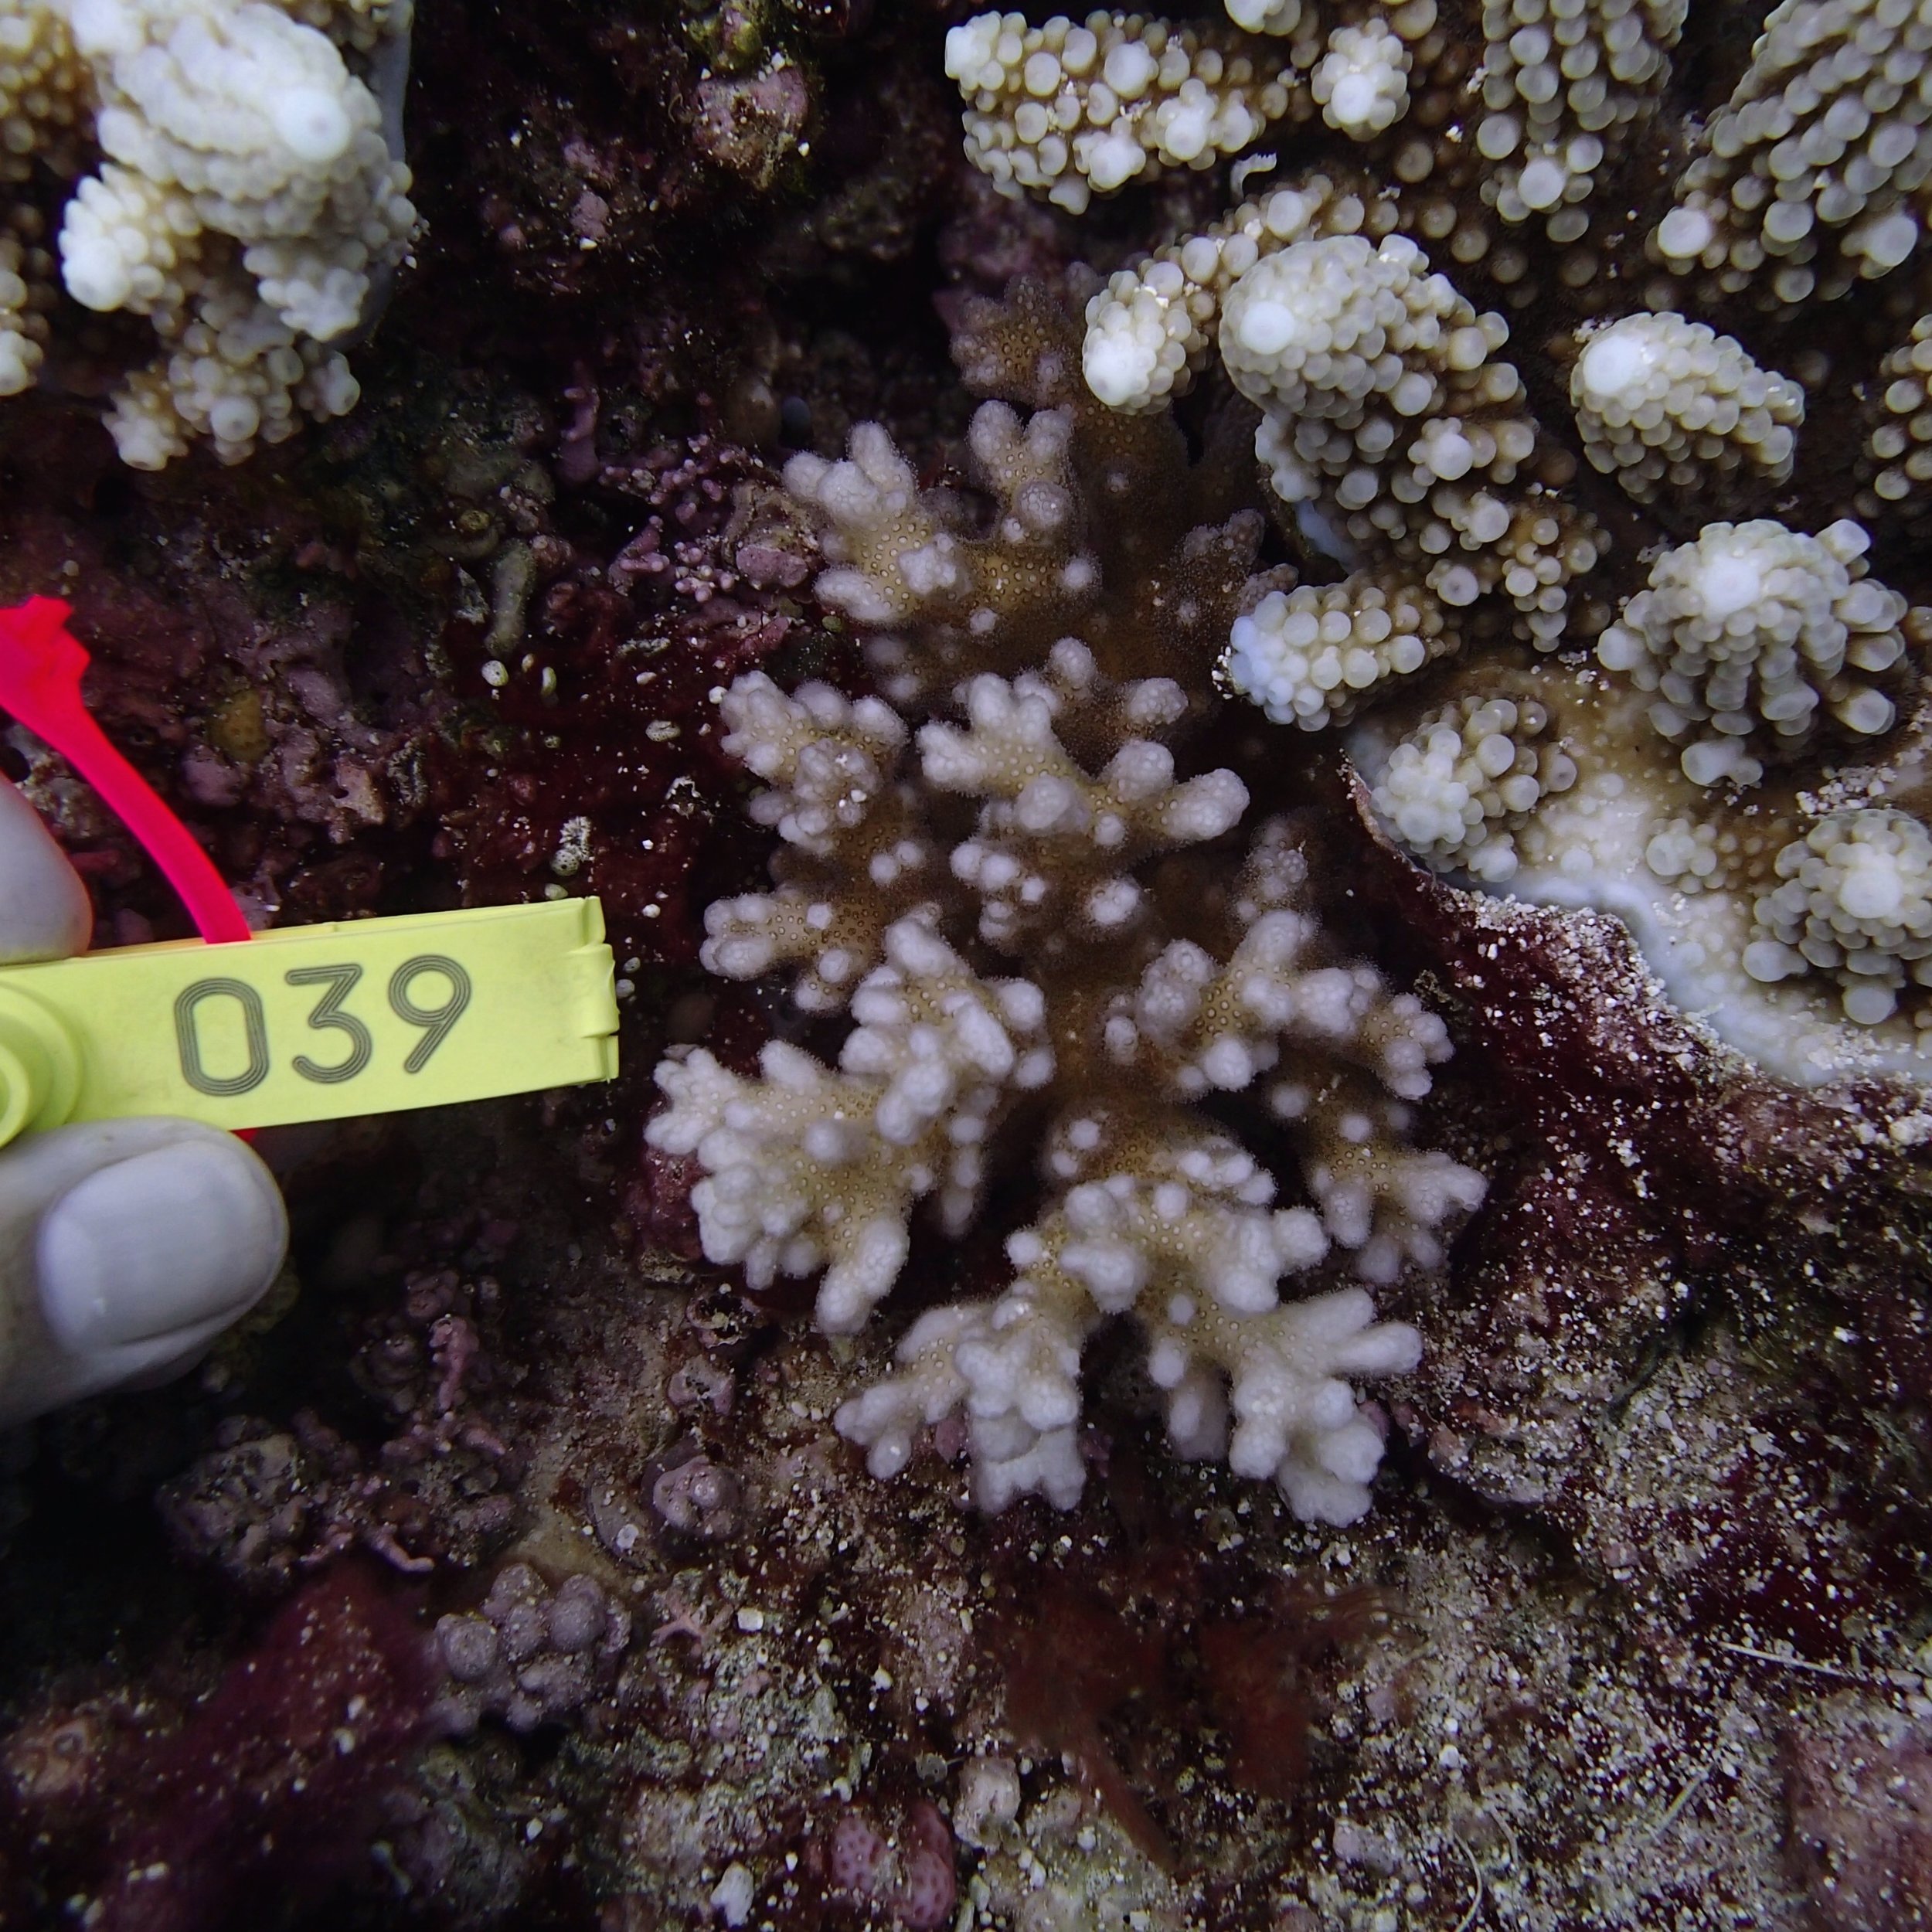
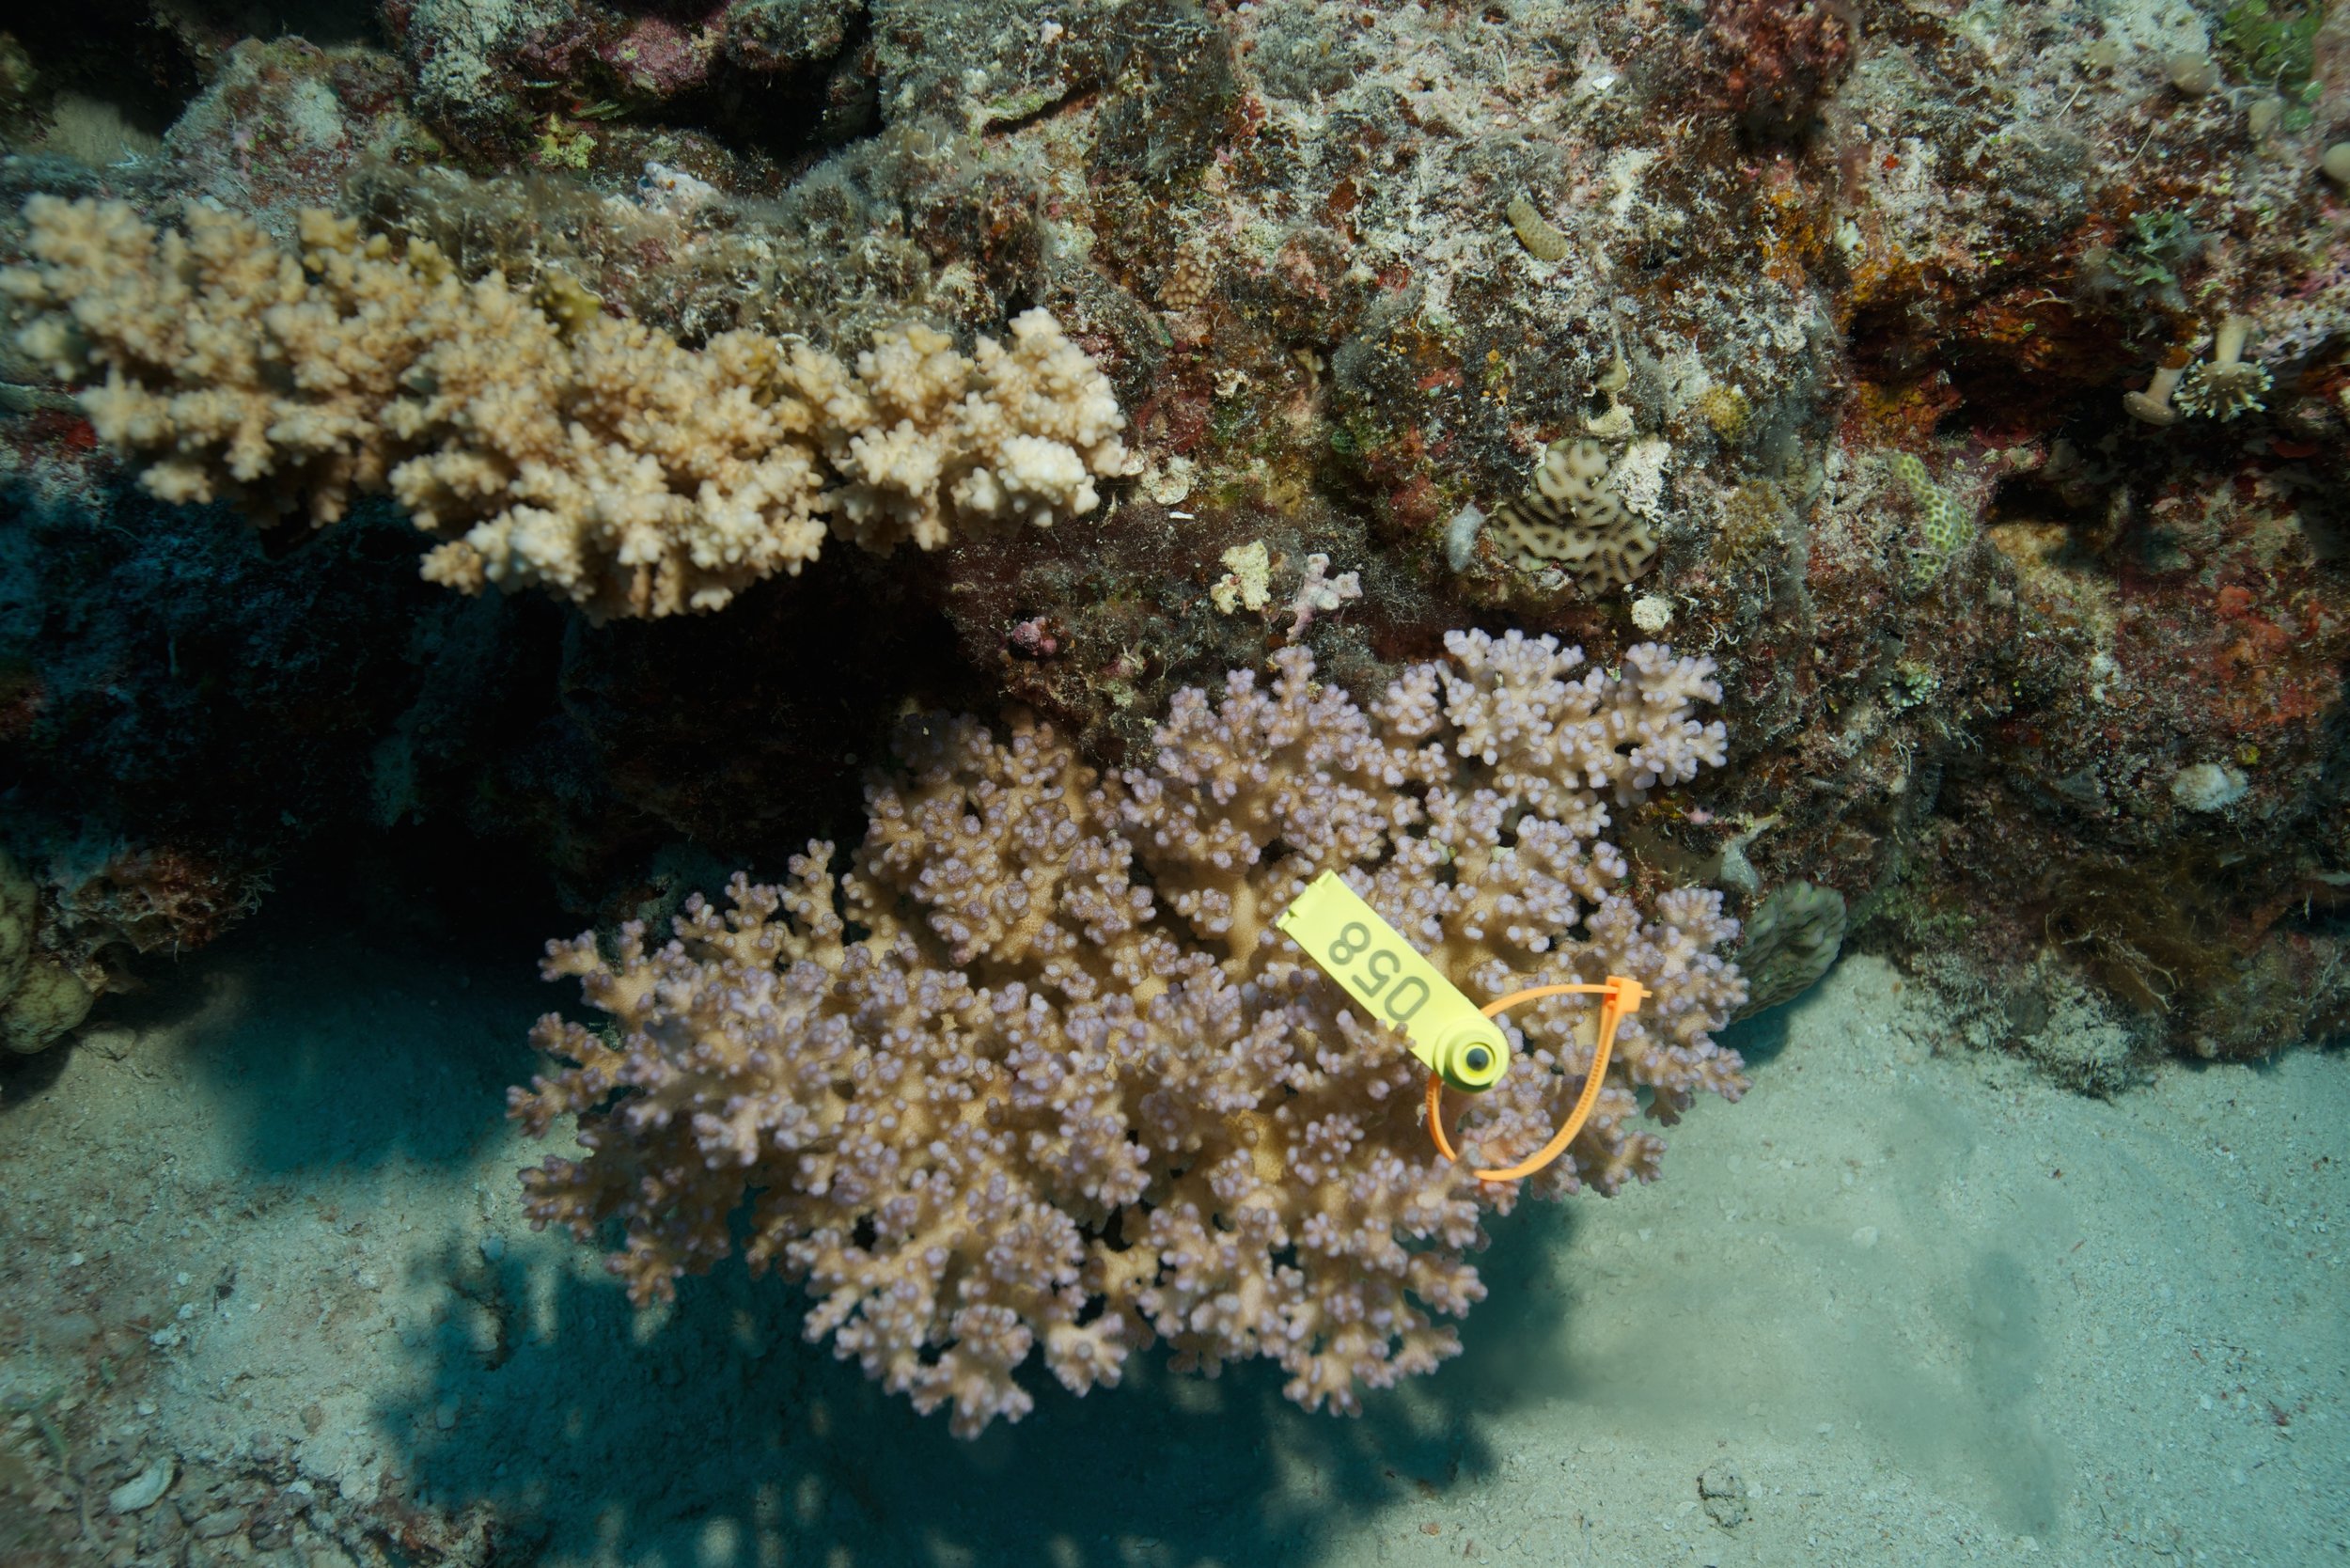
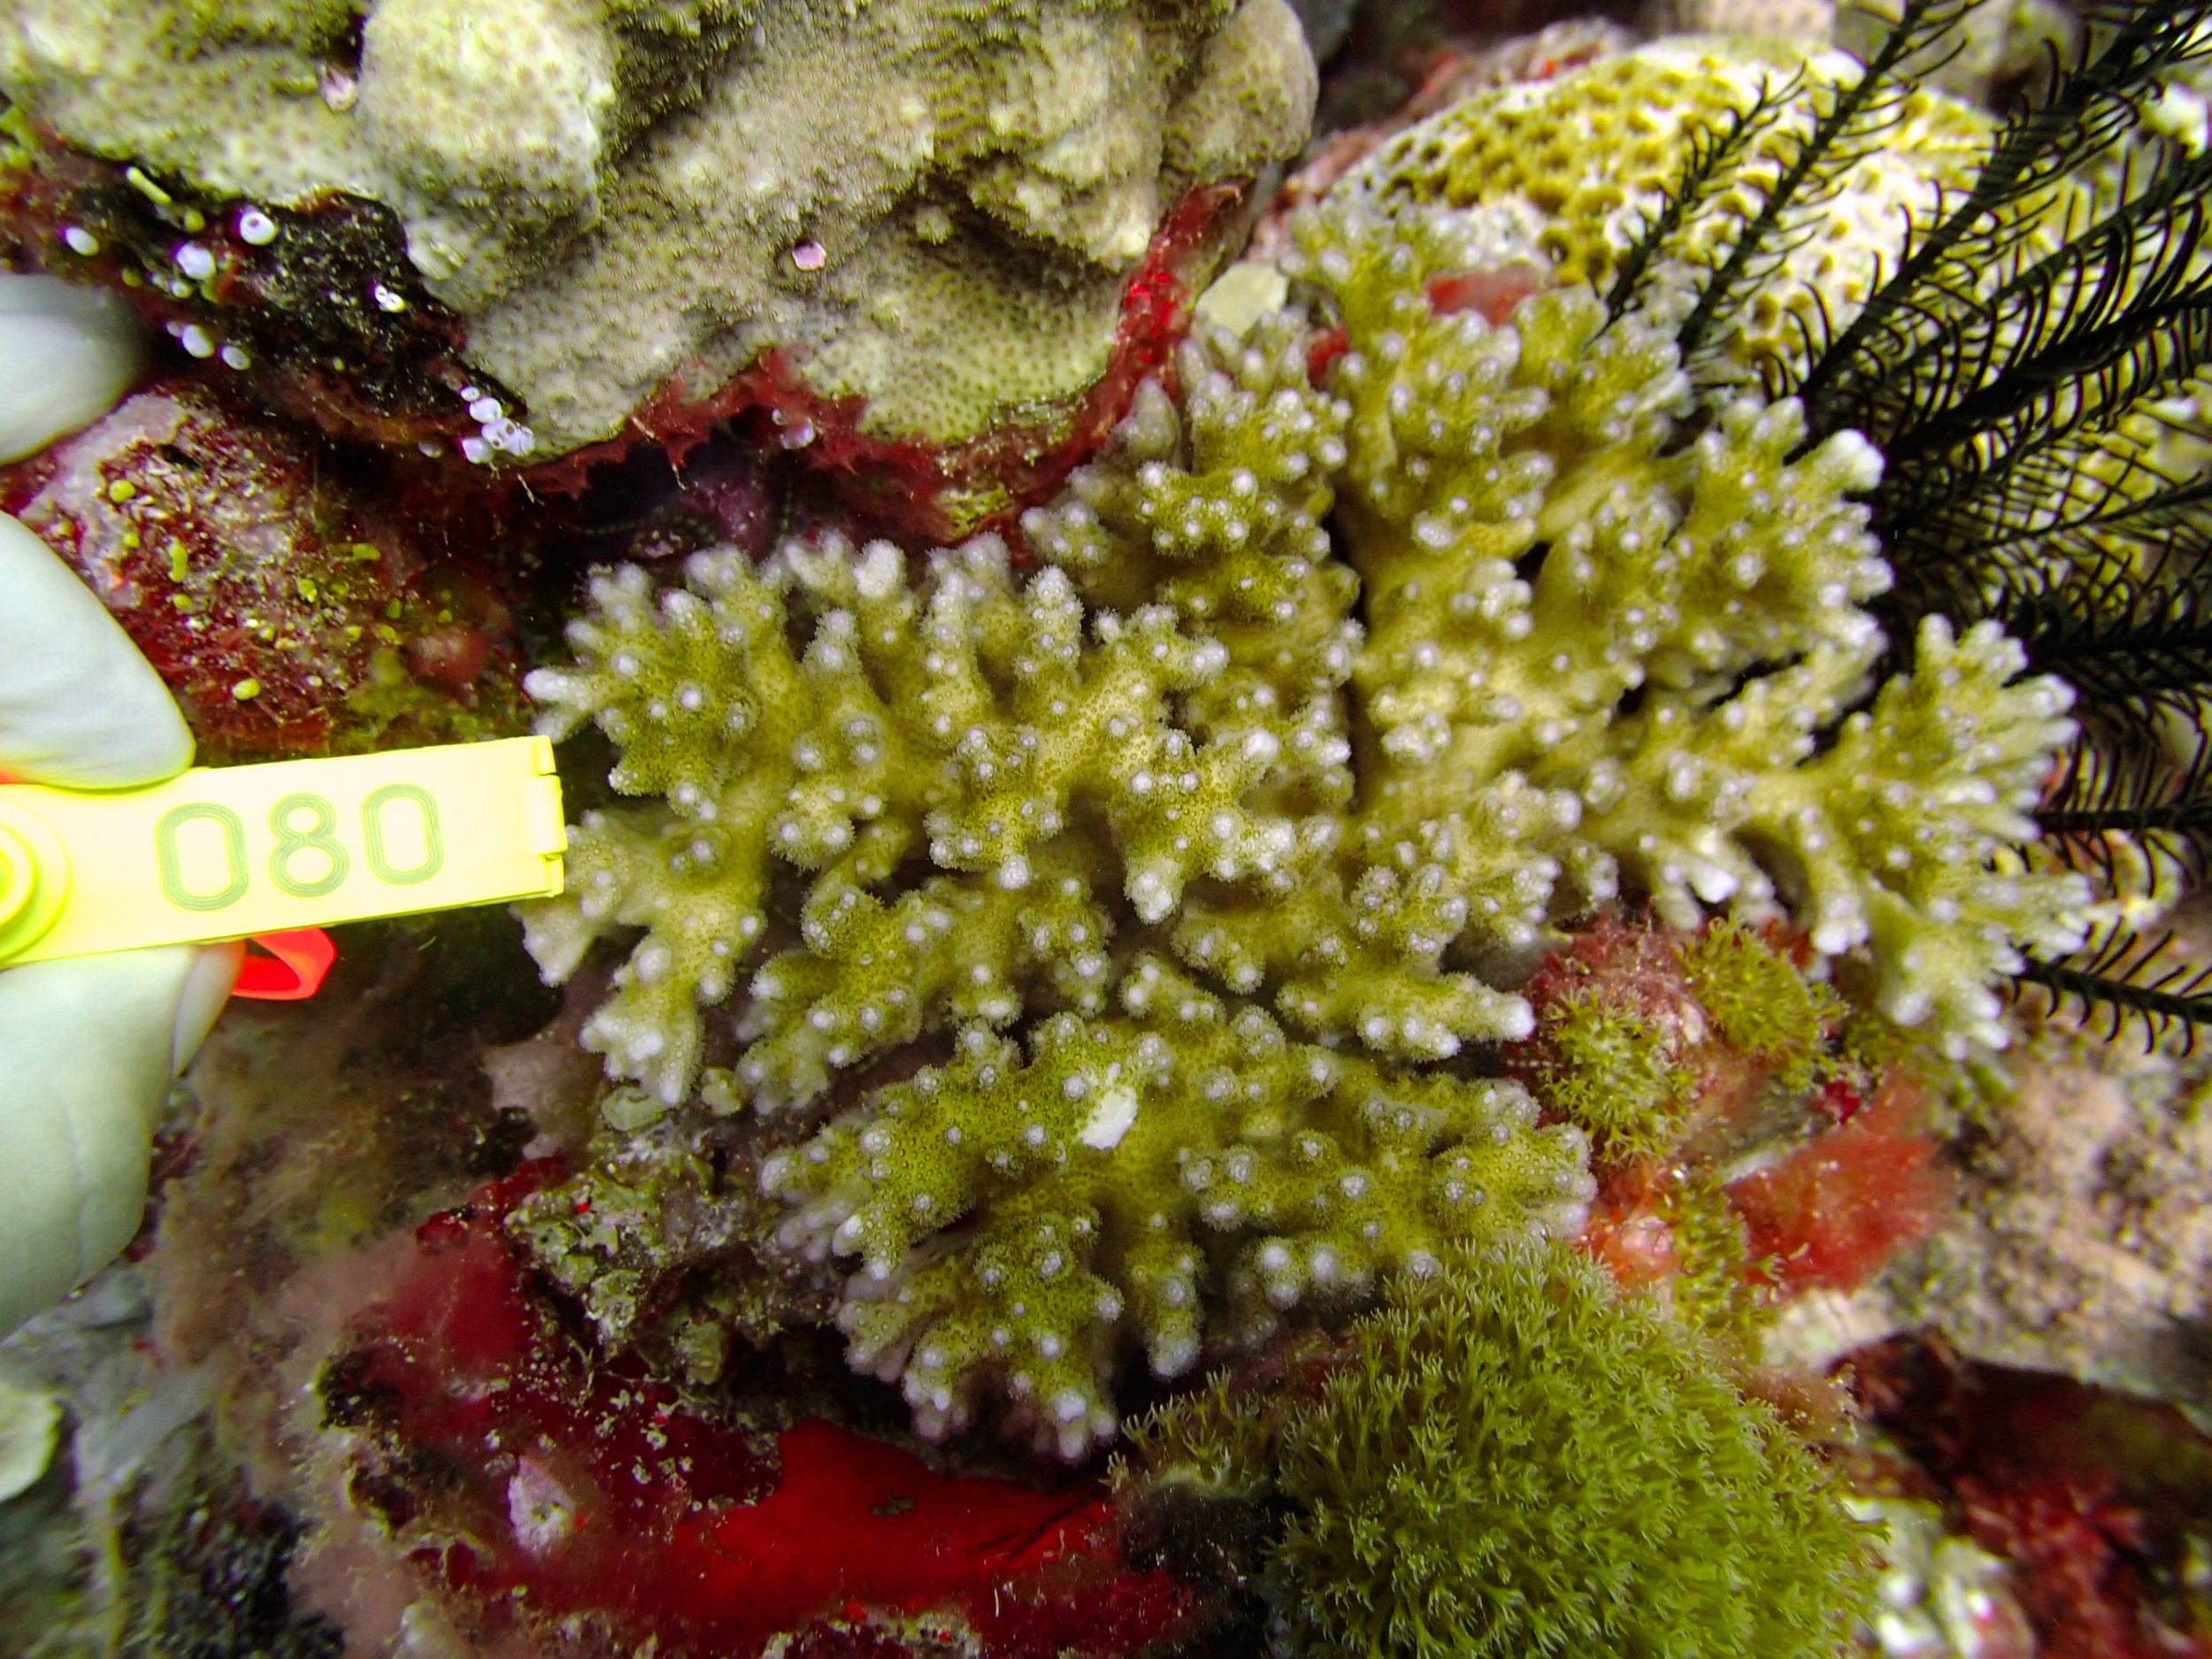
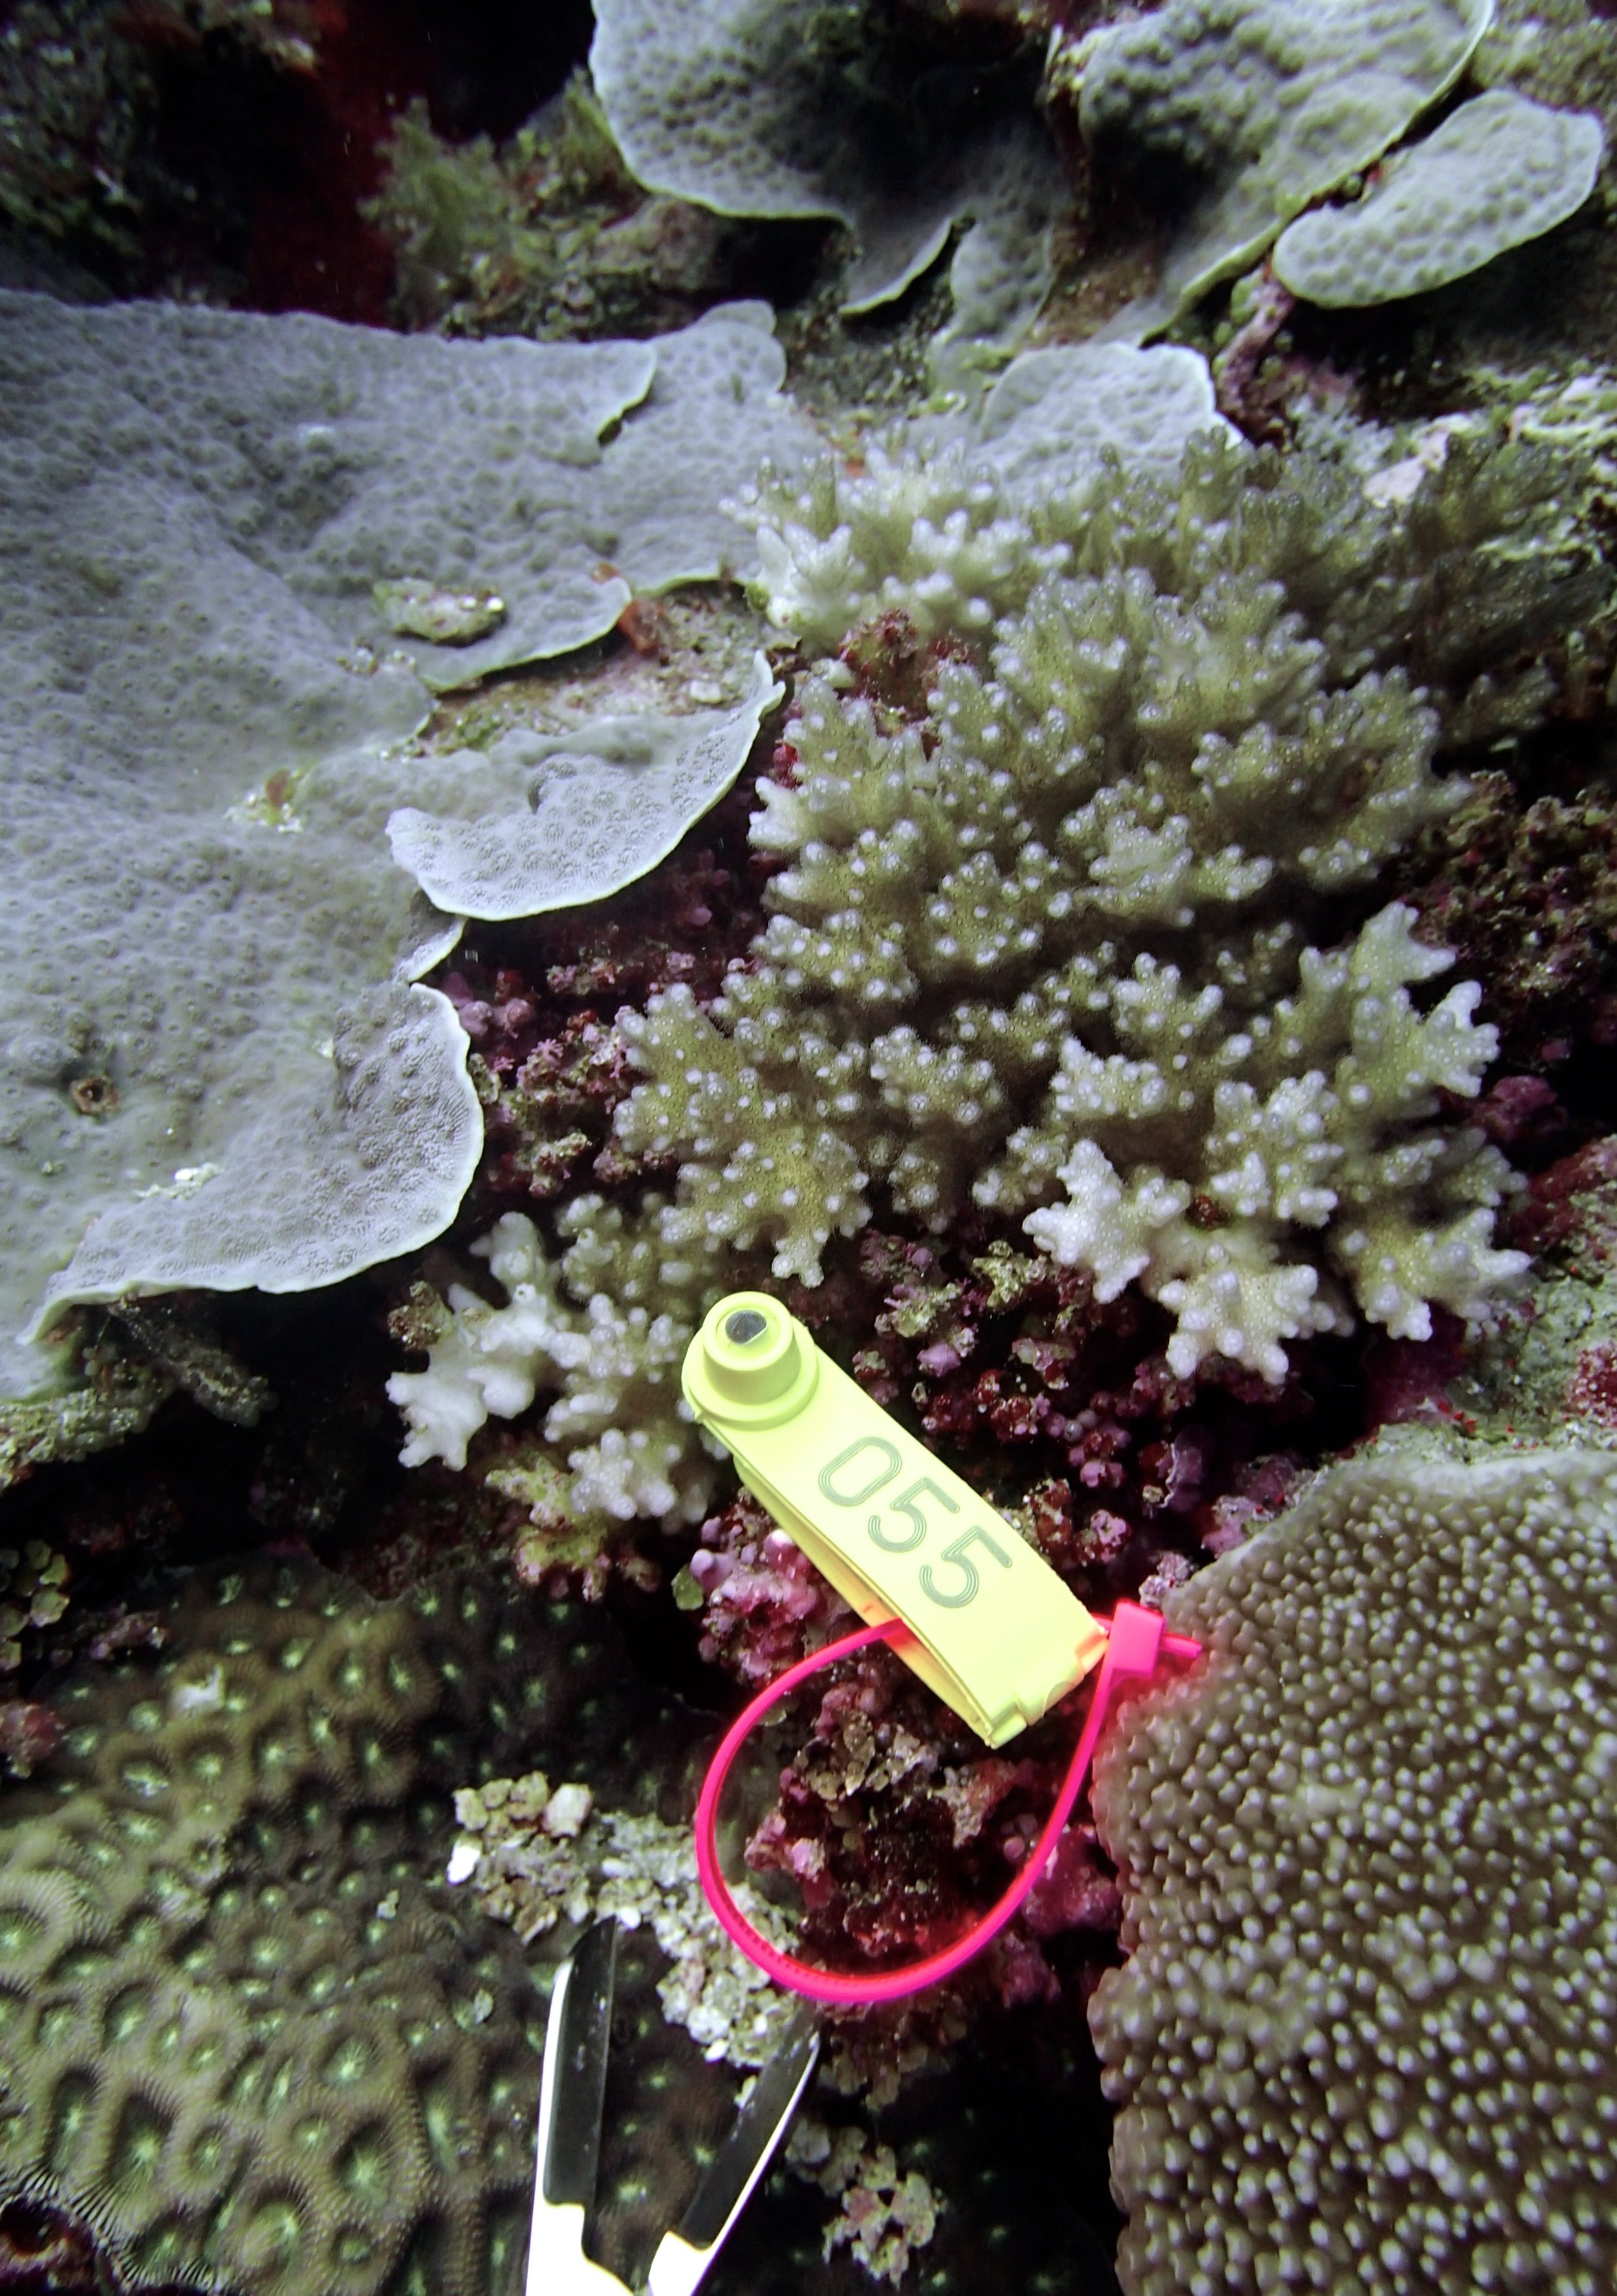
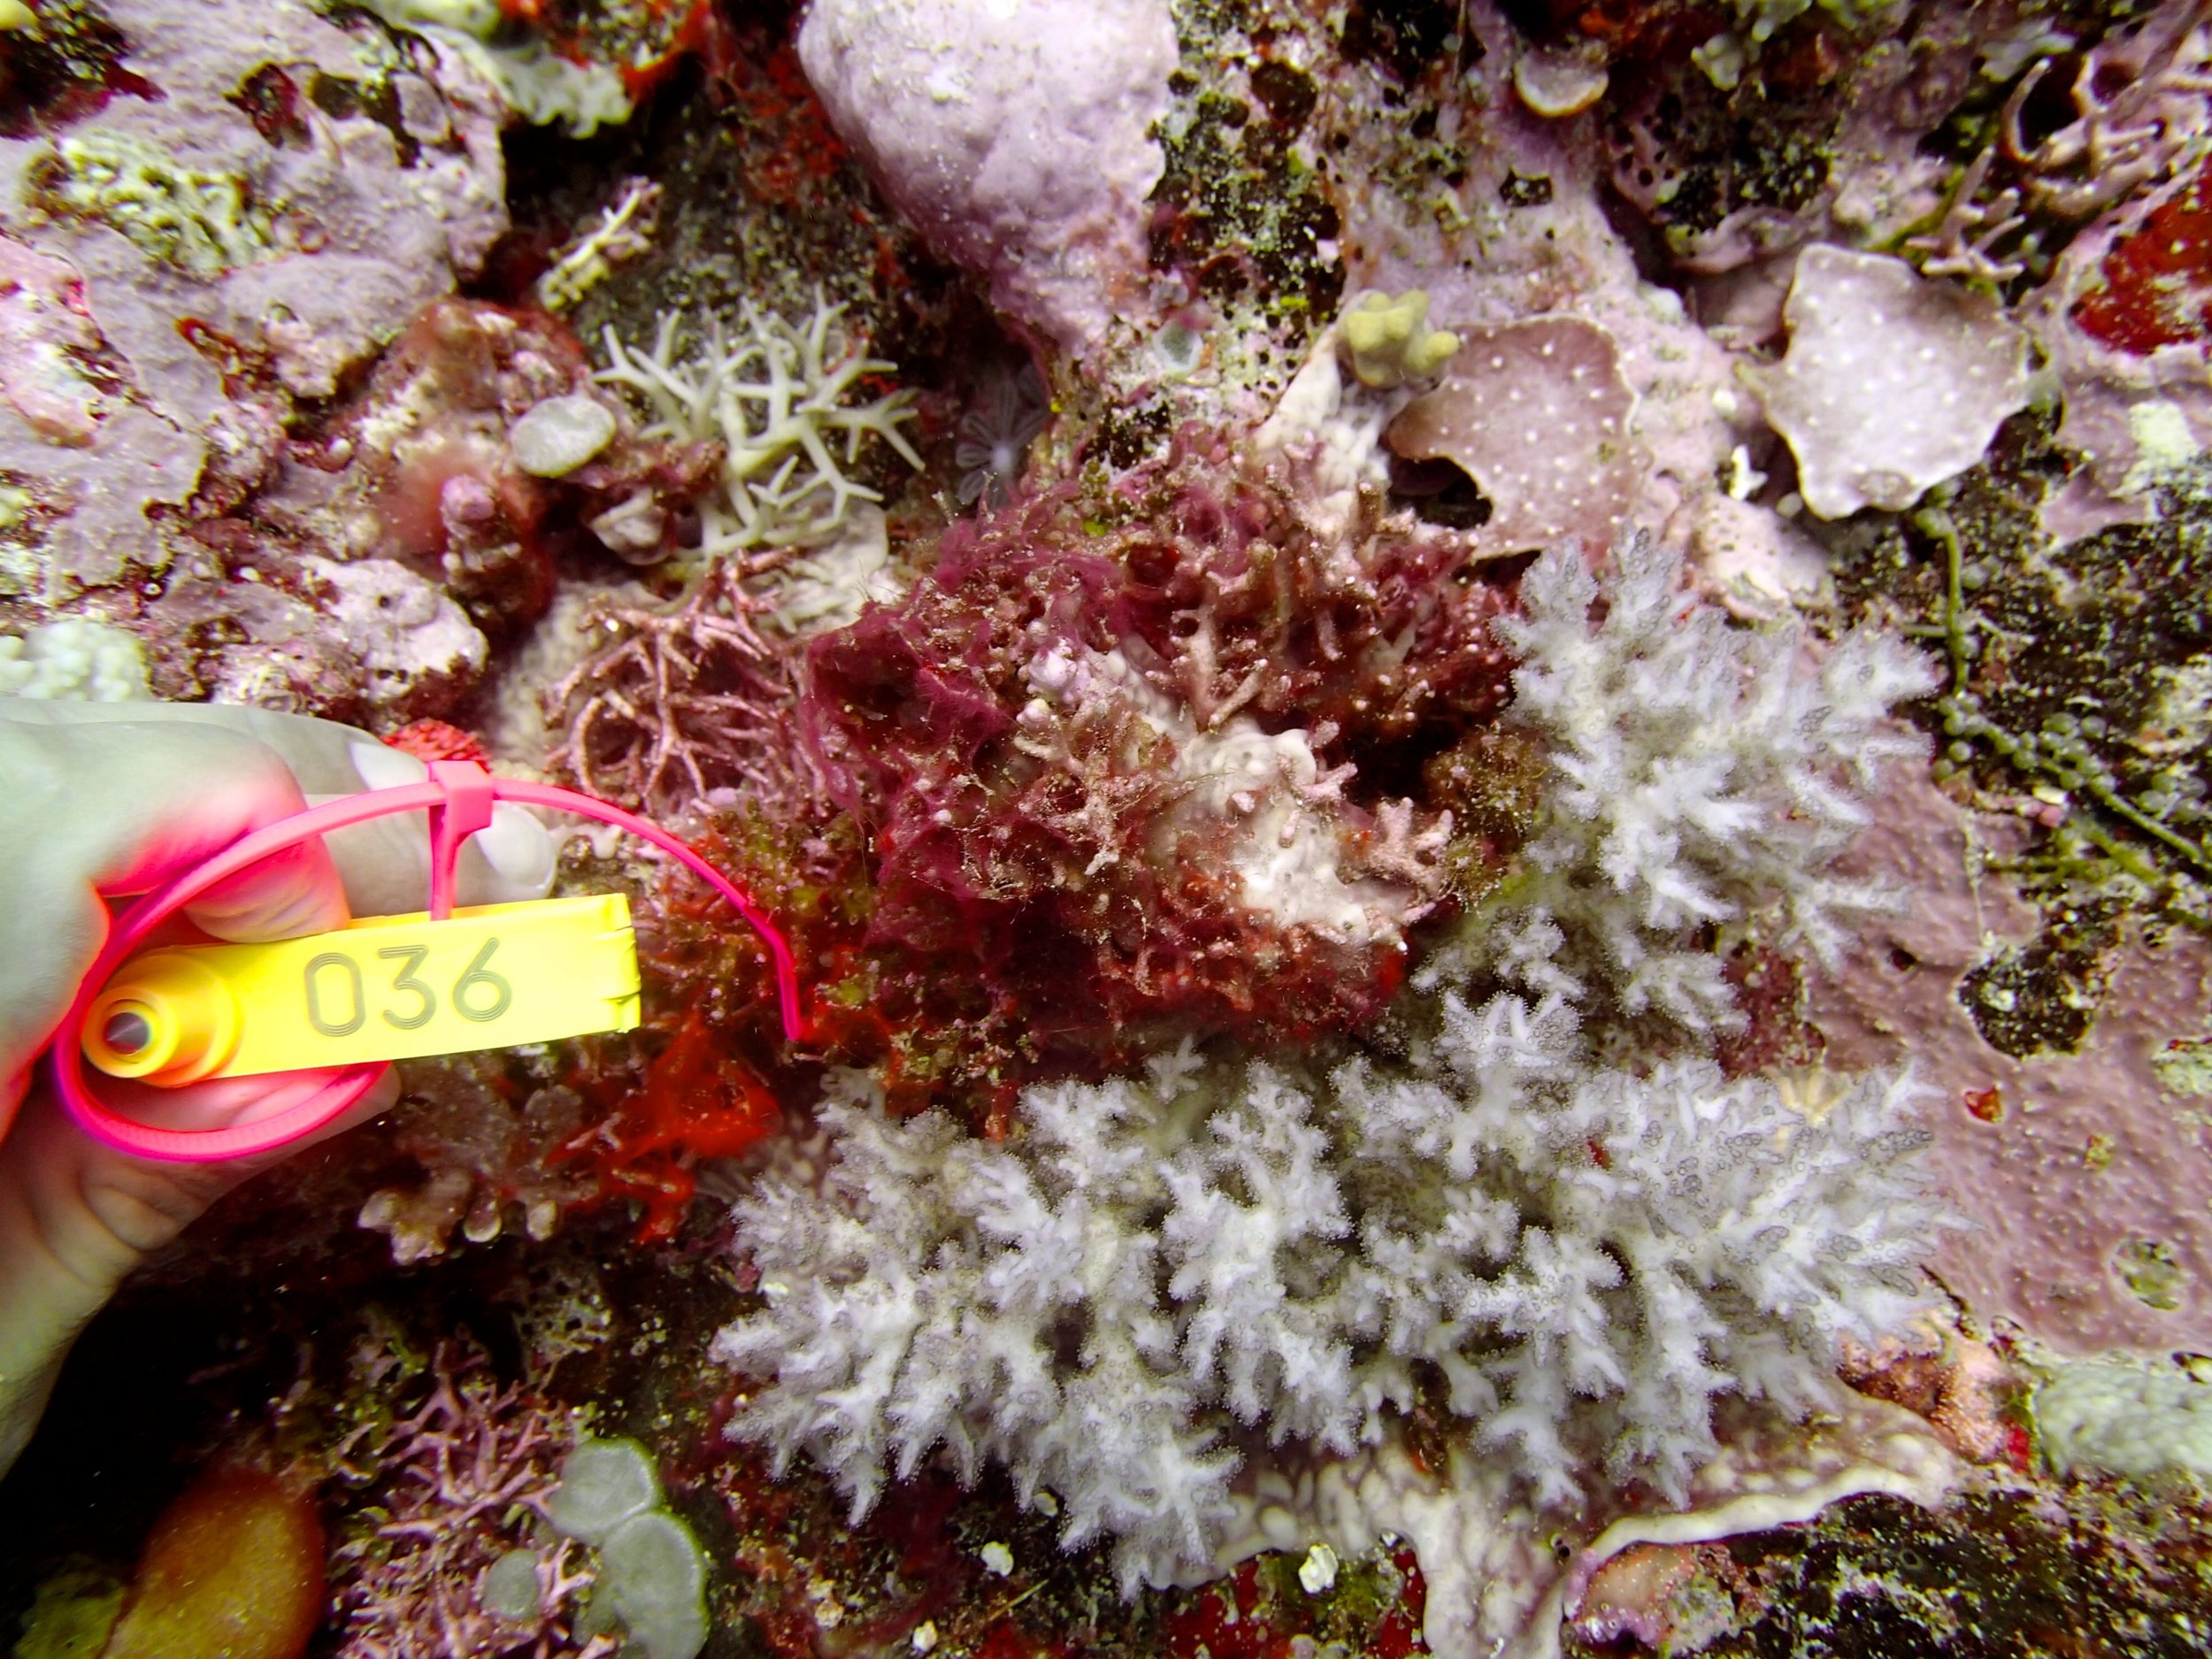
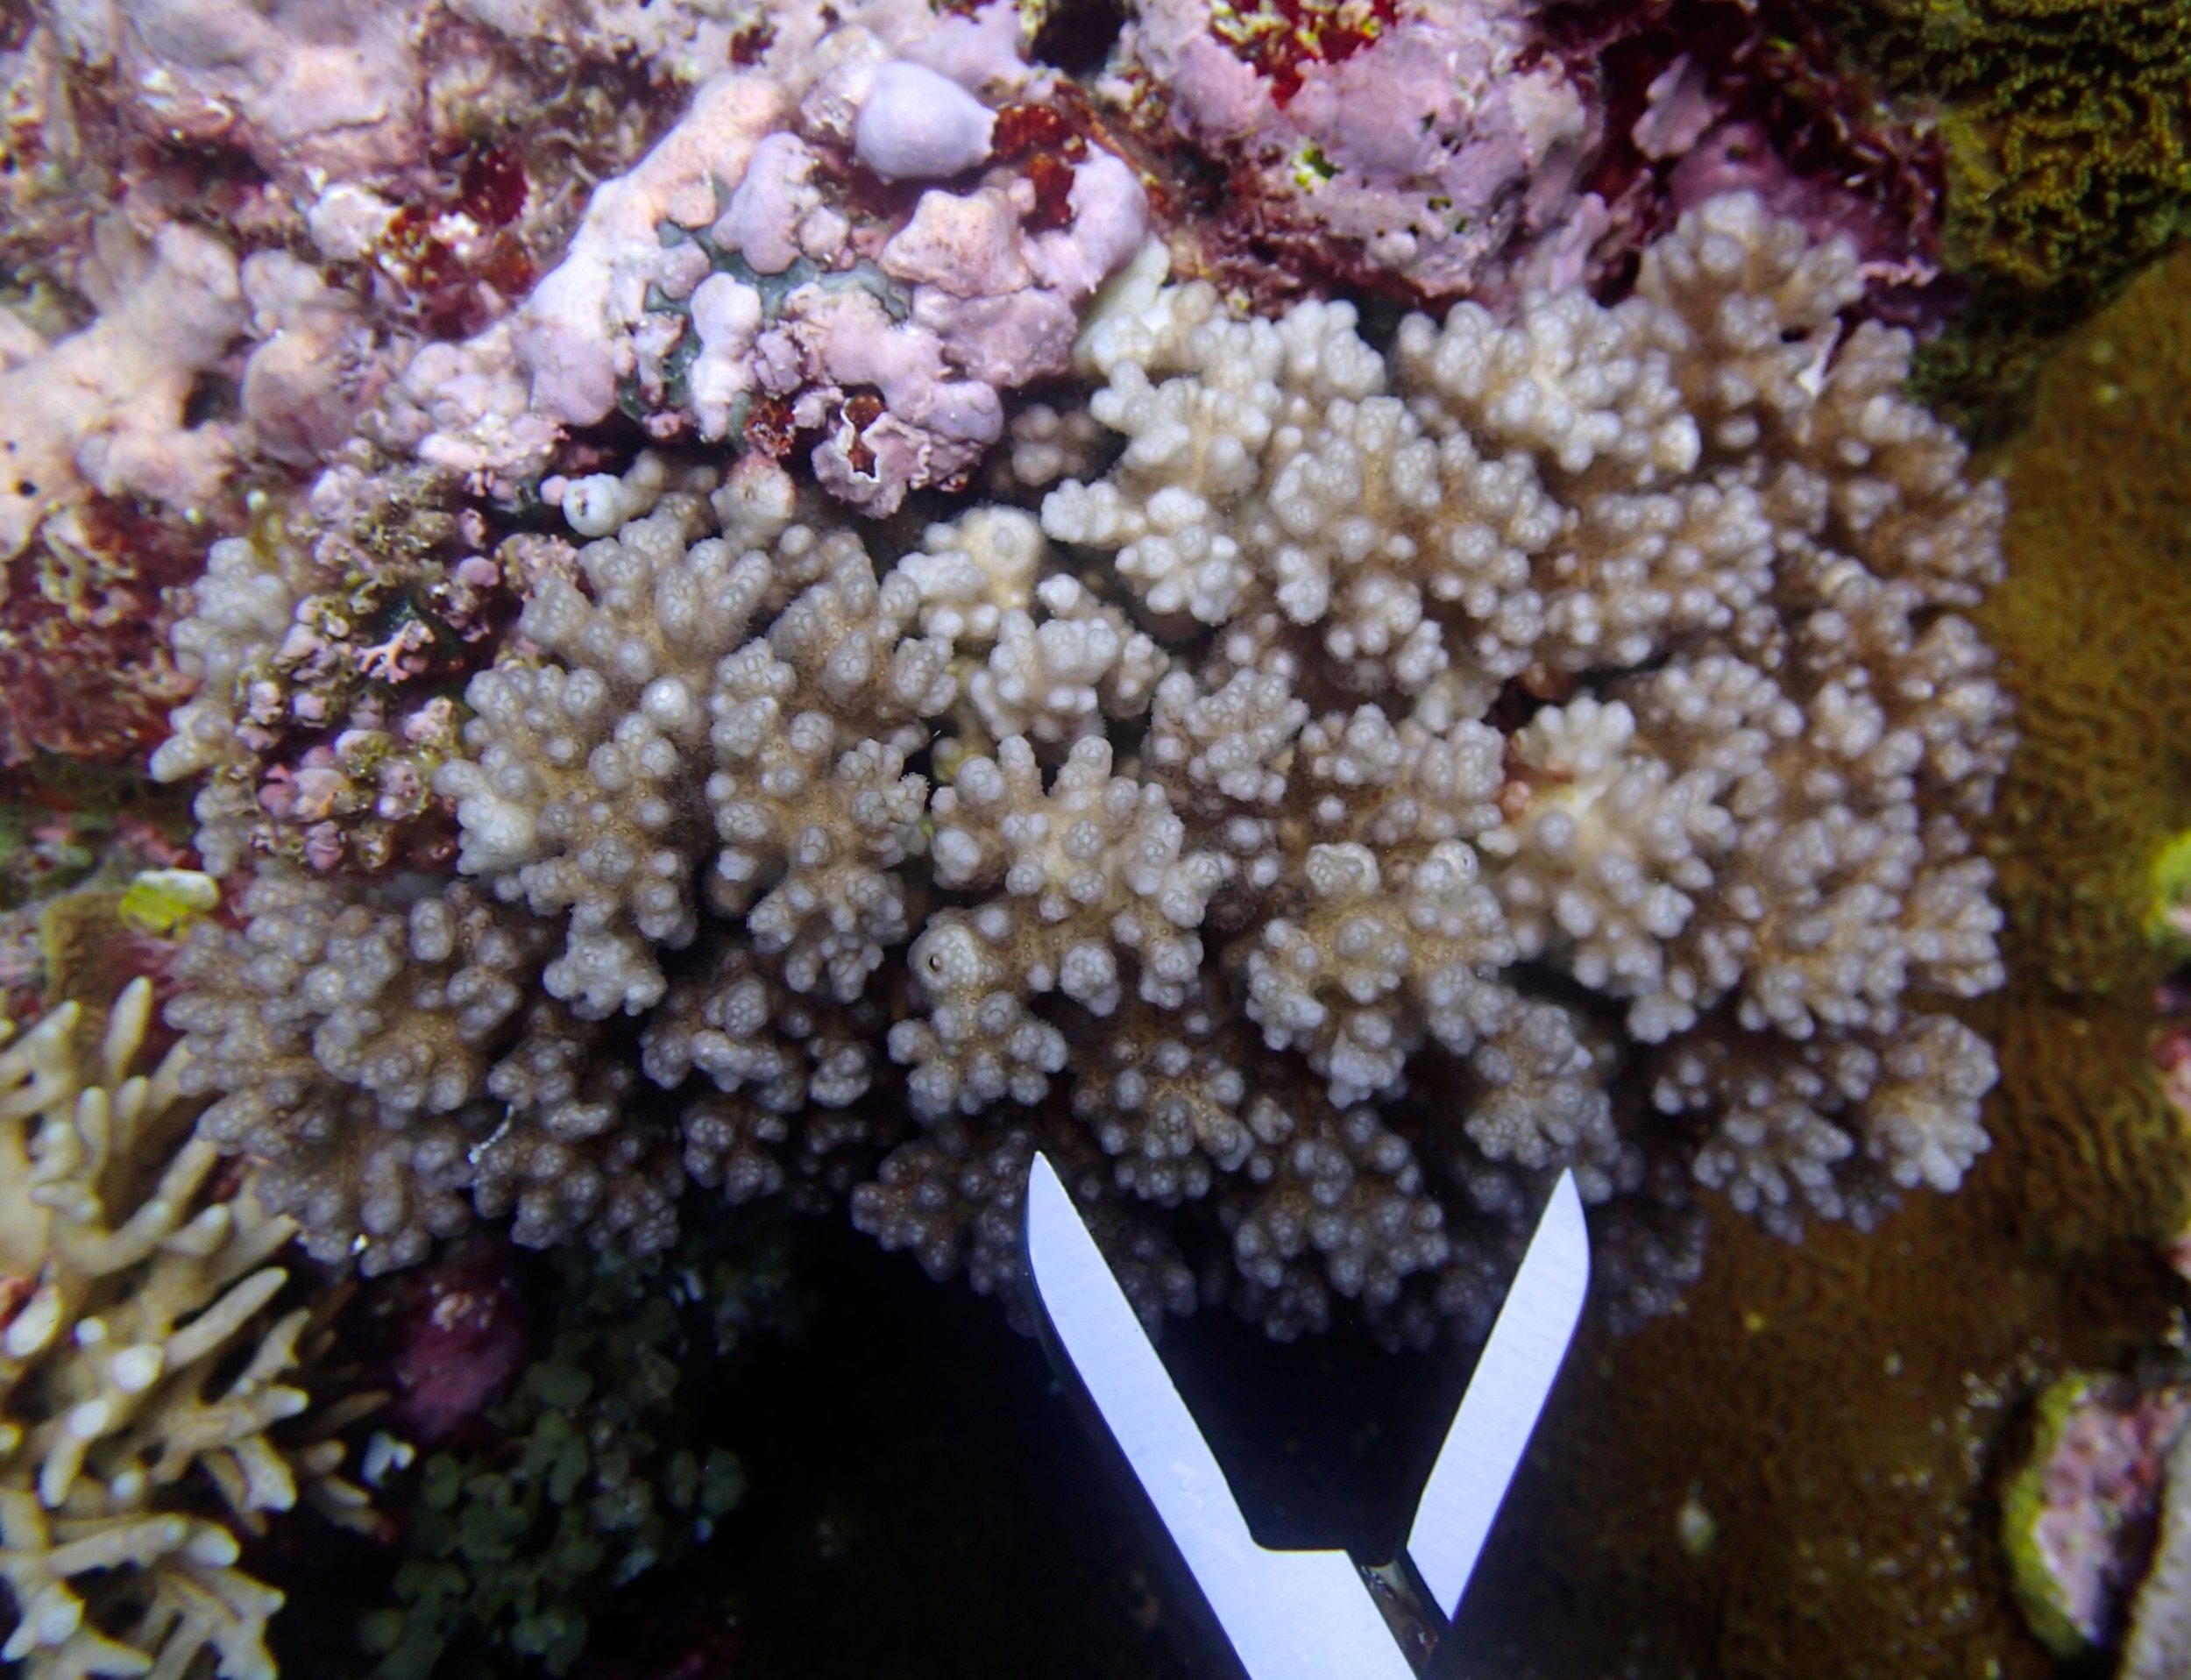
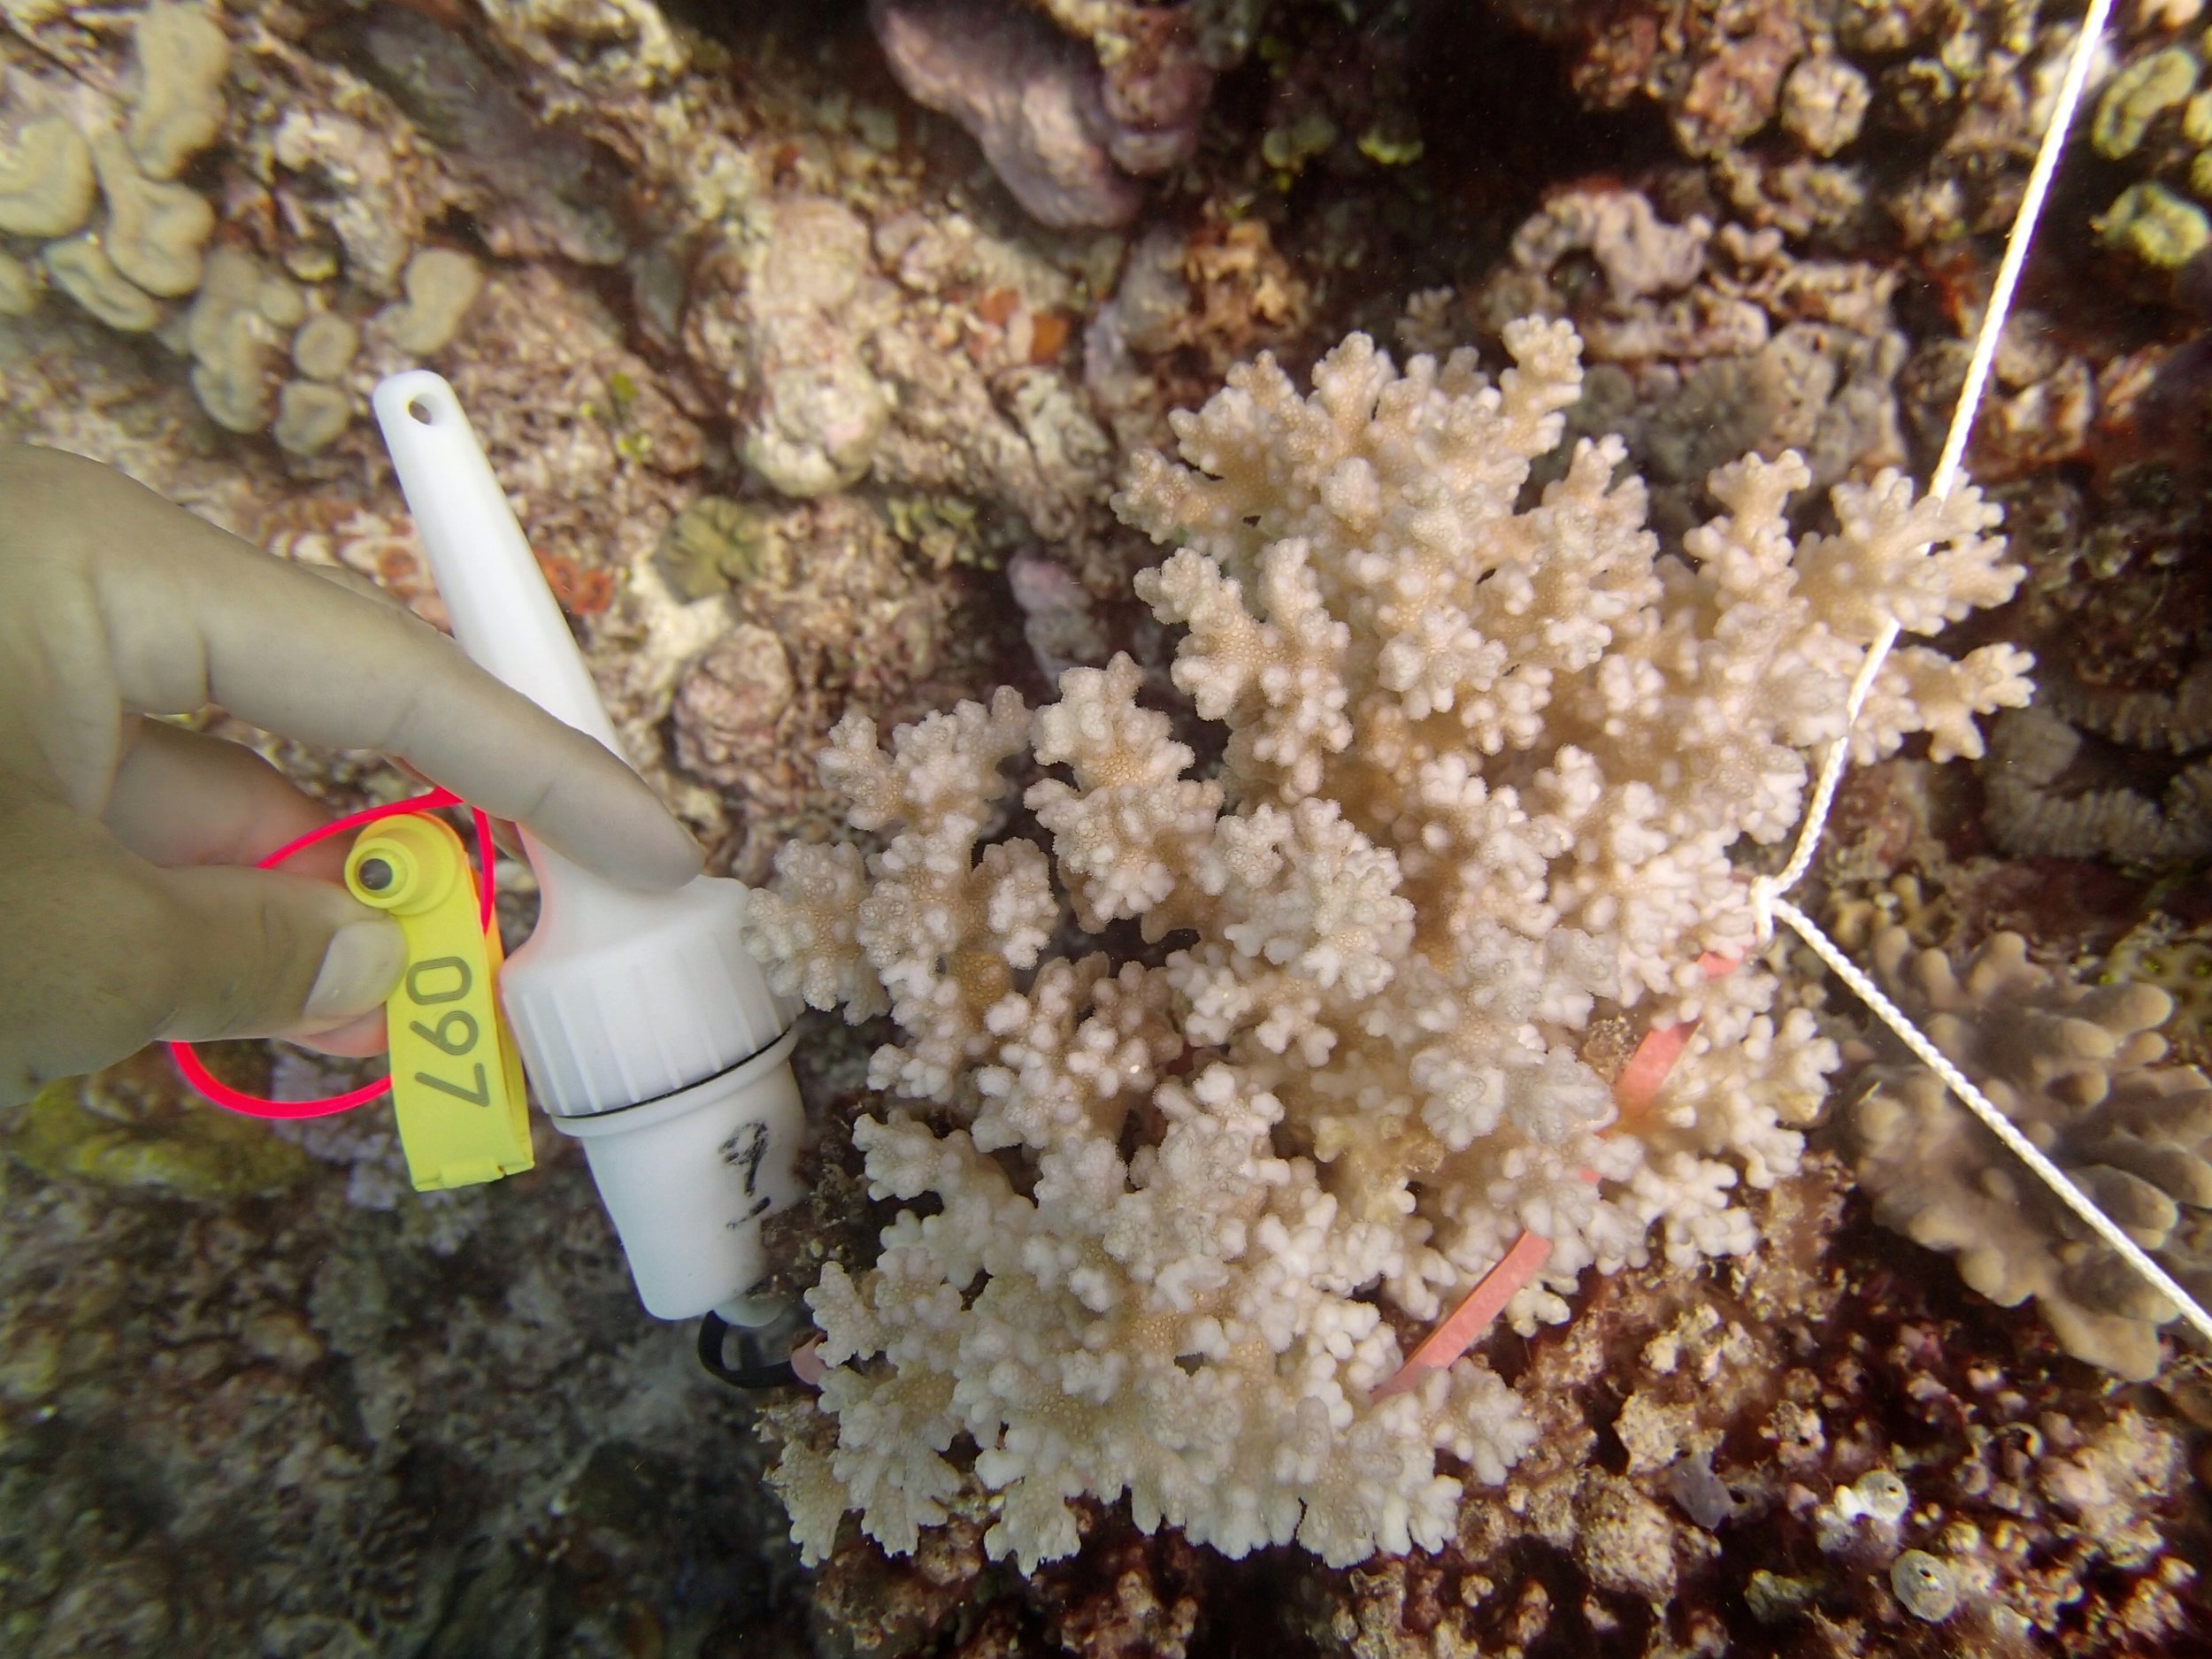
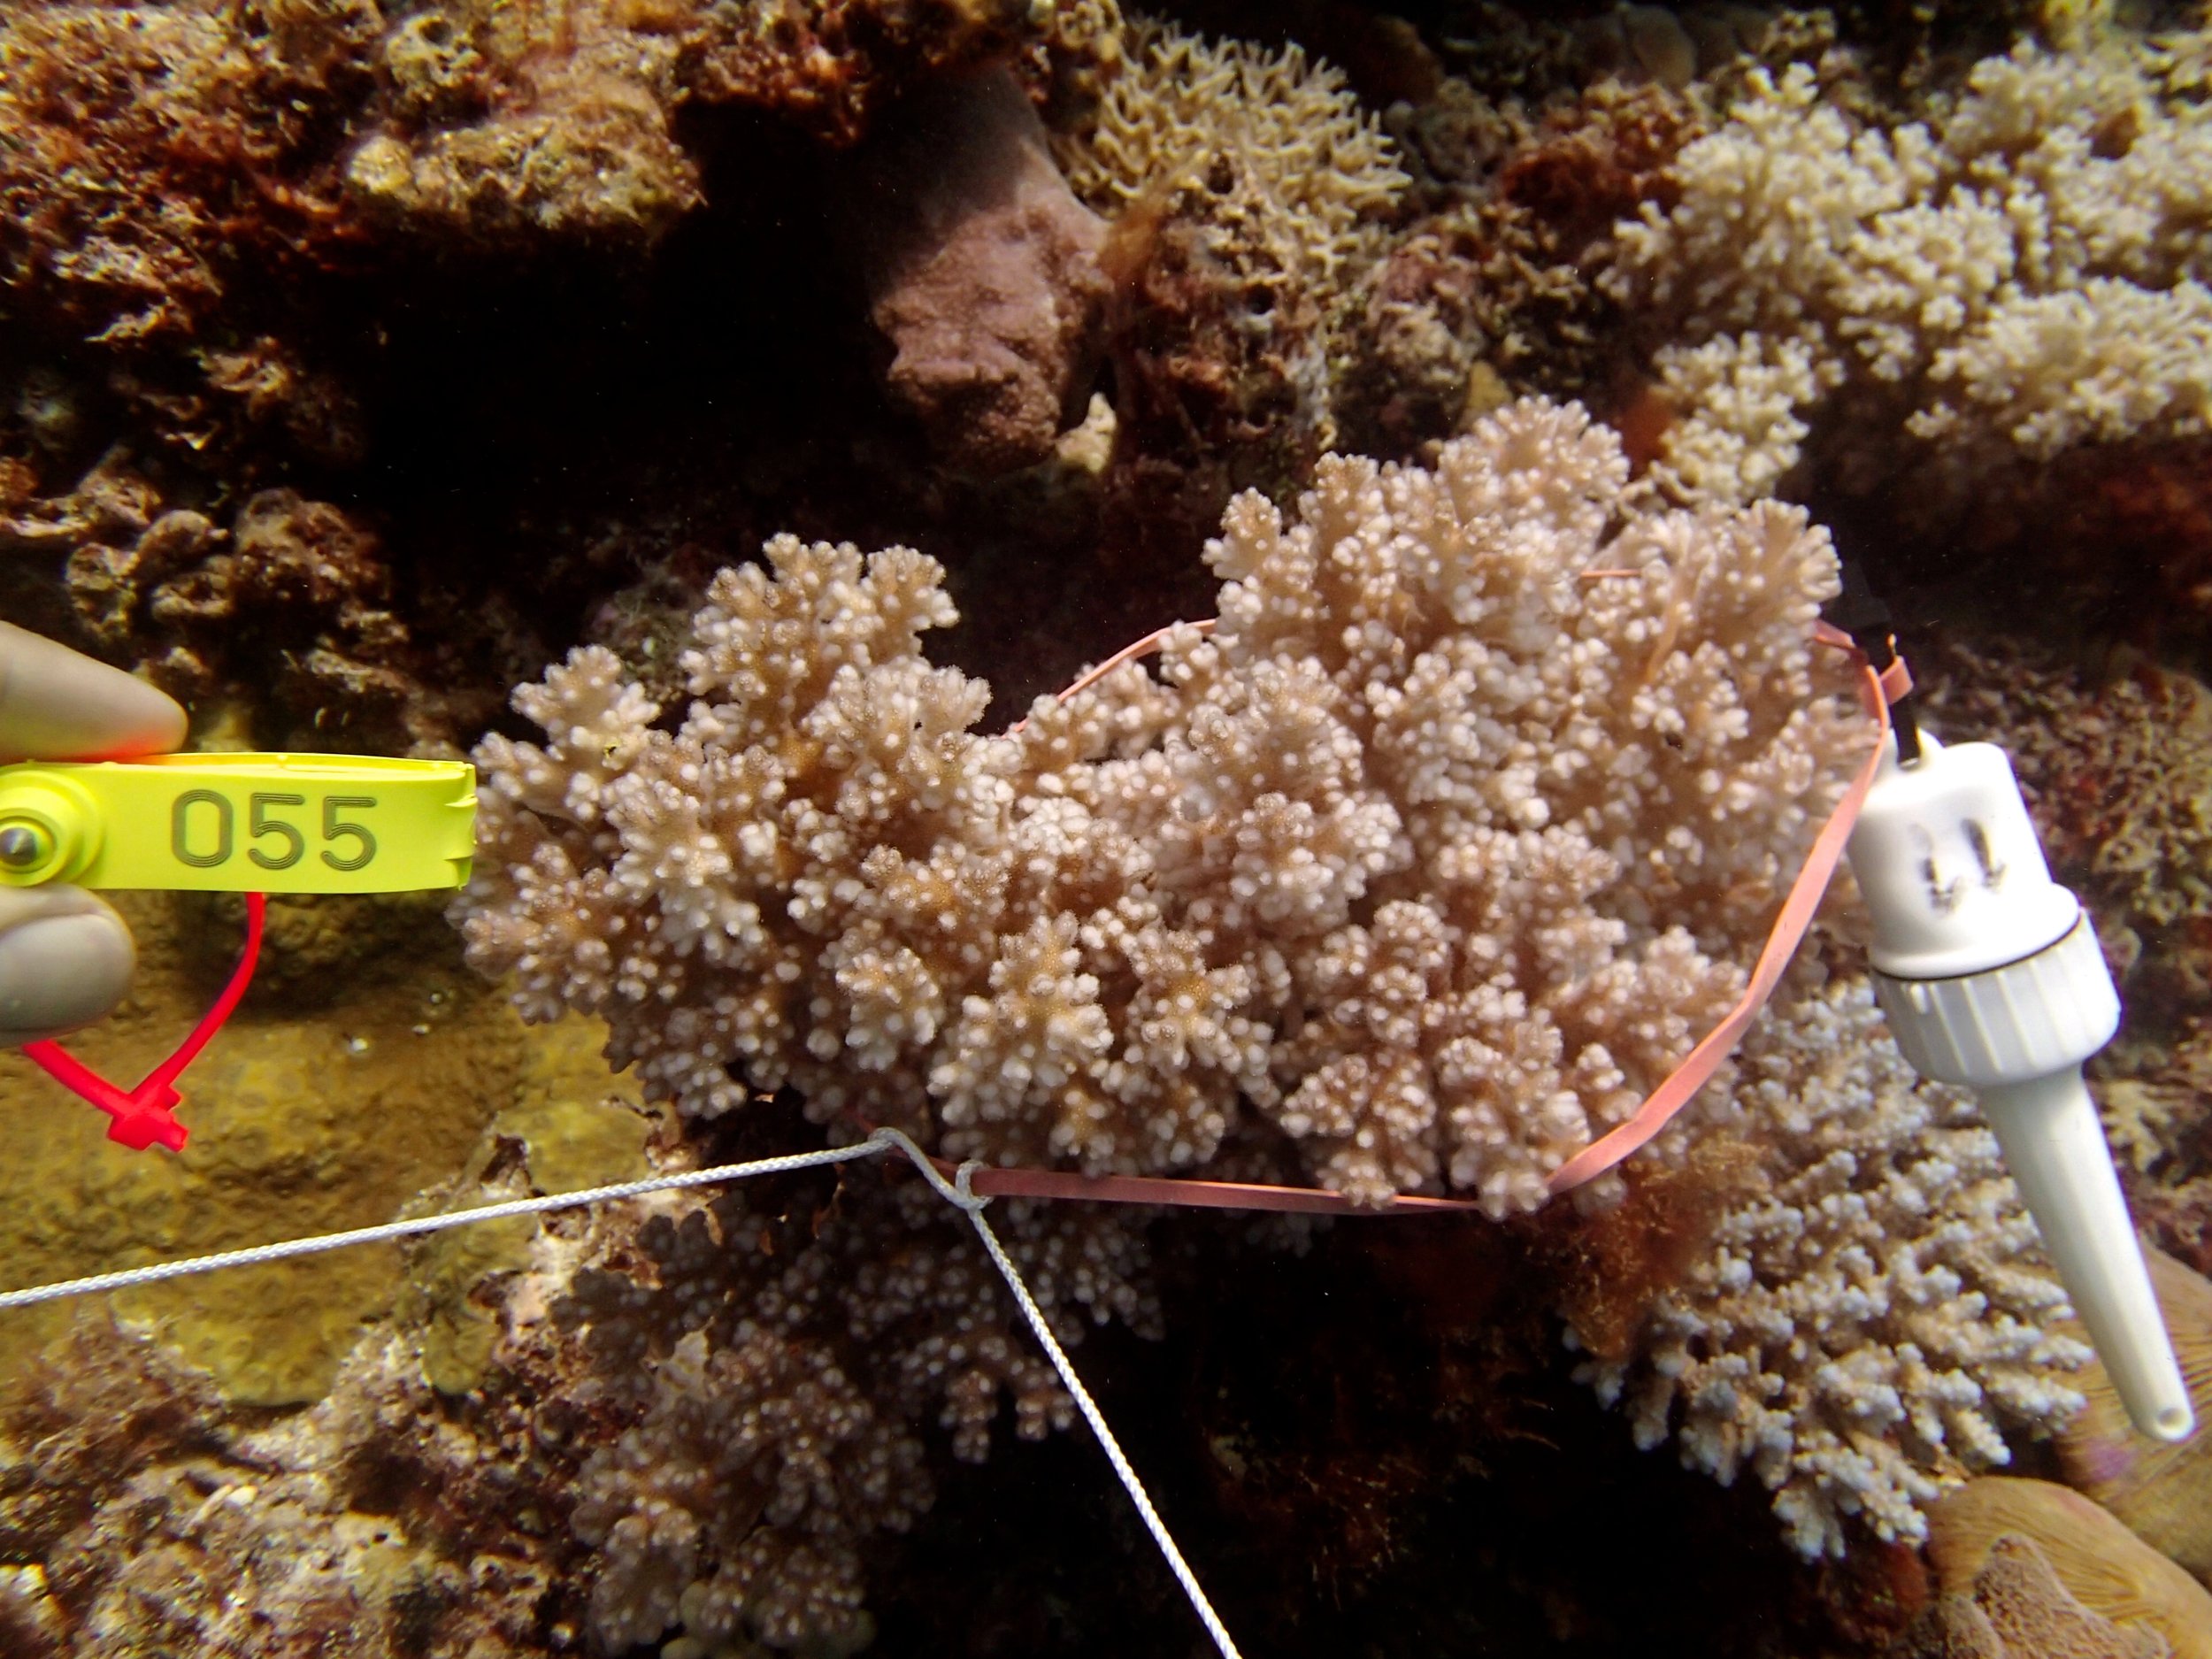
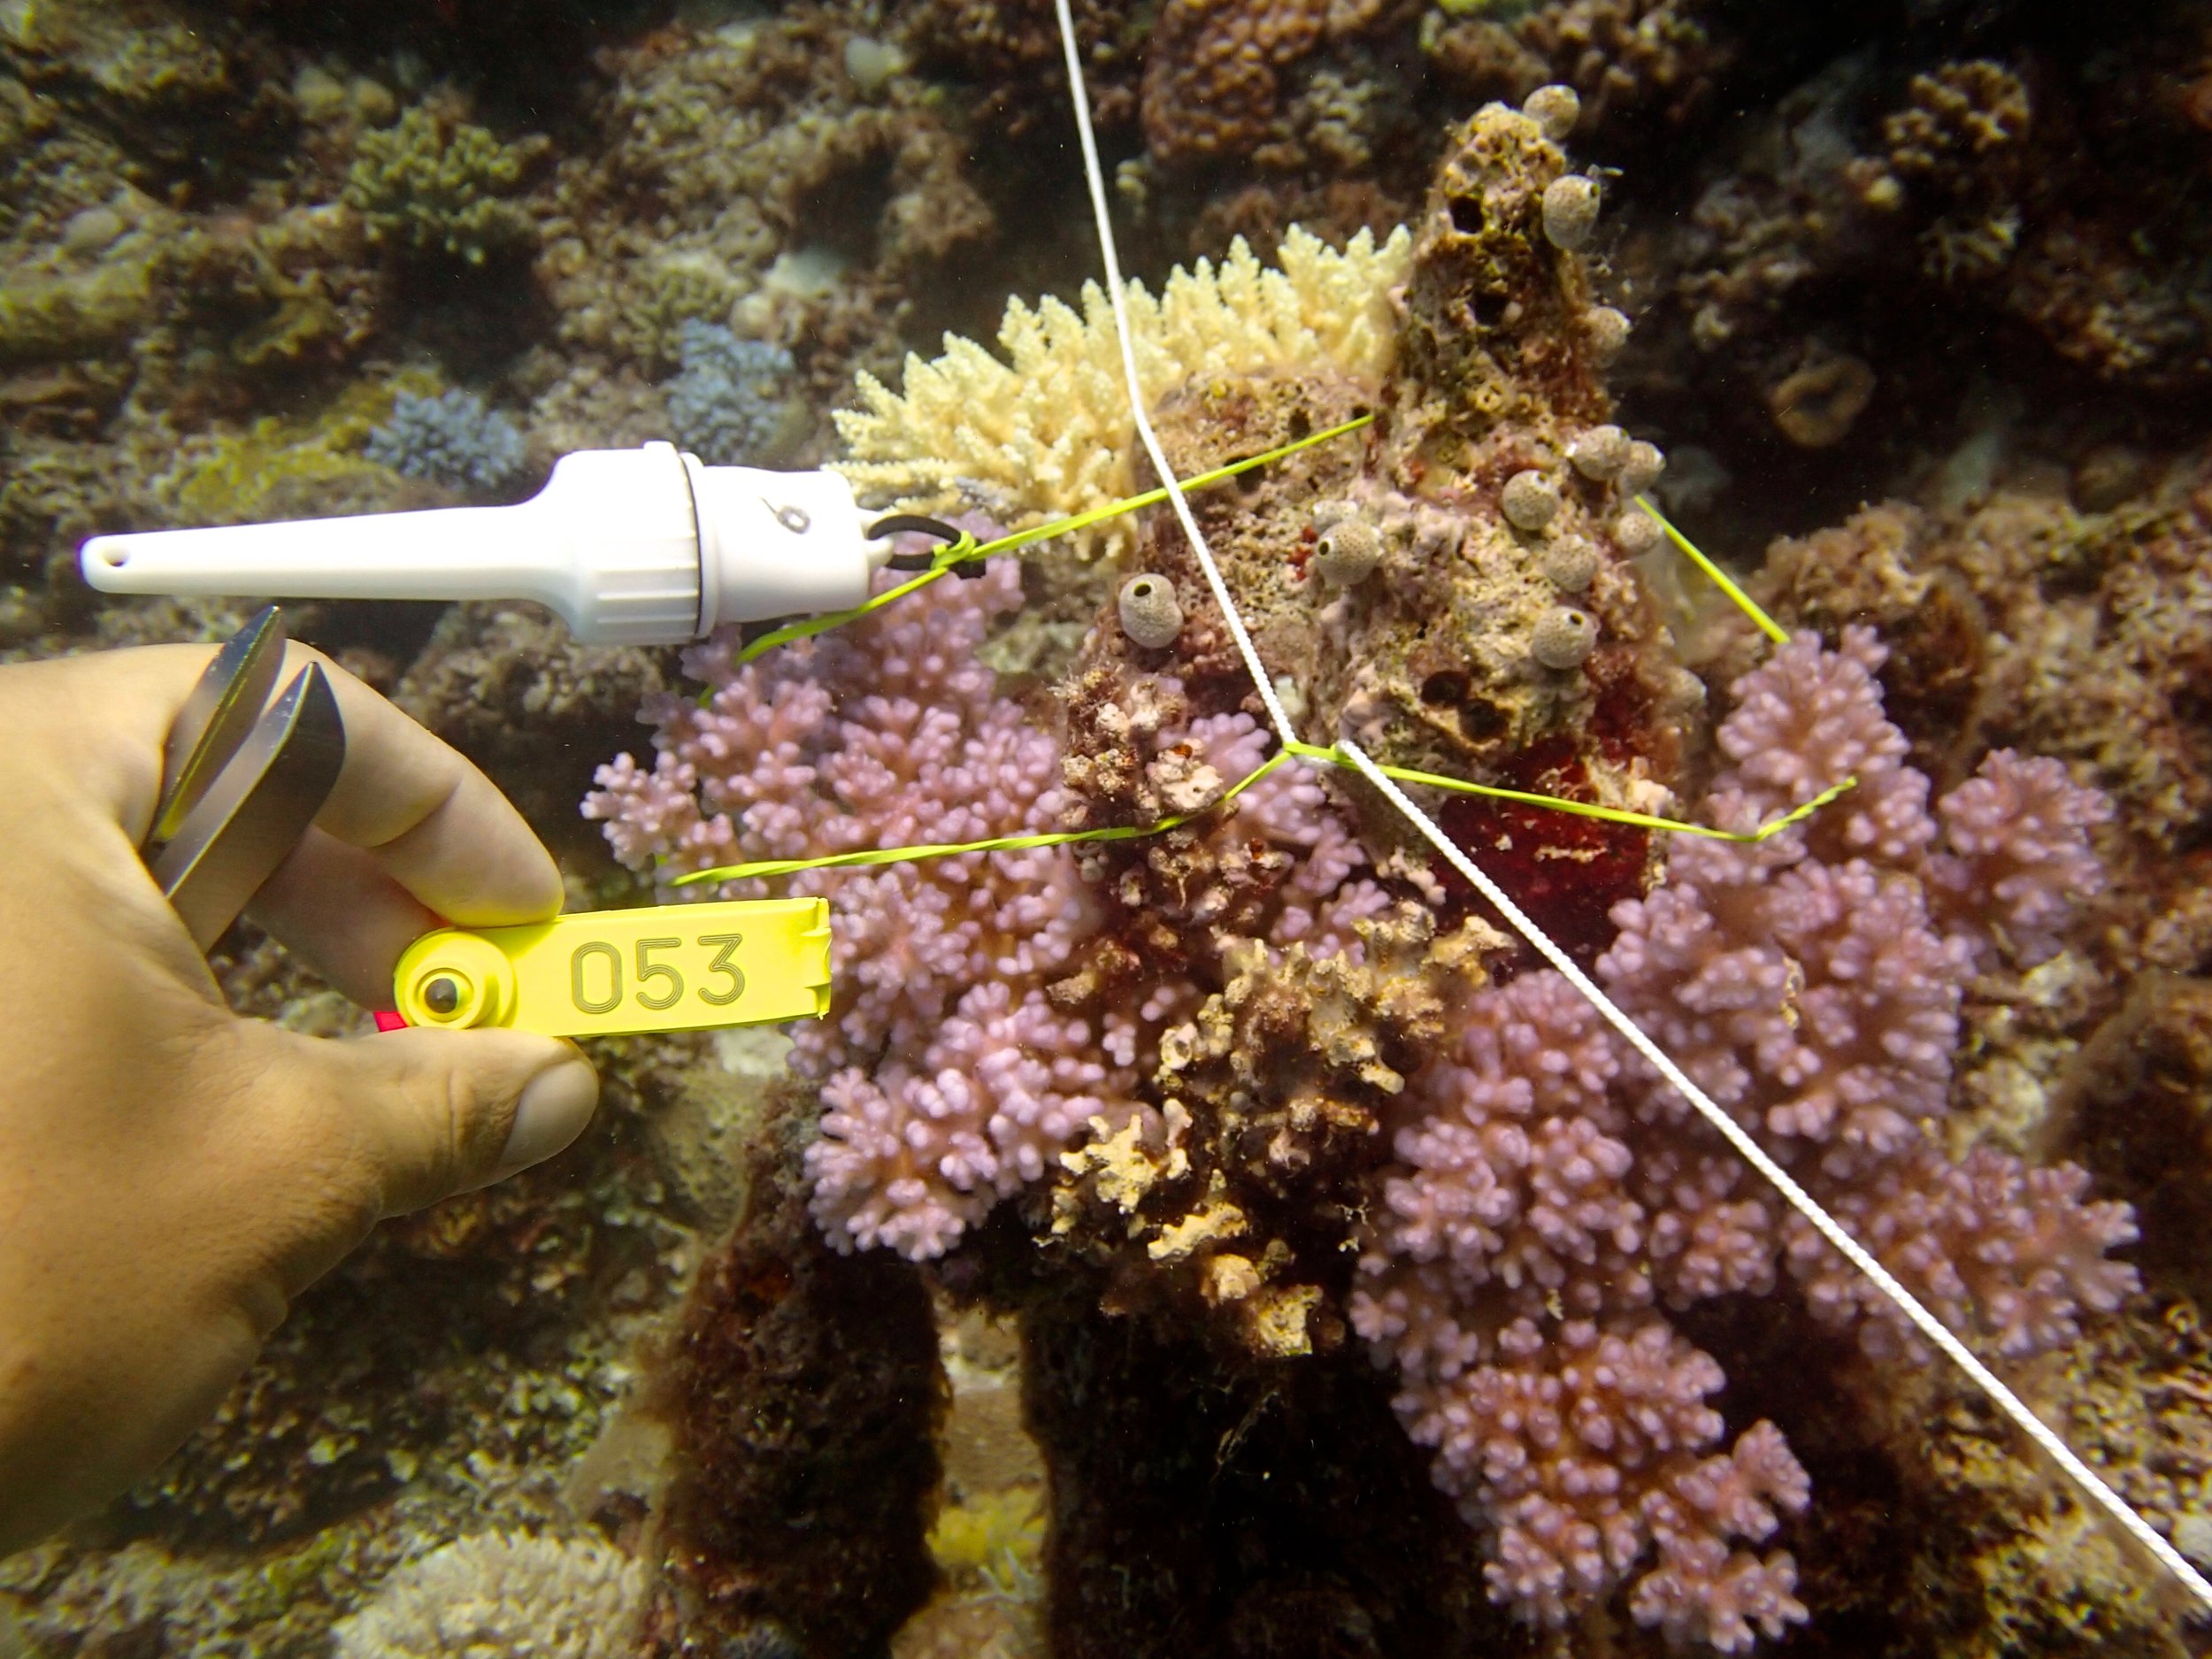
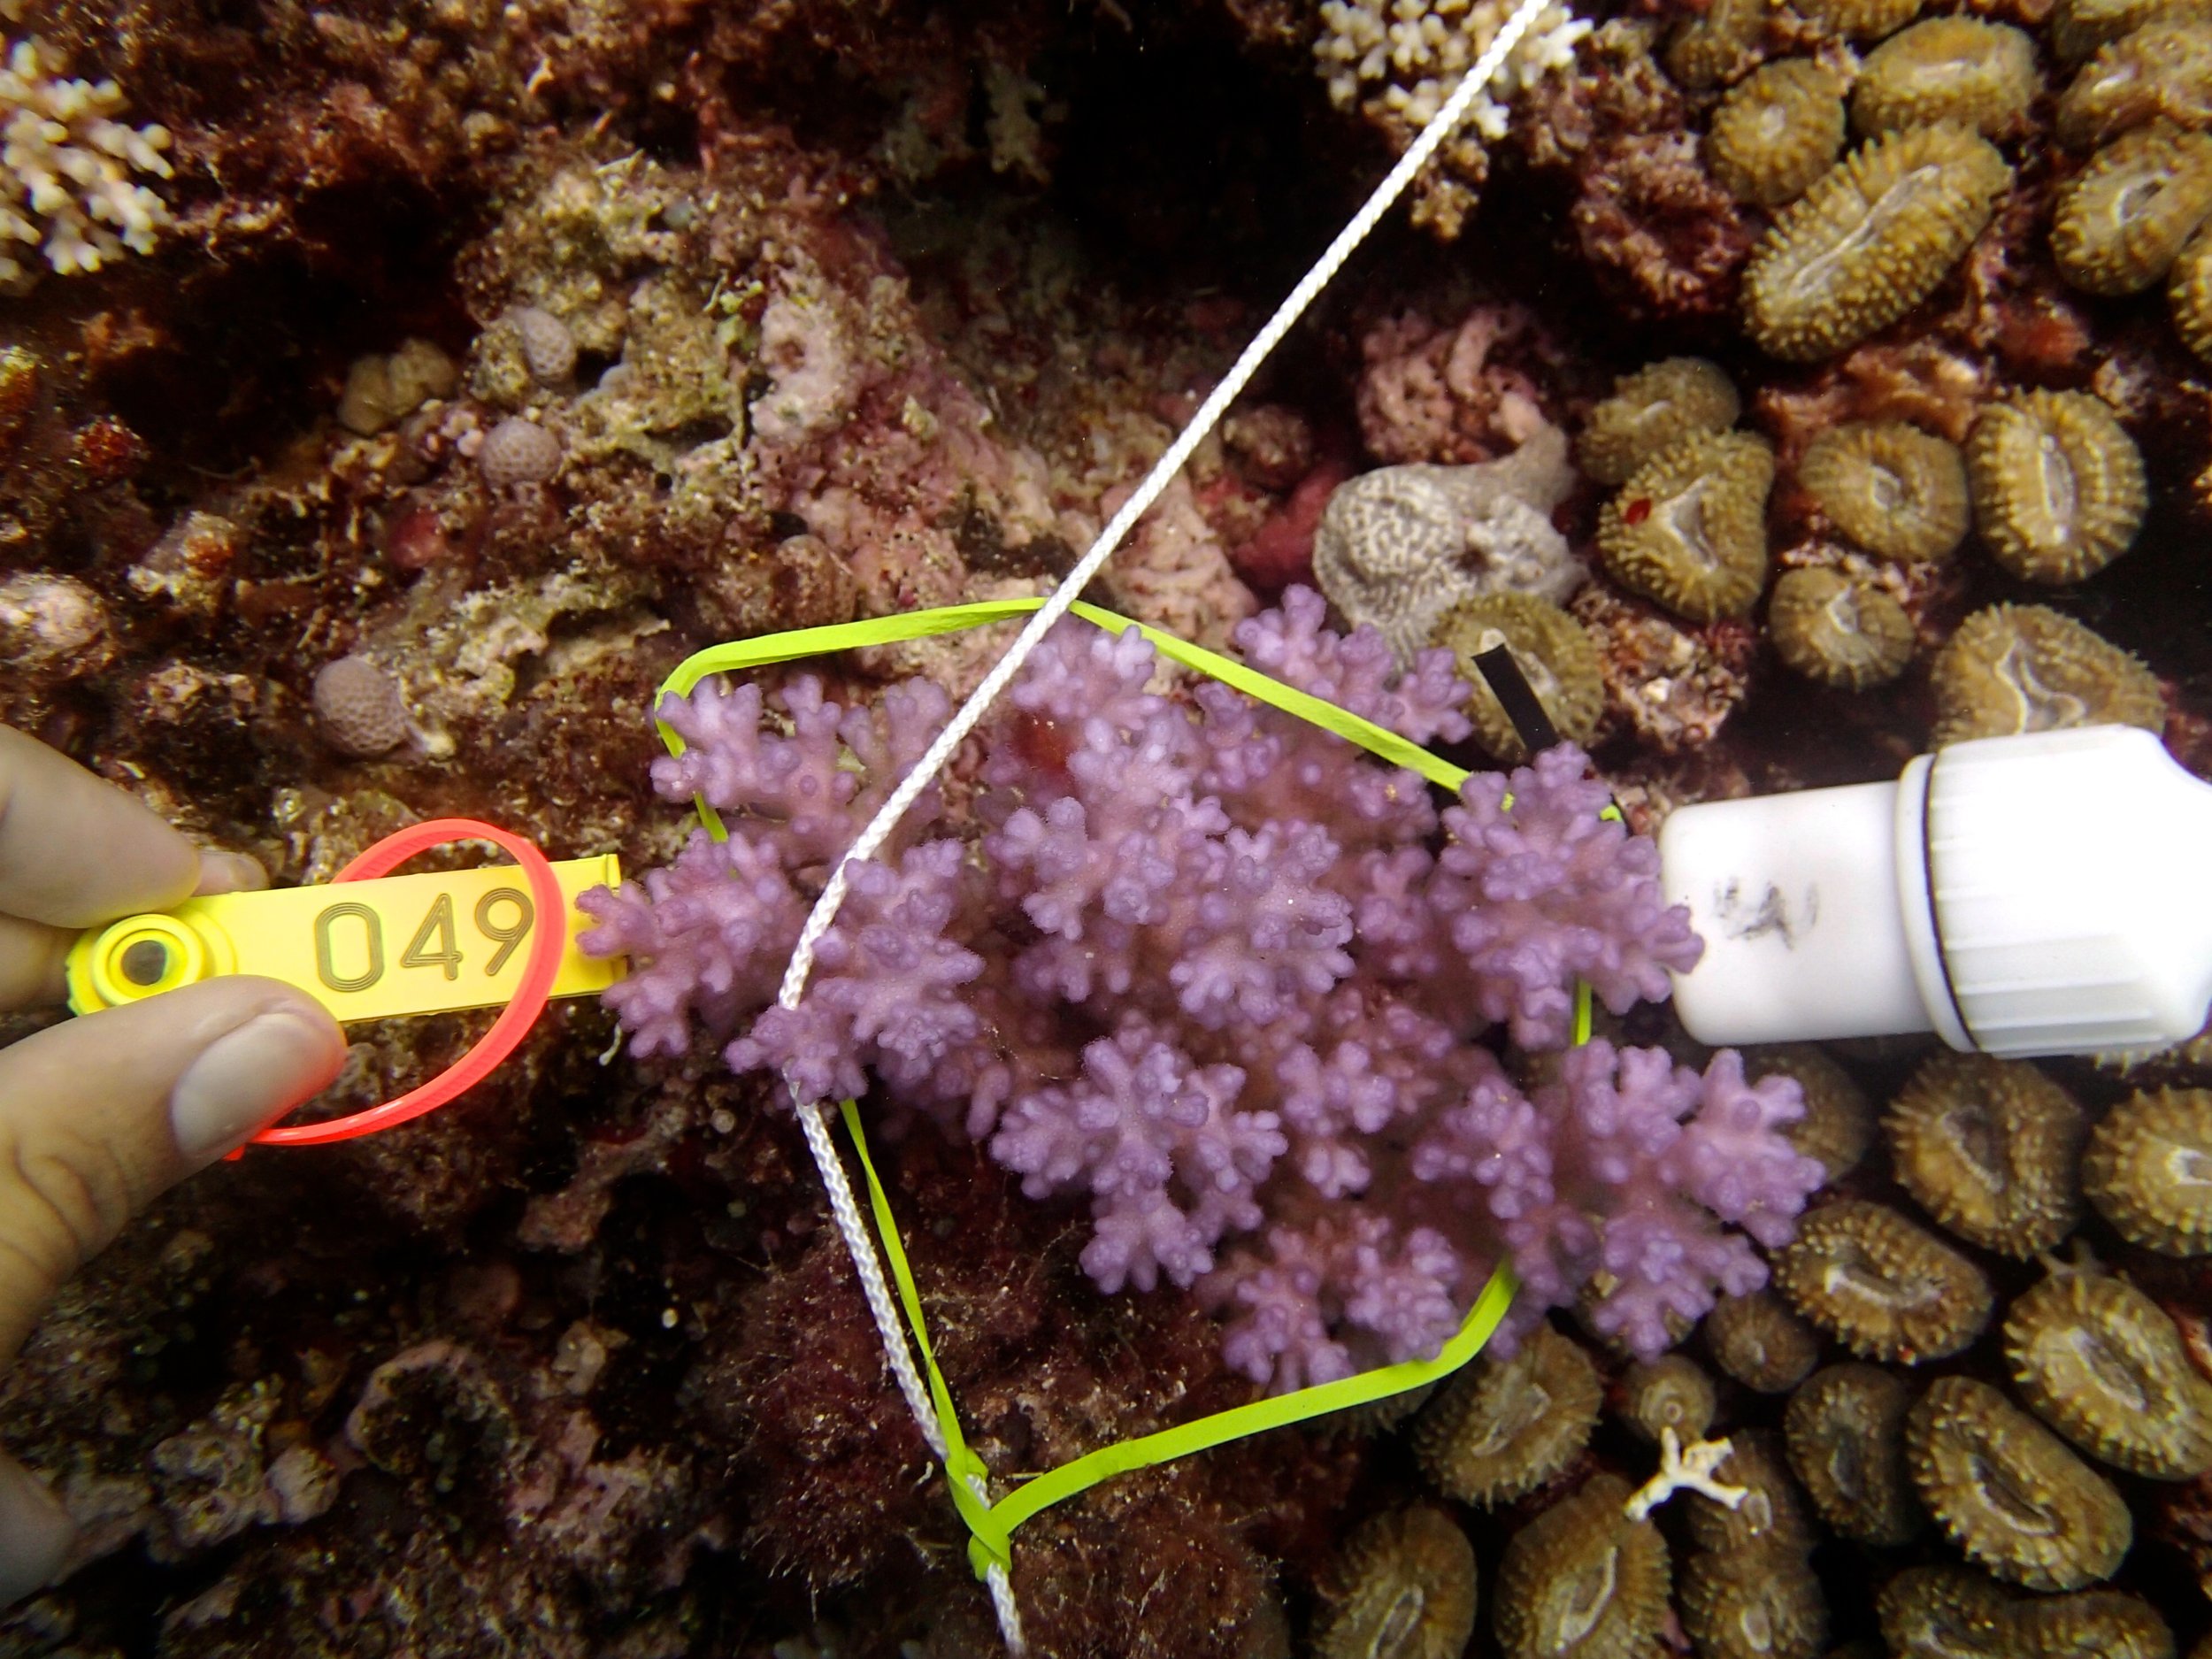
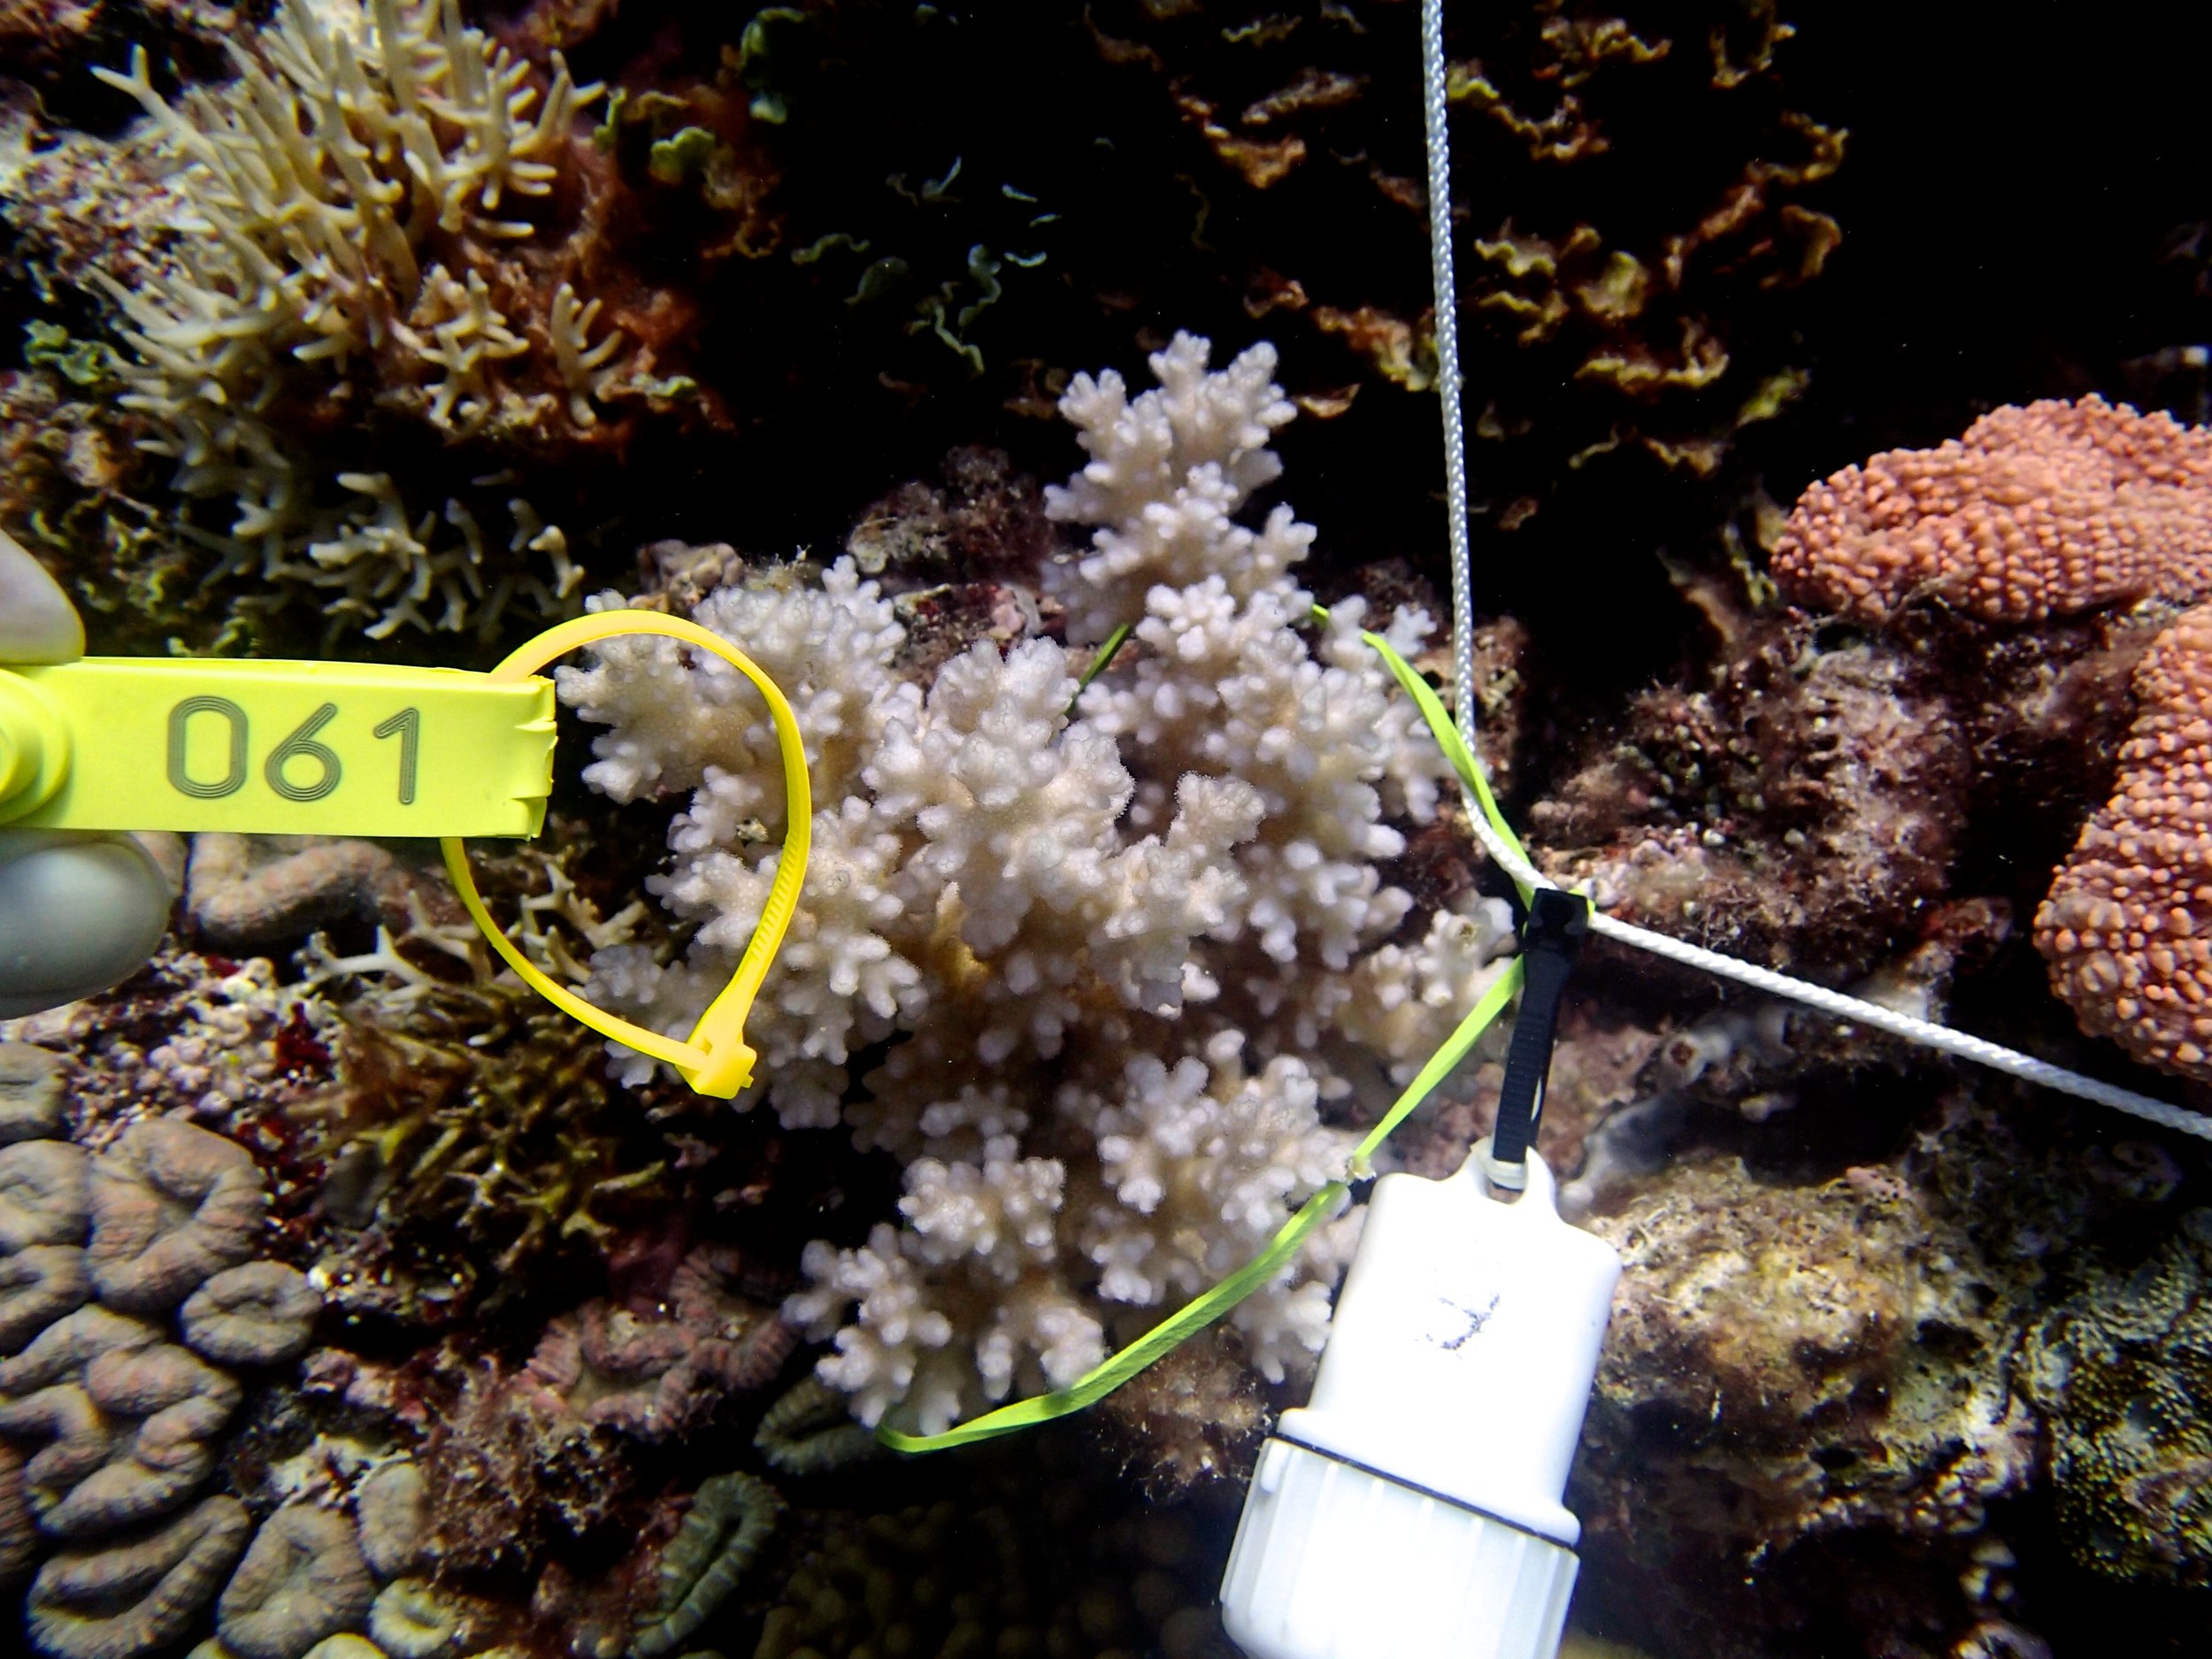
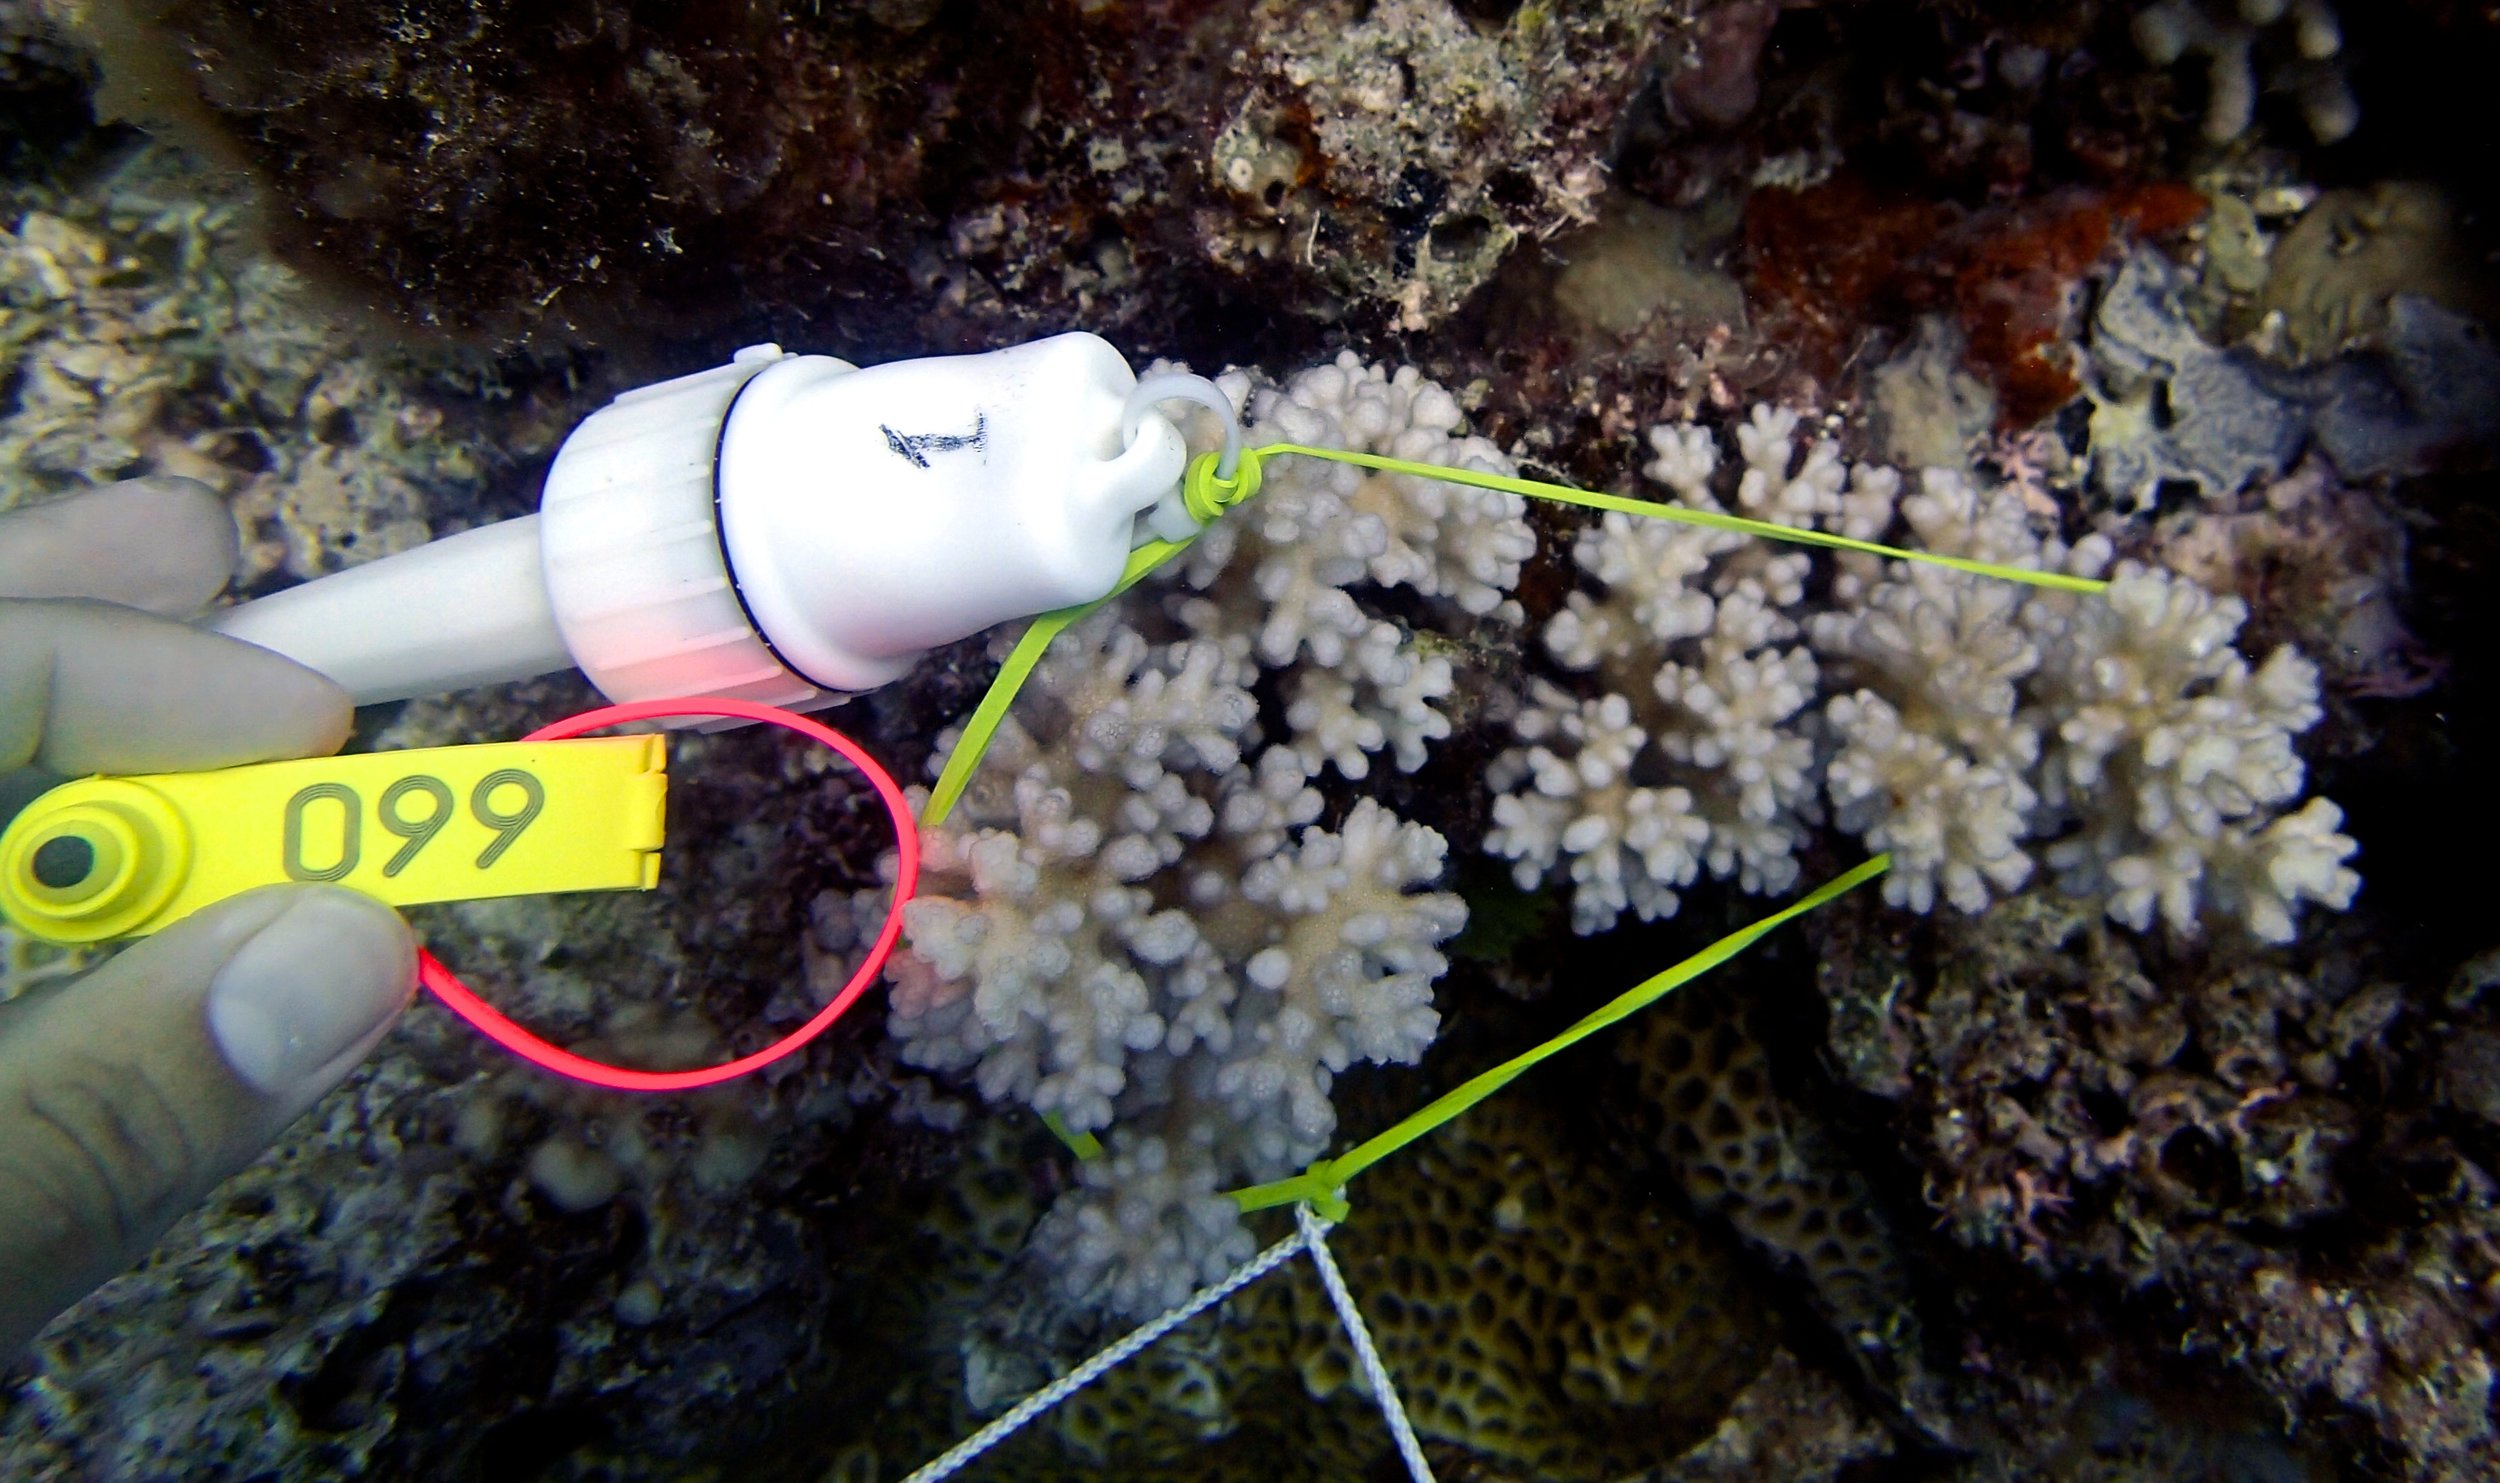
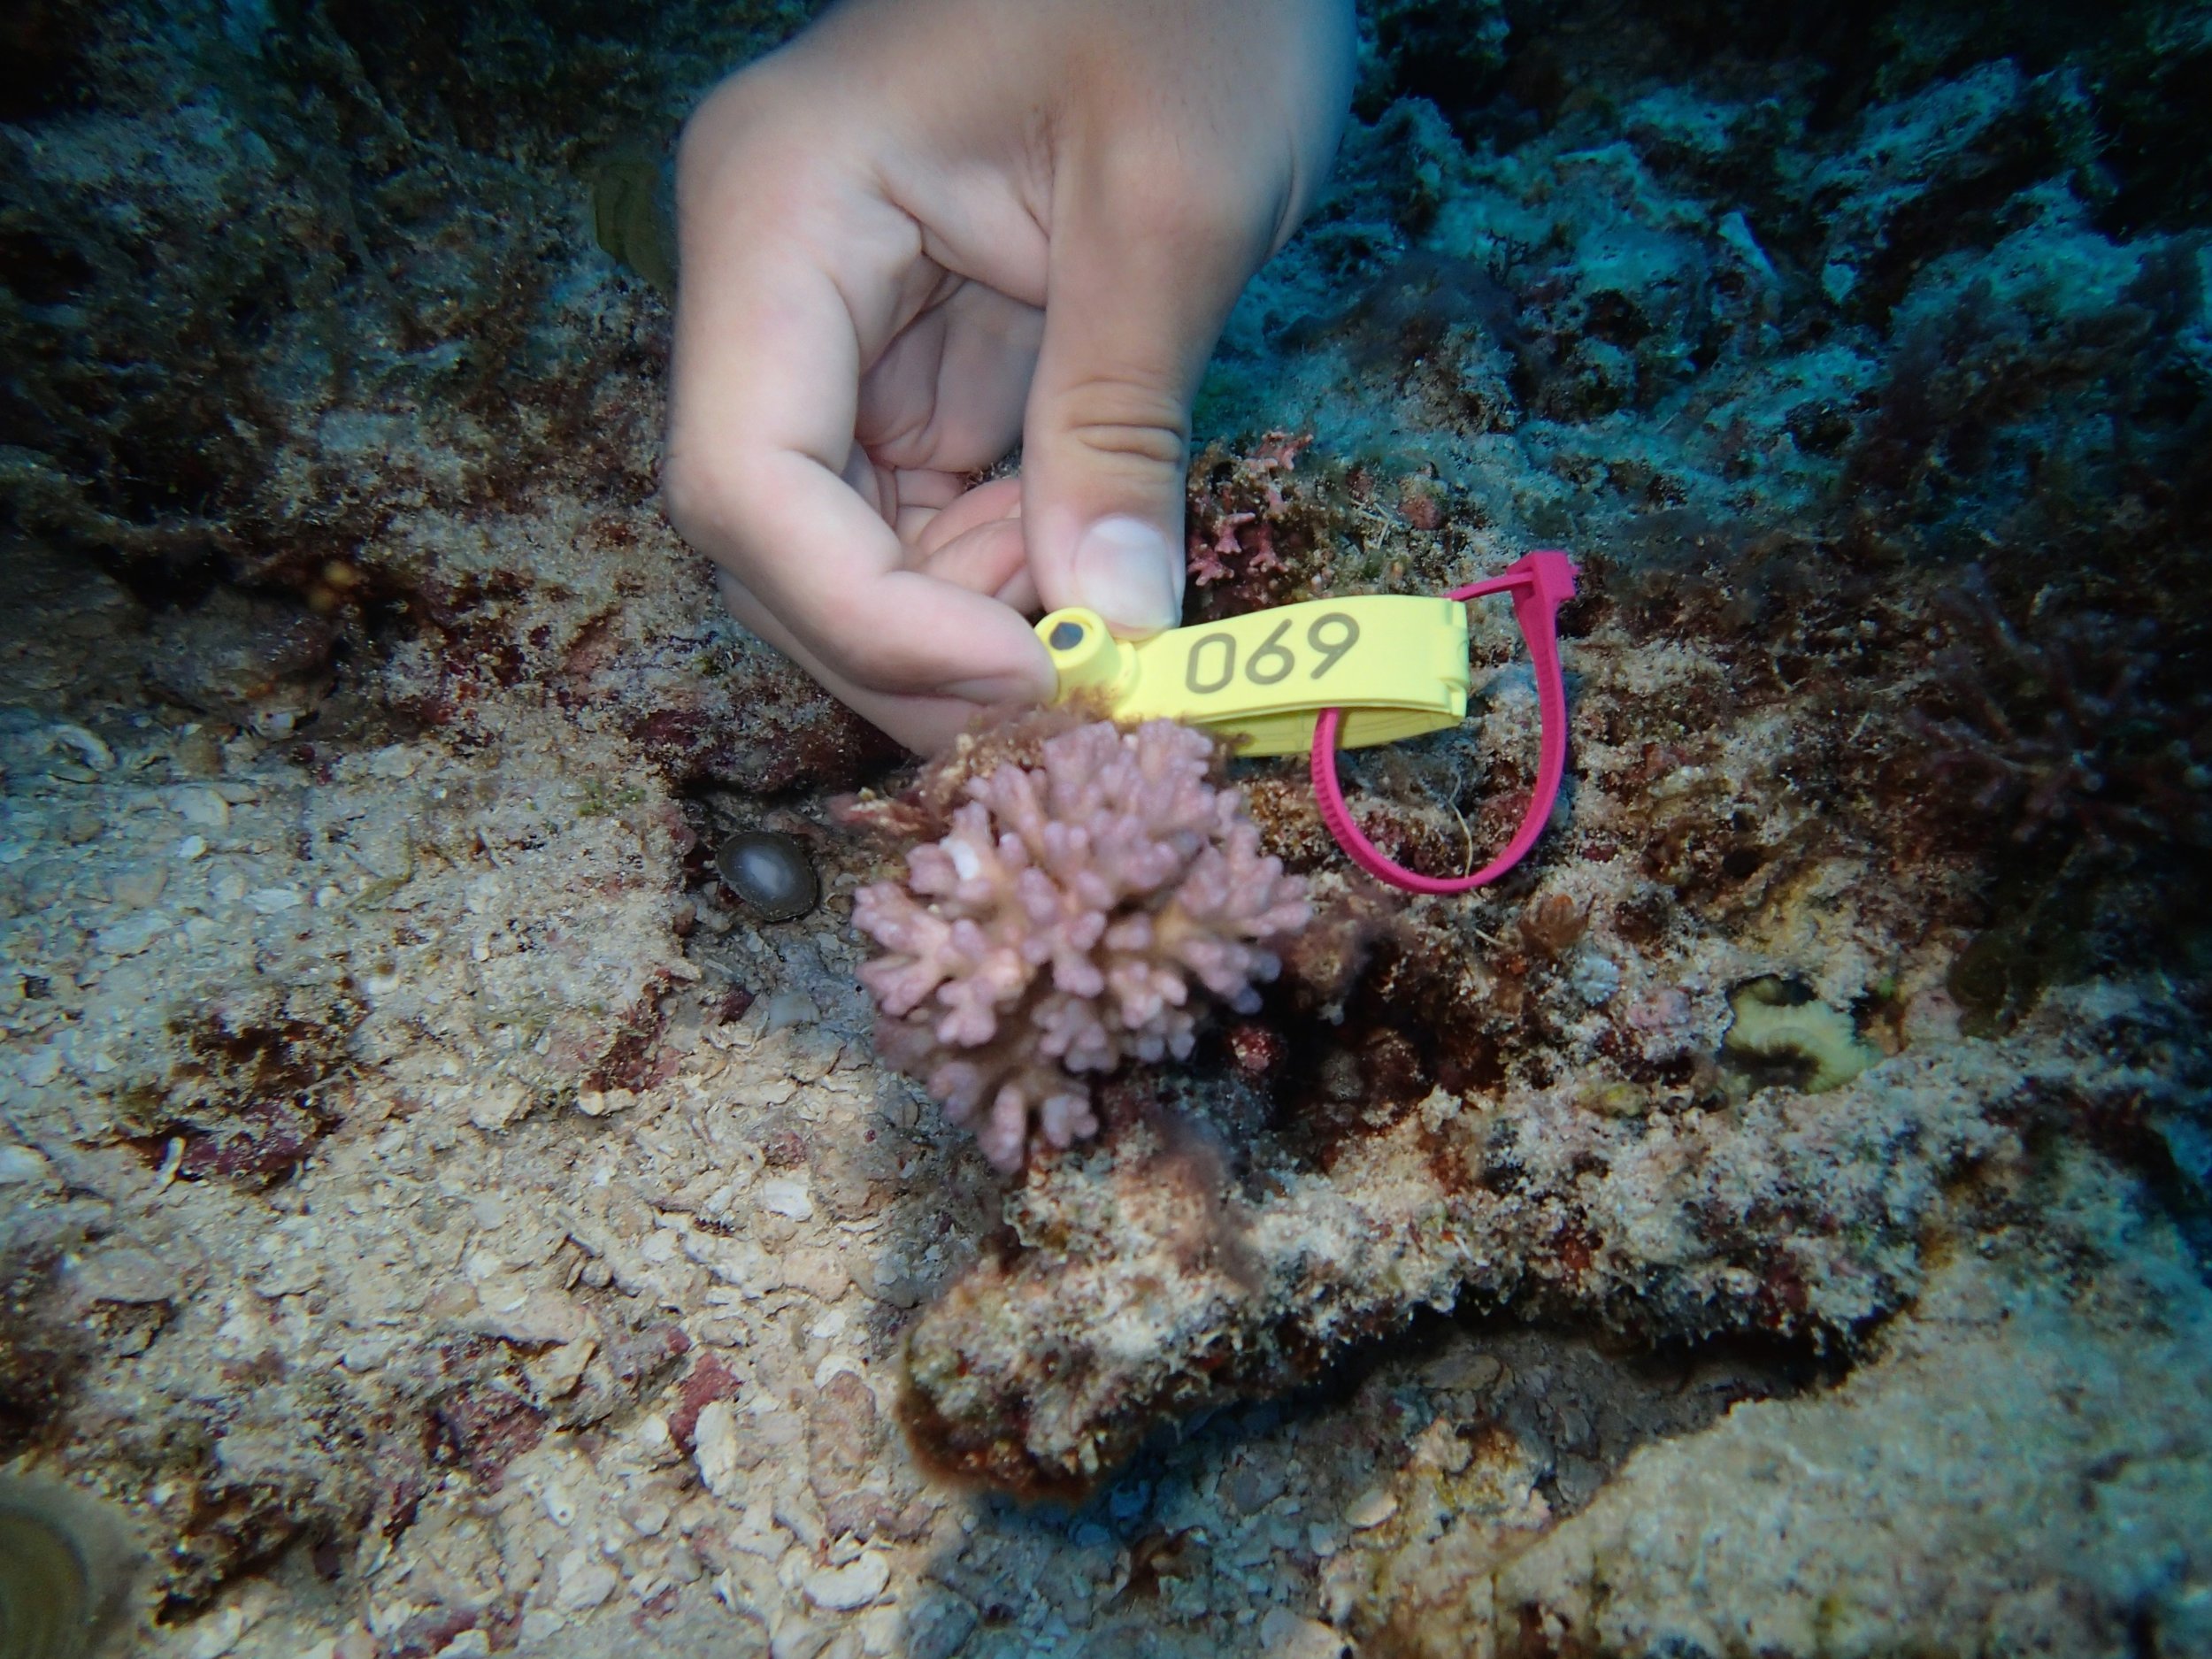
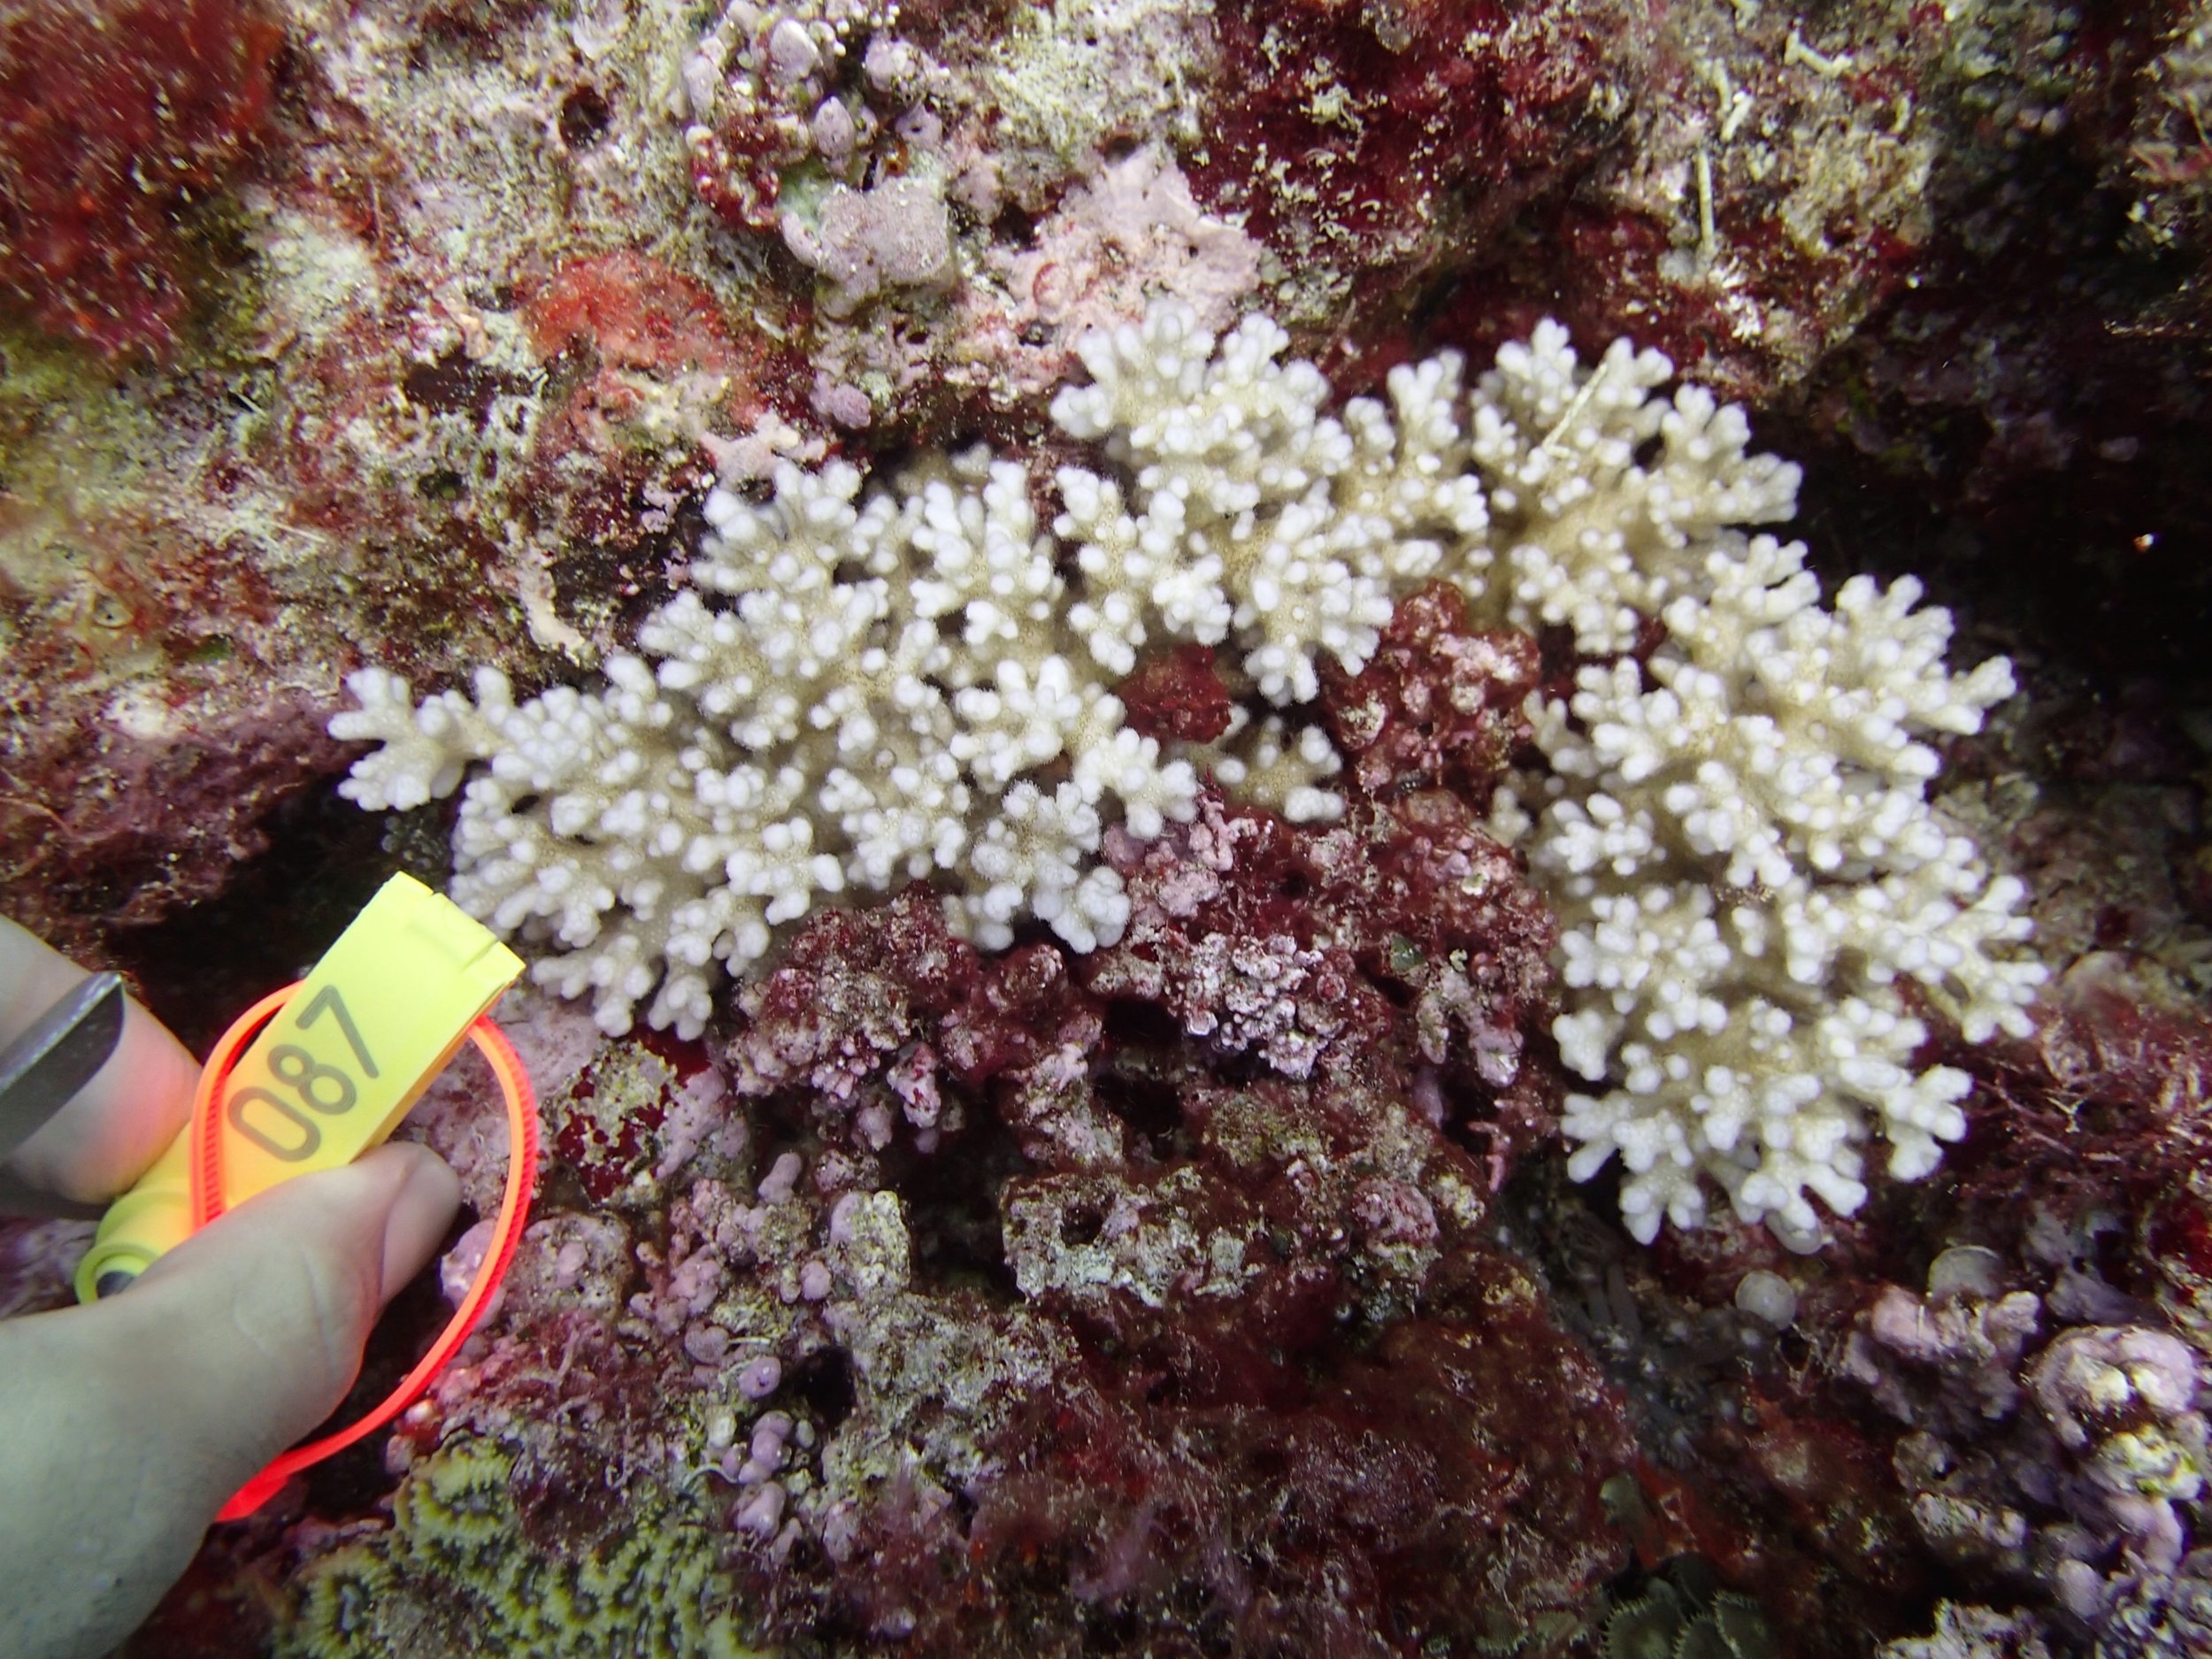
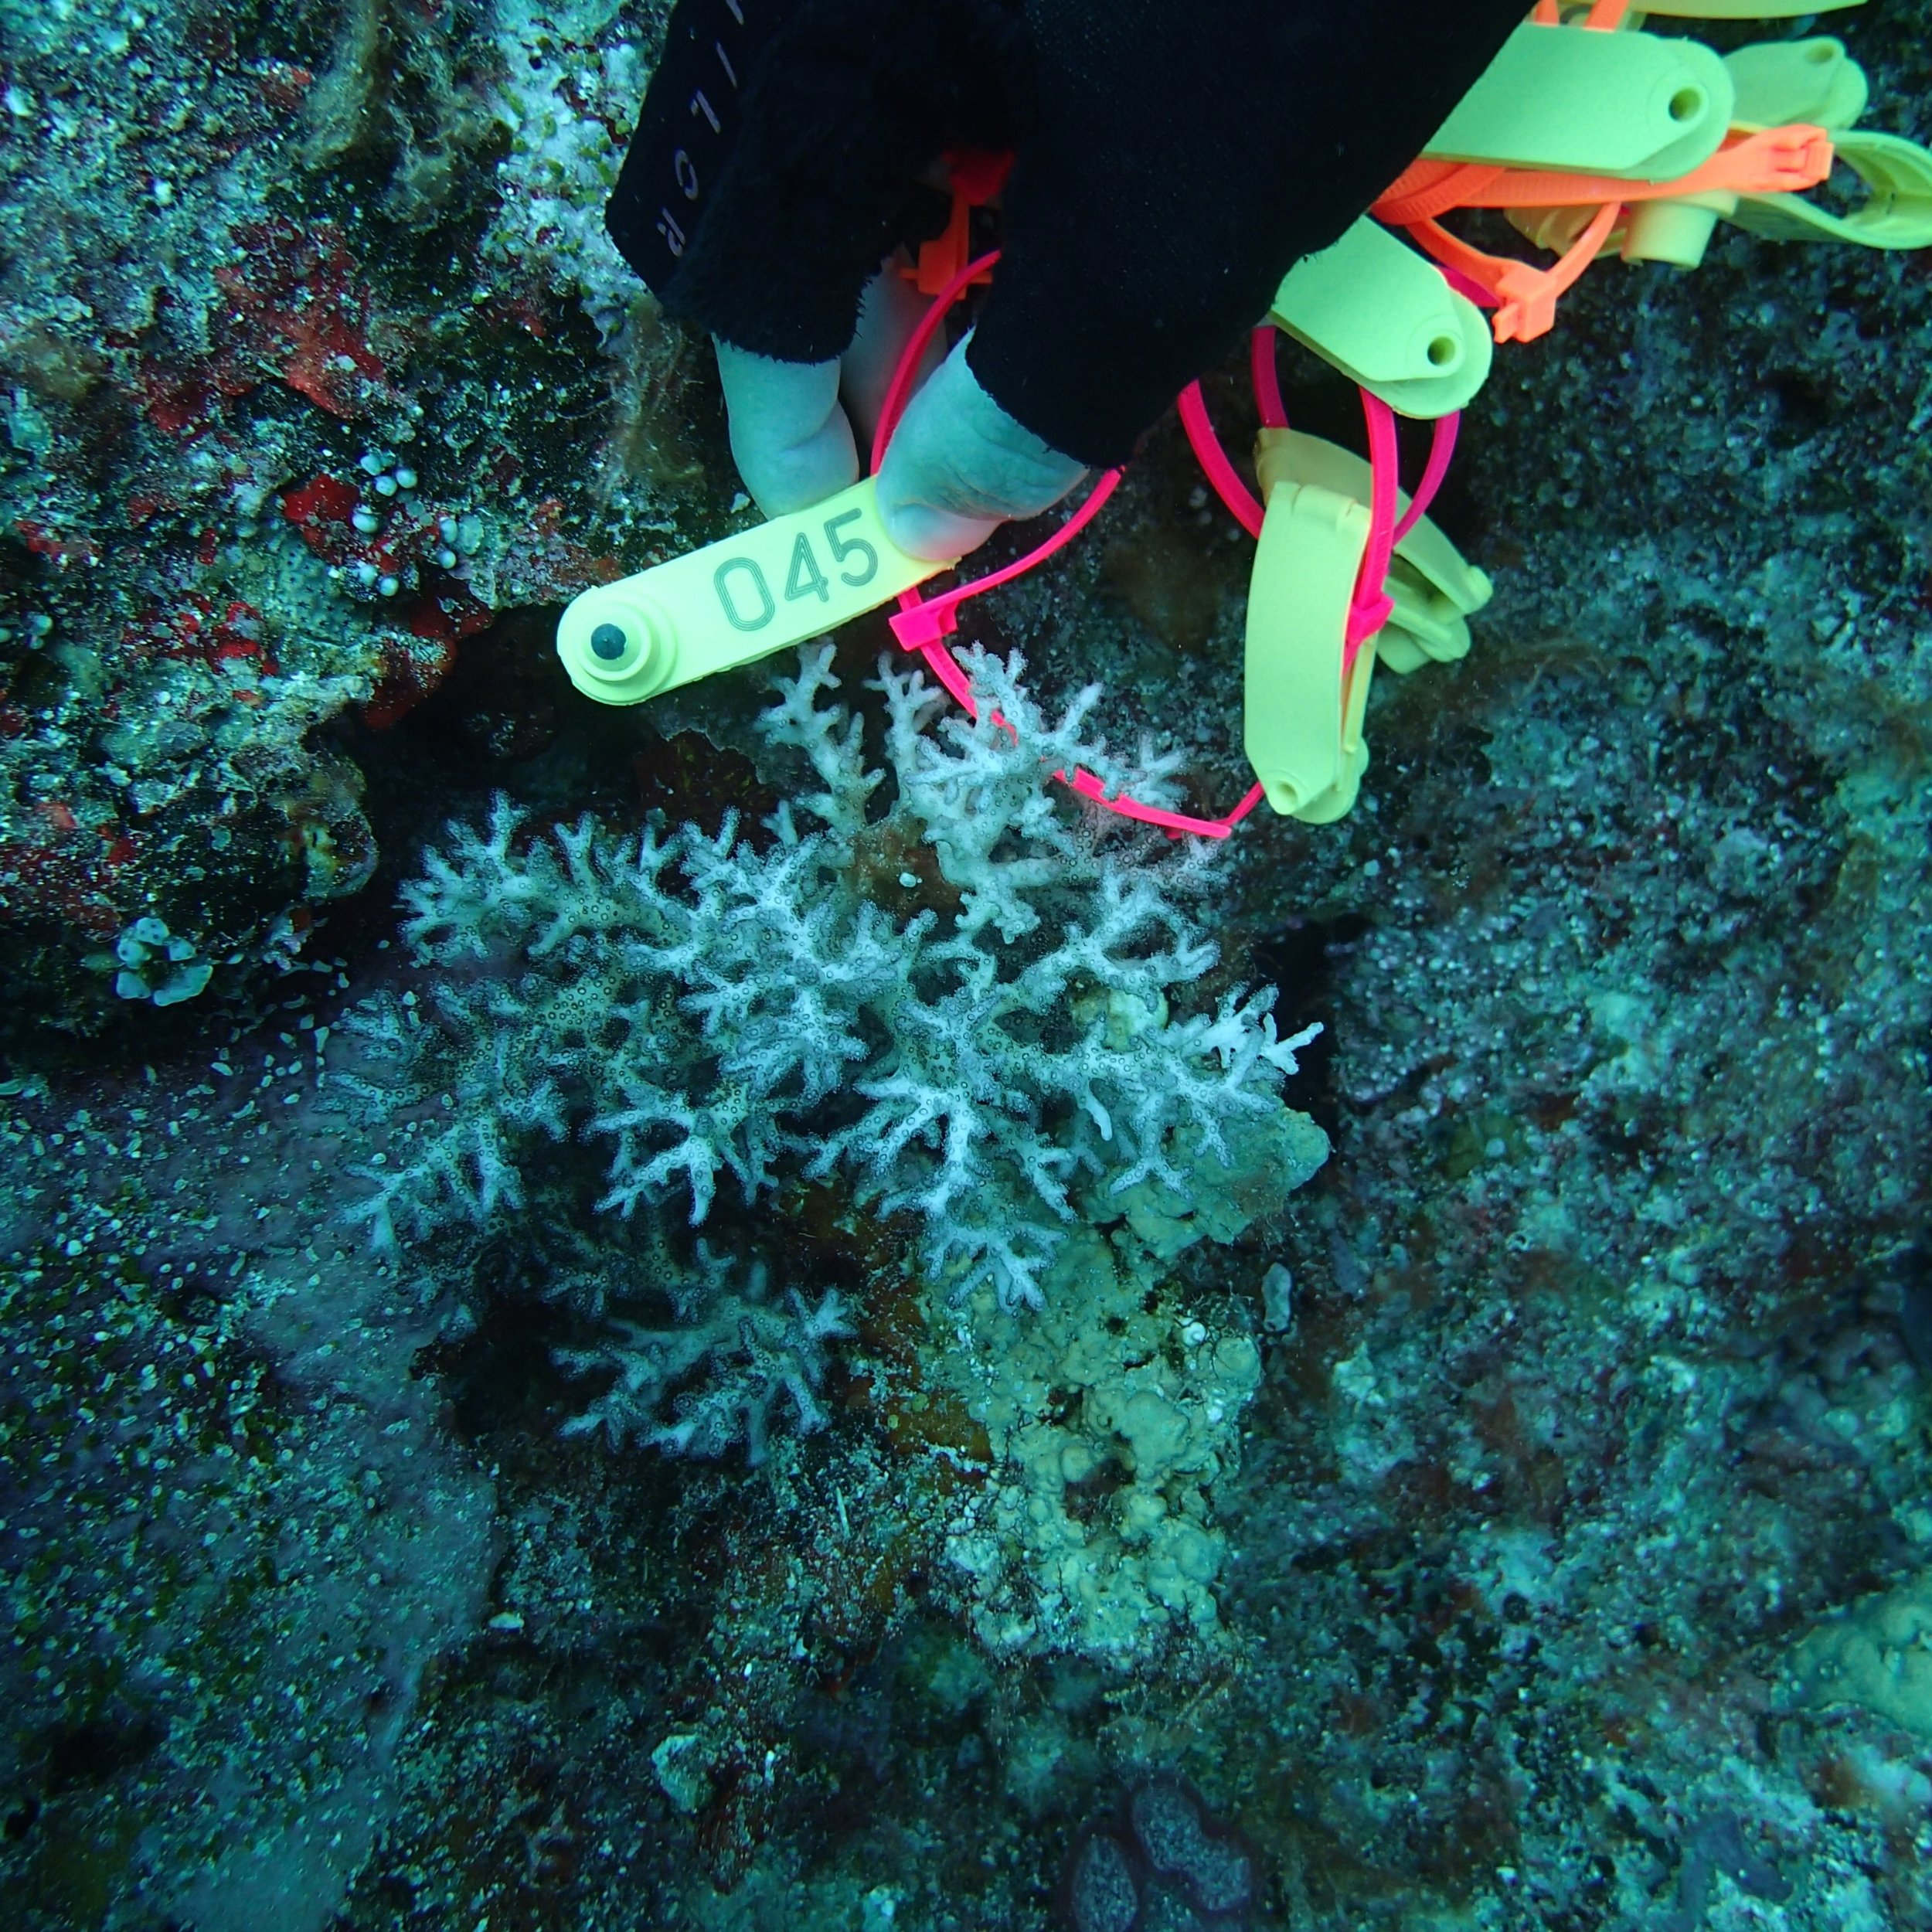
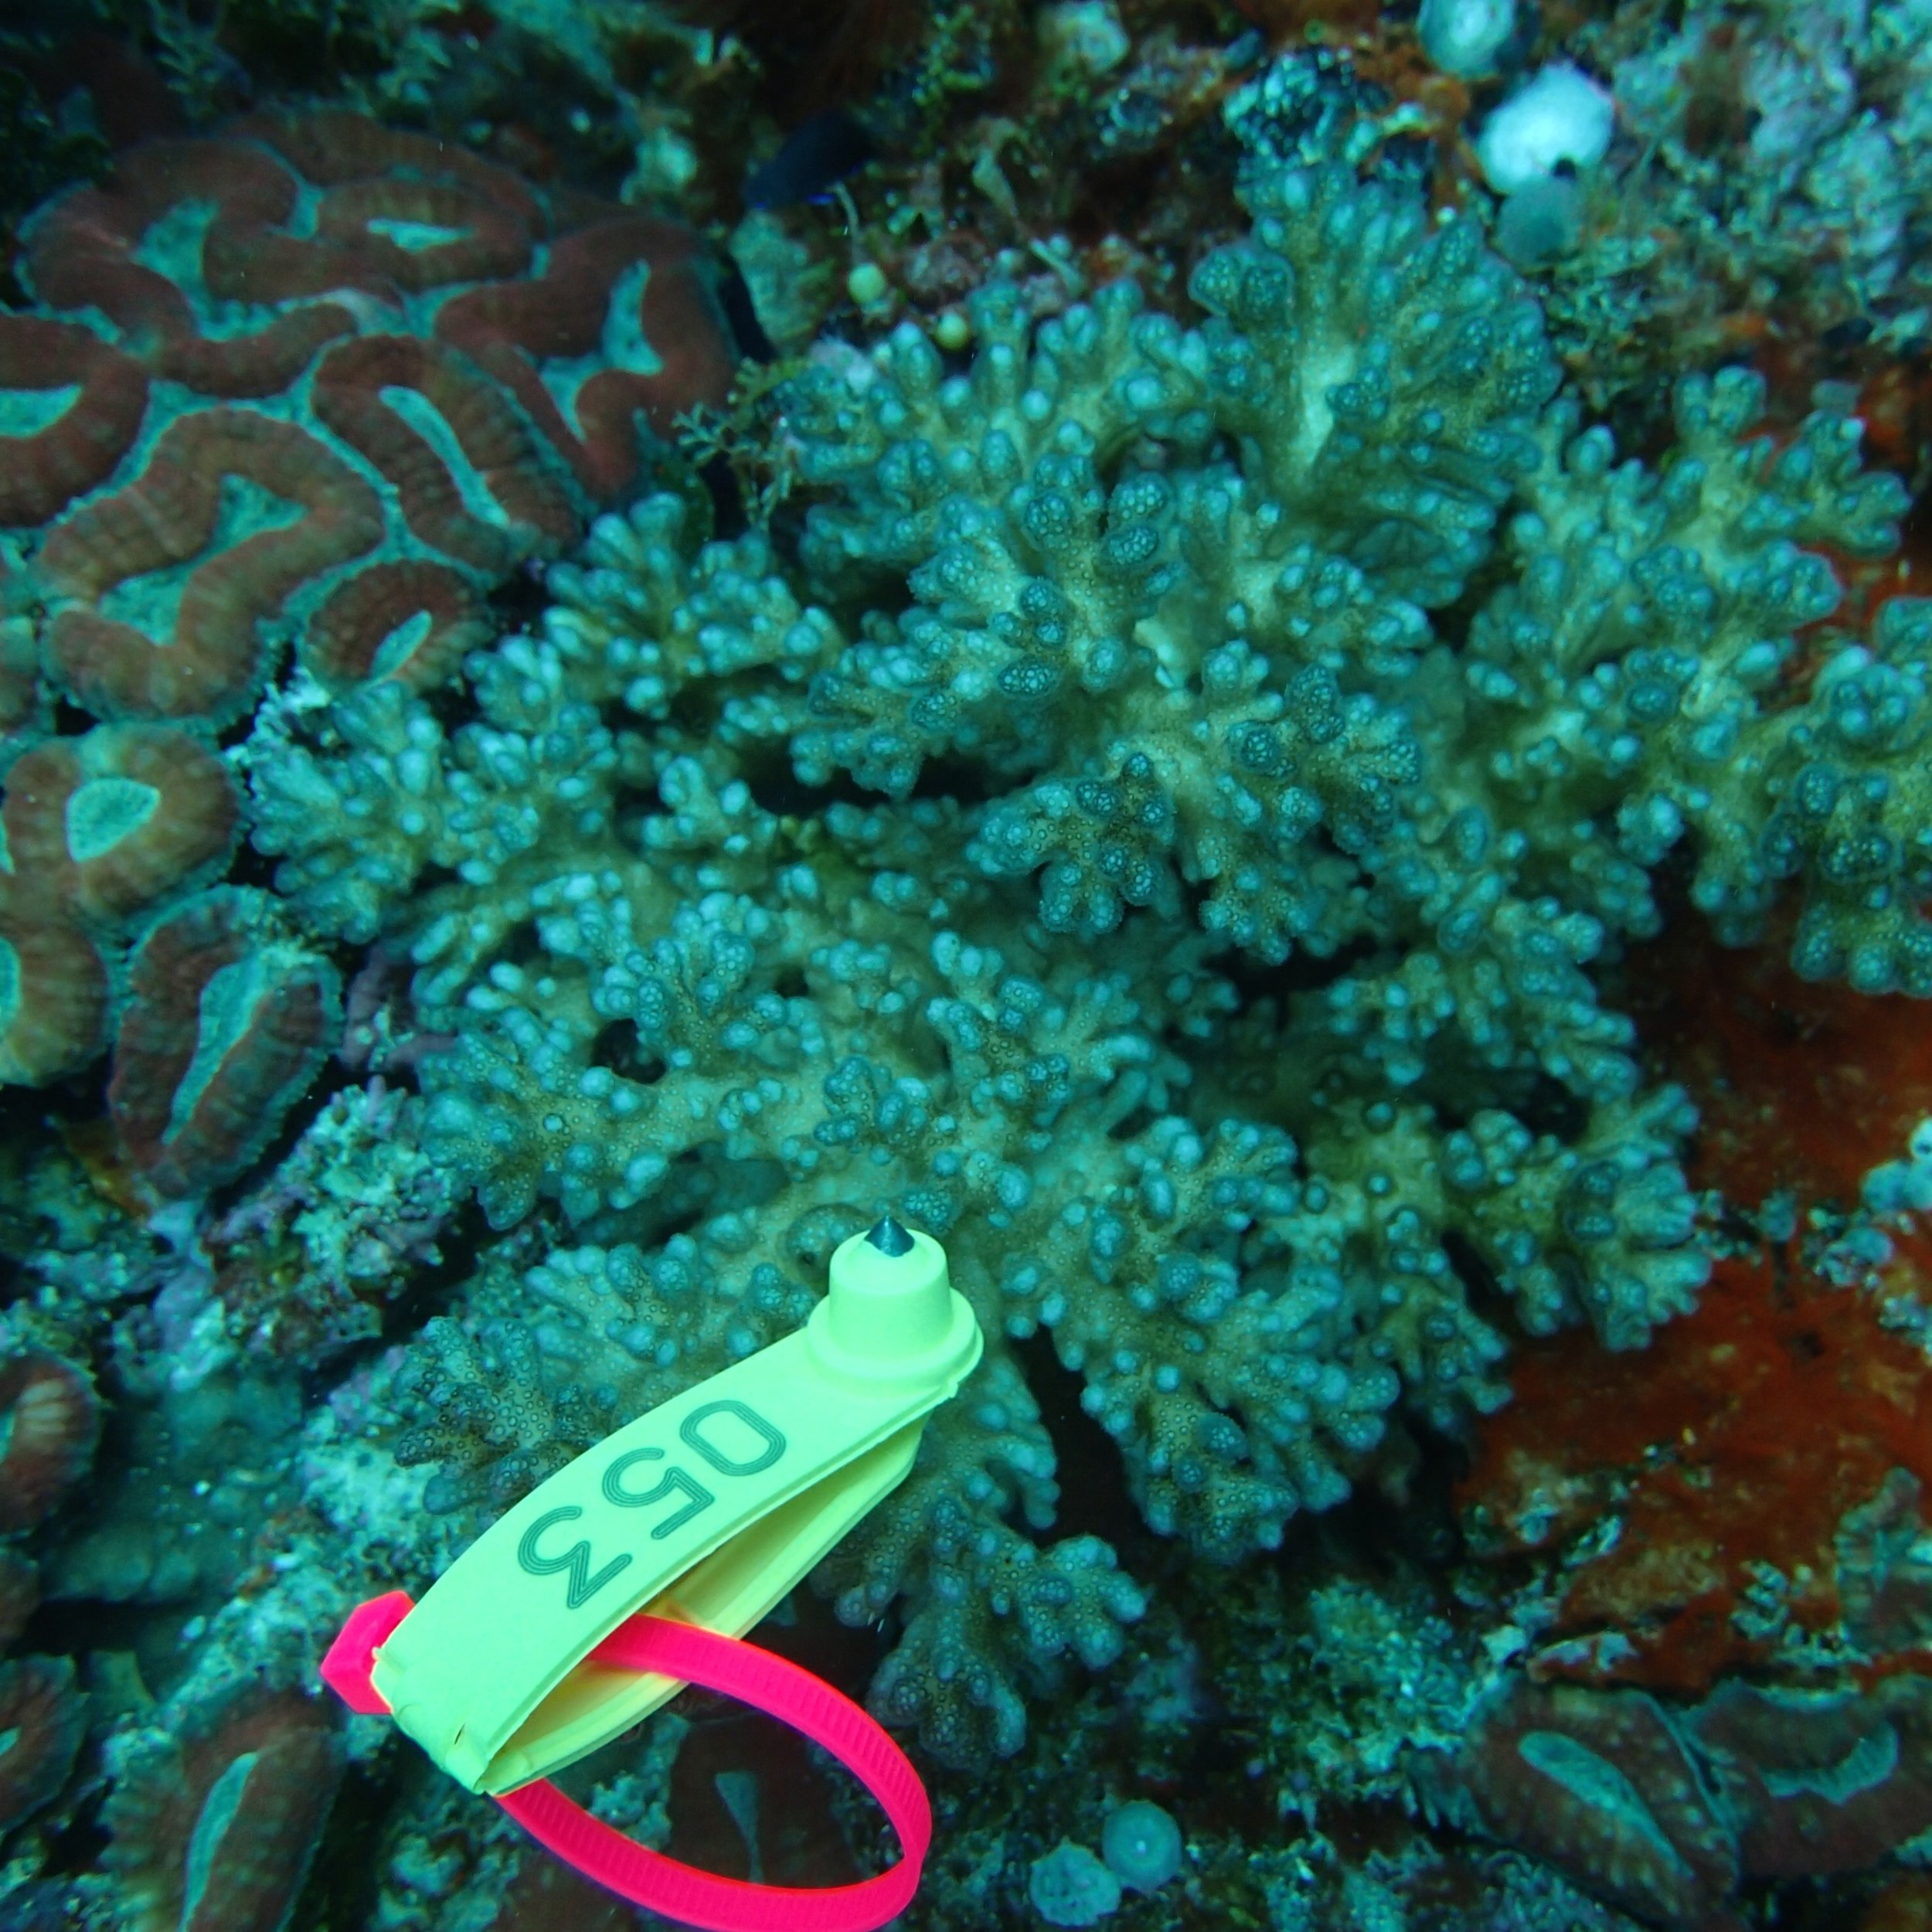
C: I have also overlaid the coral physiological data onto the posted images (as has been done for colonies of other surveyed sites of the “Global Reef Expedition”).
Download all images in a single, ~8-GB Apple Photos library.
Shape files
From groundtruthing efforts and for those who want to make their own maps: dbf prj, shp, shx
Methods
RNAs, DNA, and proteins were extracted from pocilloporid corals as described in this document.
Permits
Permit application with sampling strategy outlined
CITES permit
Samples
Here is a list of the samples I have (available to share). Please note that, although 104 unique colonies were sampled, there are over 150 samples given that many colonies were sampled both during the day and at night. My goal is to uncover proteomic differences over the diel cycle. One thing I like about molecular biology? Only about 16 grams of coral were sacrificed!
Here are the samples Dr. Nikki Traylor-Knowles will analyze to determine whether any of these corals possess gene loci known to underlie high temperature tolerance. I have also sent DNAs from the 20 Pocillopora acuta samples to Dr. Ben Wainwright of the Reef Ecology Lab of Drs. Loke Ming Chou and Danwei Huang at the National University of Singapore, where population genetic (host and Symbiodiniaceae dinoflagellate) and microbial profiling analyses will be undertaken (part of a much larger study being carried out with P. acuta samples from across the Indo-Pacific).
Genotyping

Of the 101 pocilloporid corals genotyped, 21 and 80 were P. acuta and P. damicornis, respectively. This is one of the few countries I have dived where the latter is more common than the former.
I have the molecular data organized in a plethora of ways.
Samples in order for heat map.
New Caledonia dataset with imputed data.
New Caledonia data exploration-Pocillopora damicornis samples only. This analysis will form the basis of the second manuscript I intend to publish.
New Caledonia samples-P. damicornis only (minus the 8 outliers).
New Caledonia light-dark samples (with imputation) in matched pairs format.
New Caledonia light-dark samples (no imputation) in matched pairs format.
New Caledonia data exploration-both species (Pdam and P. acuta).
Here is a compressed folder containing all of the mitochondrial open reading frame sequences; unlike other countries of the South Pacific, the vast majority of the New Caledonia samples were actually Pocillopora damicornis (not P. acuta).
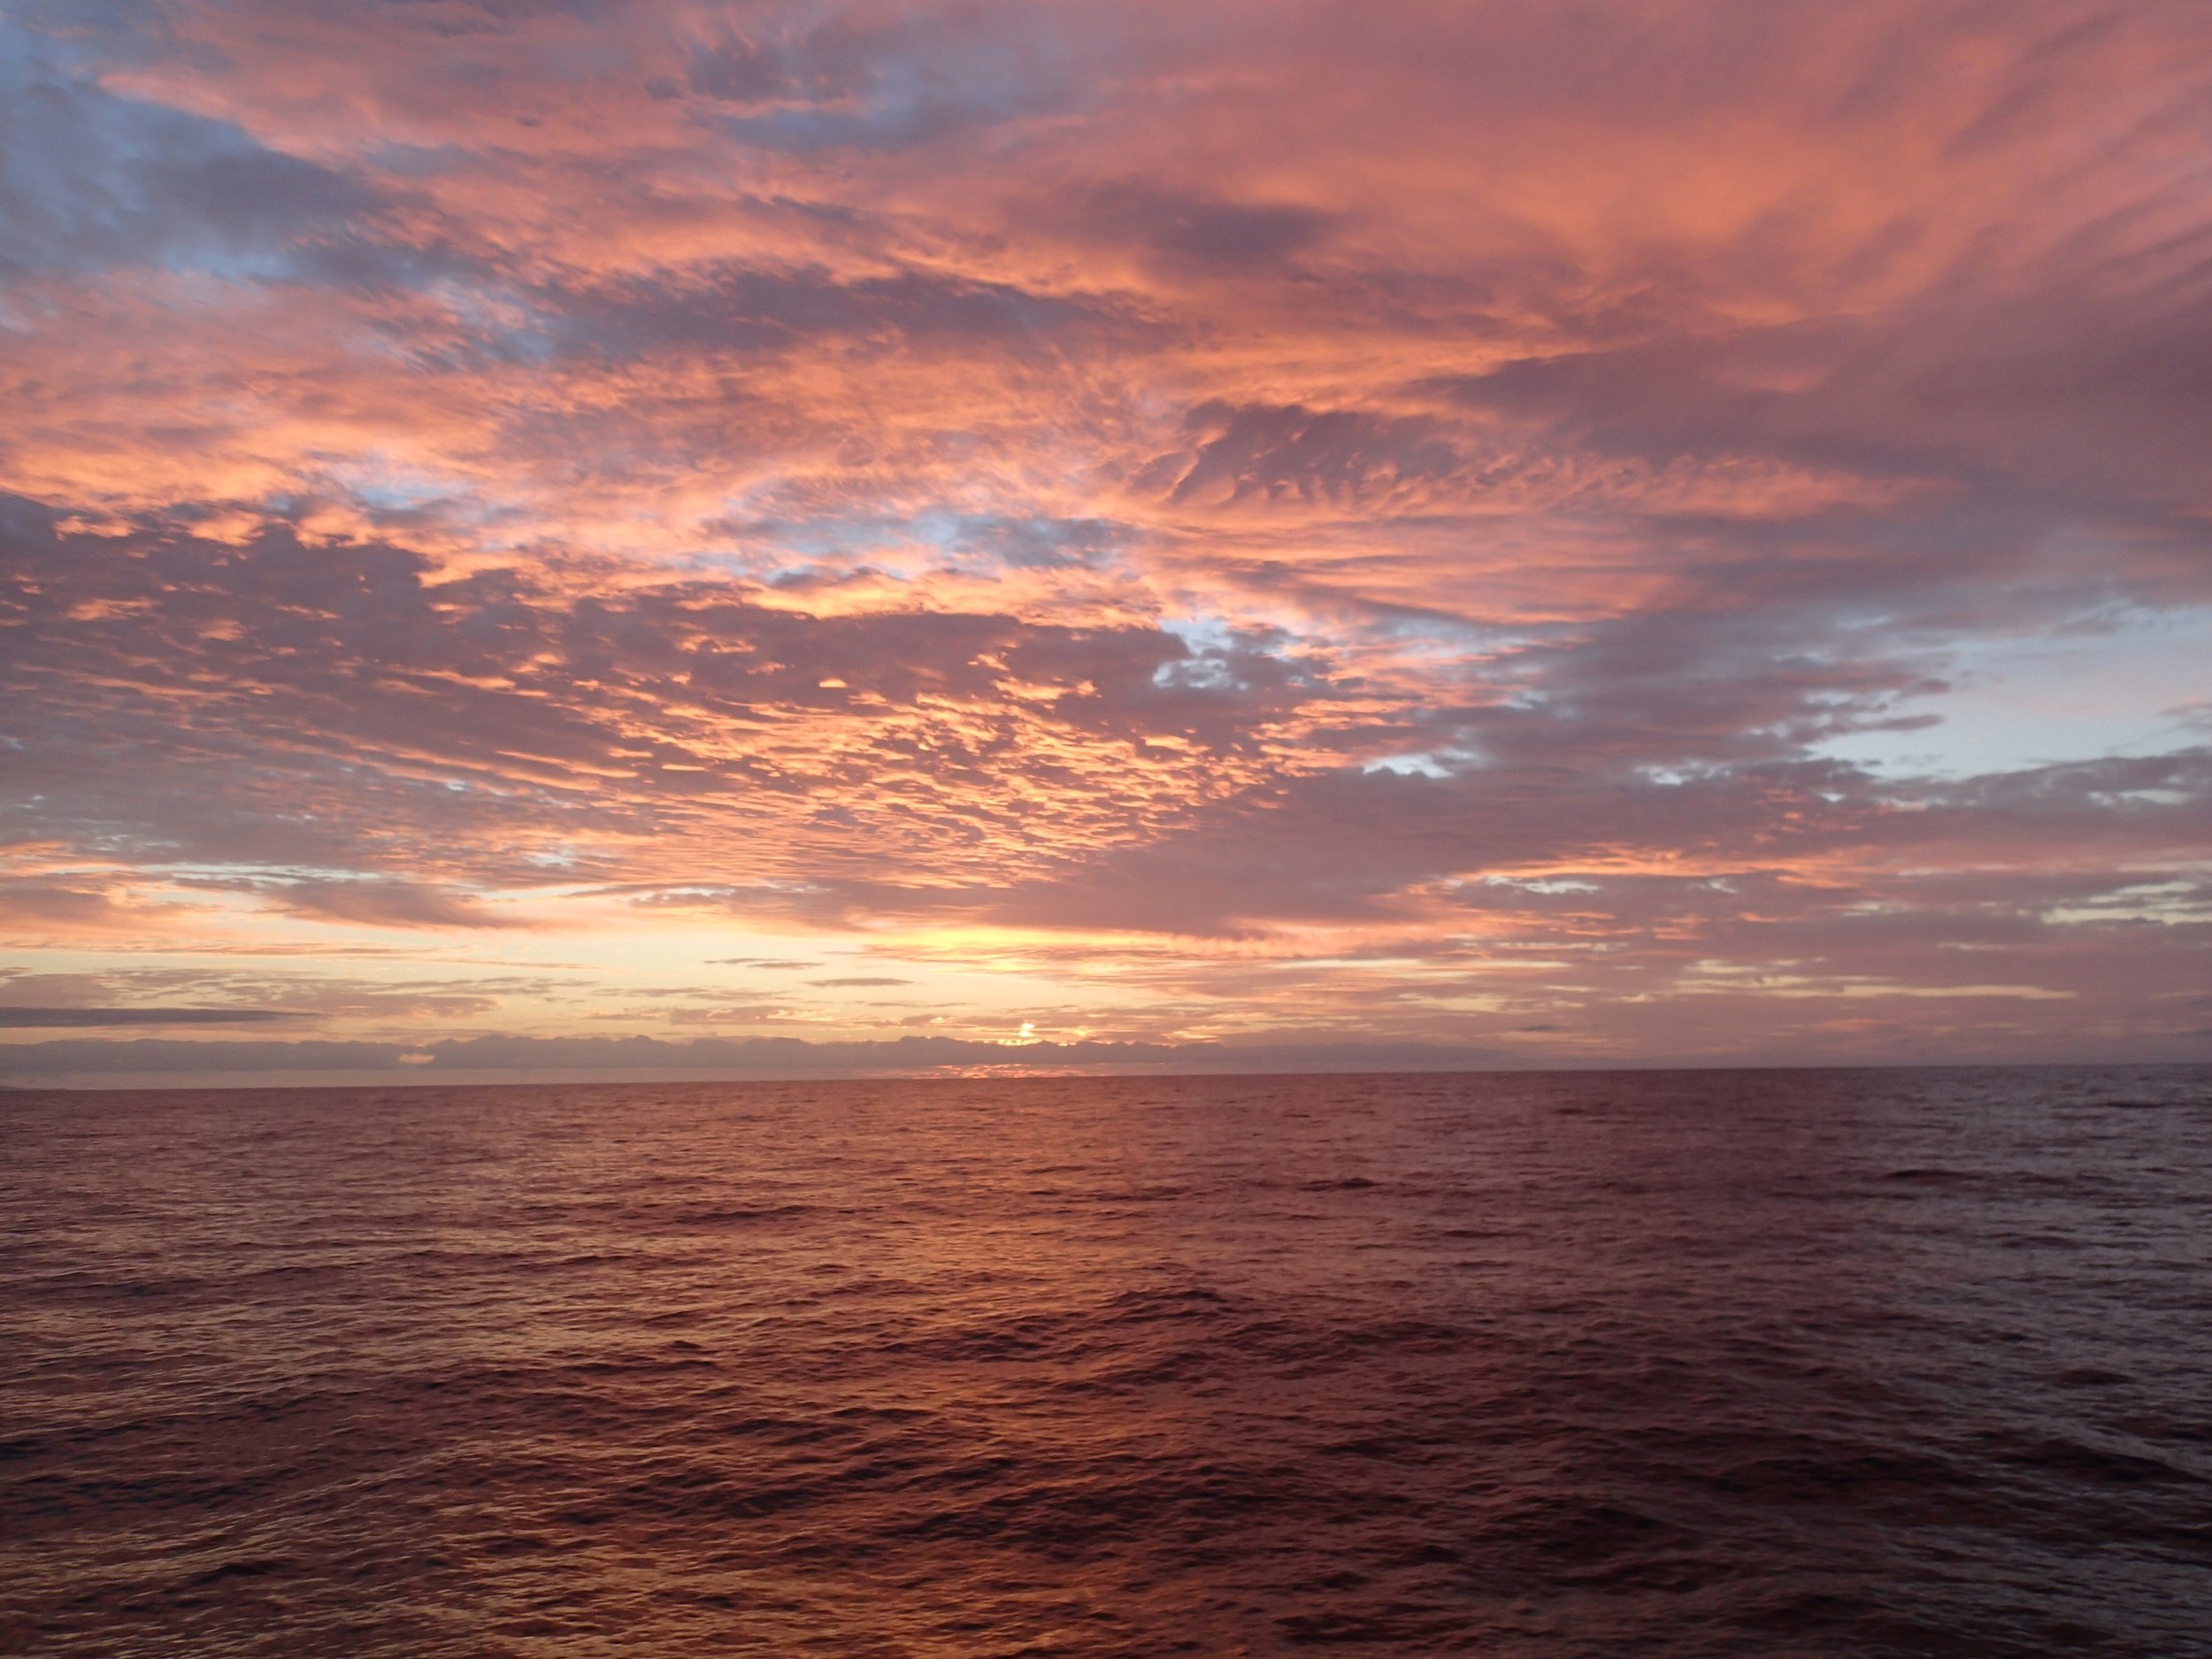
A couple of epic sunset shots from New Cal to spruce up this drab, data-heavy page:
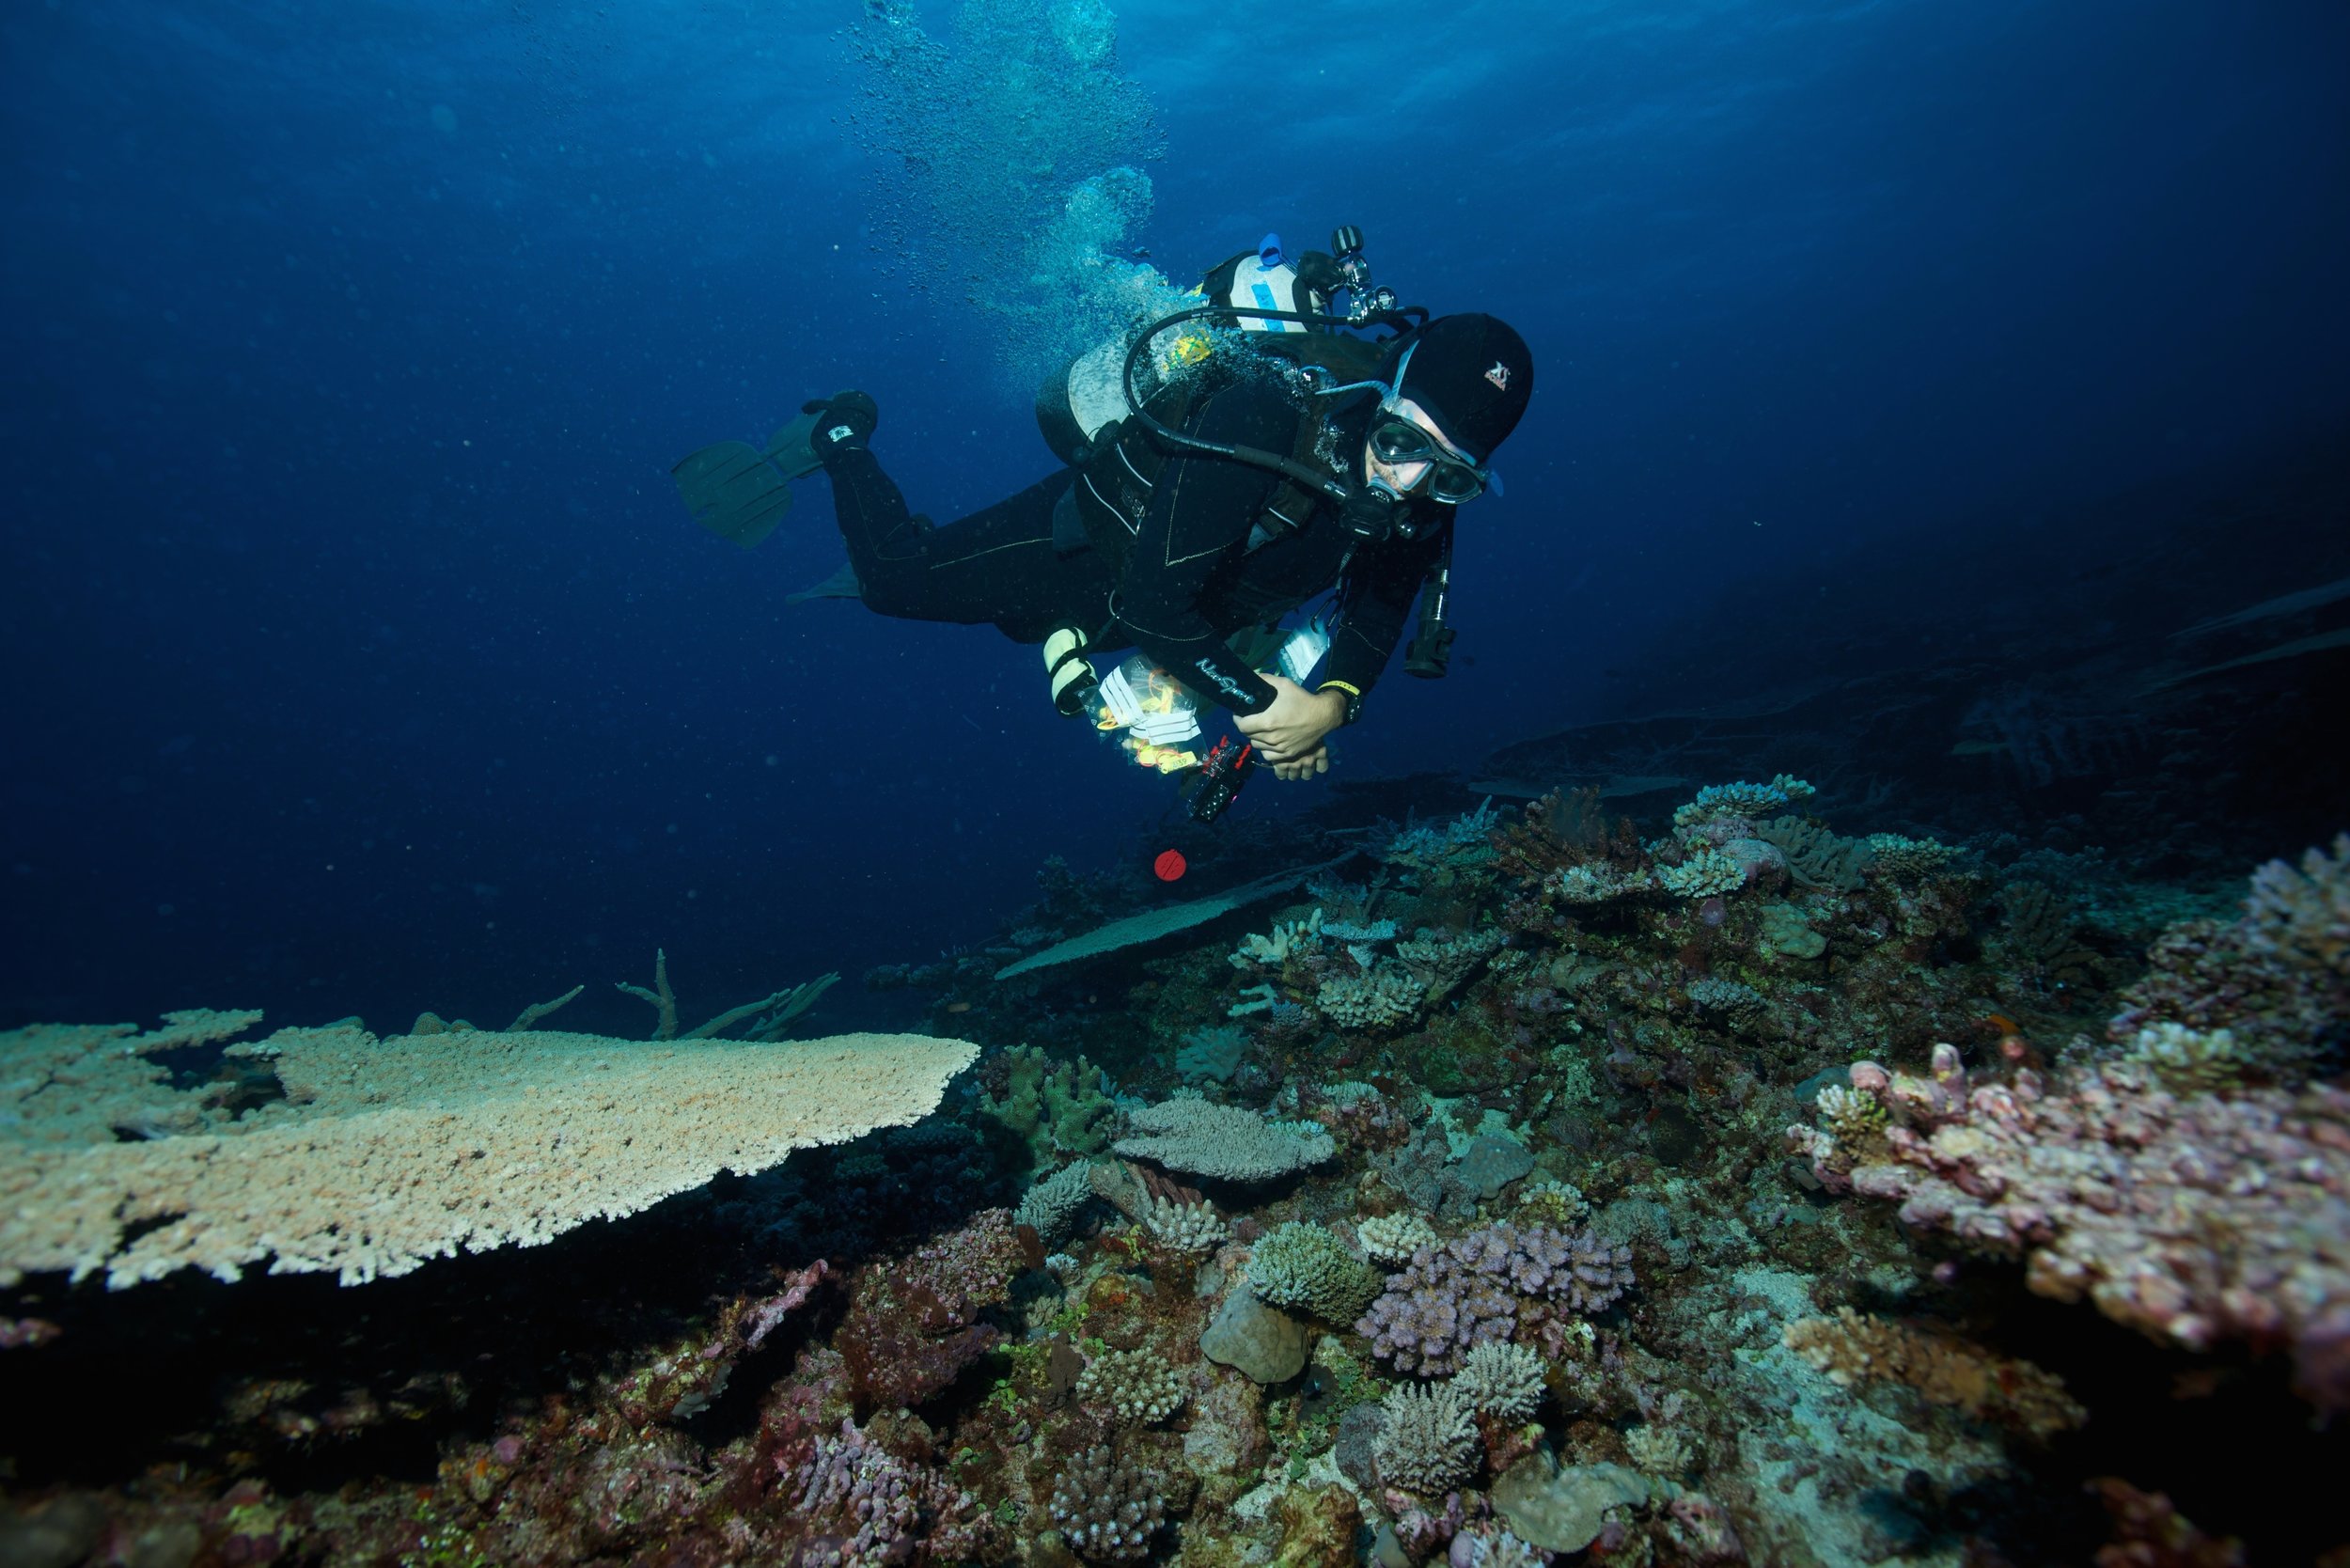
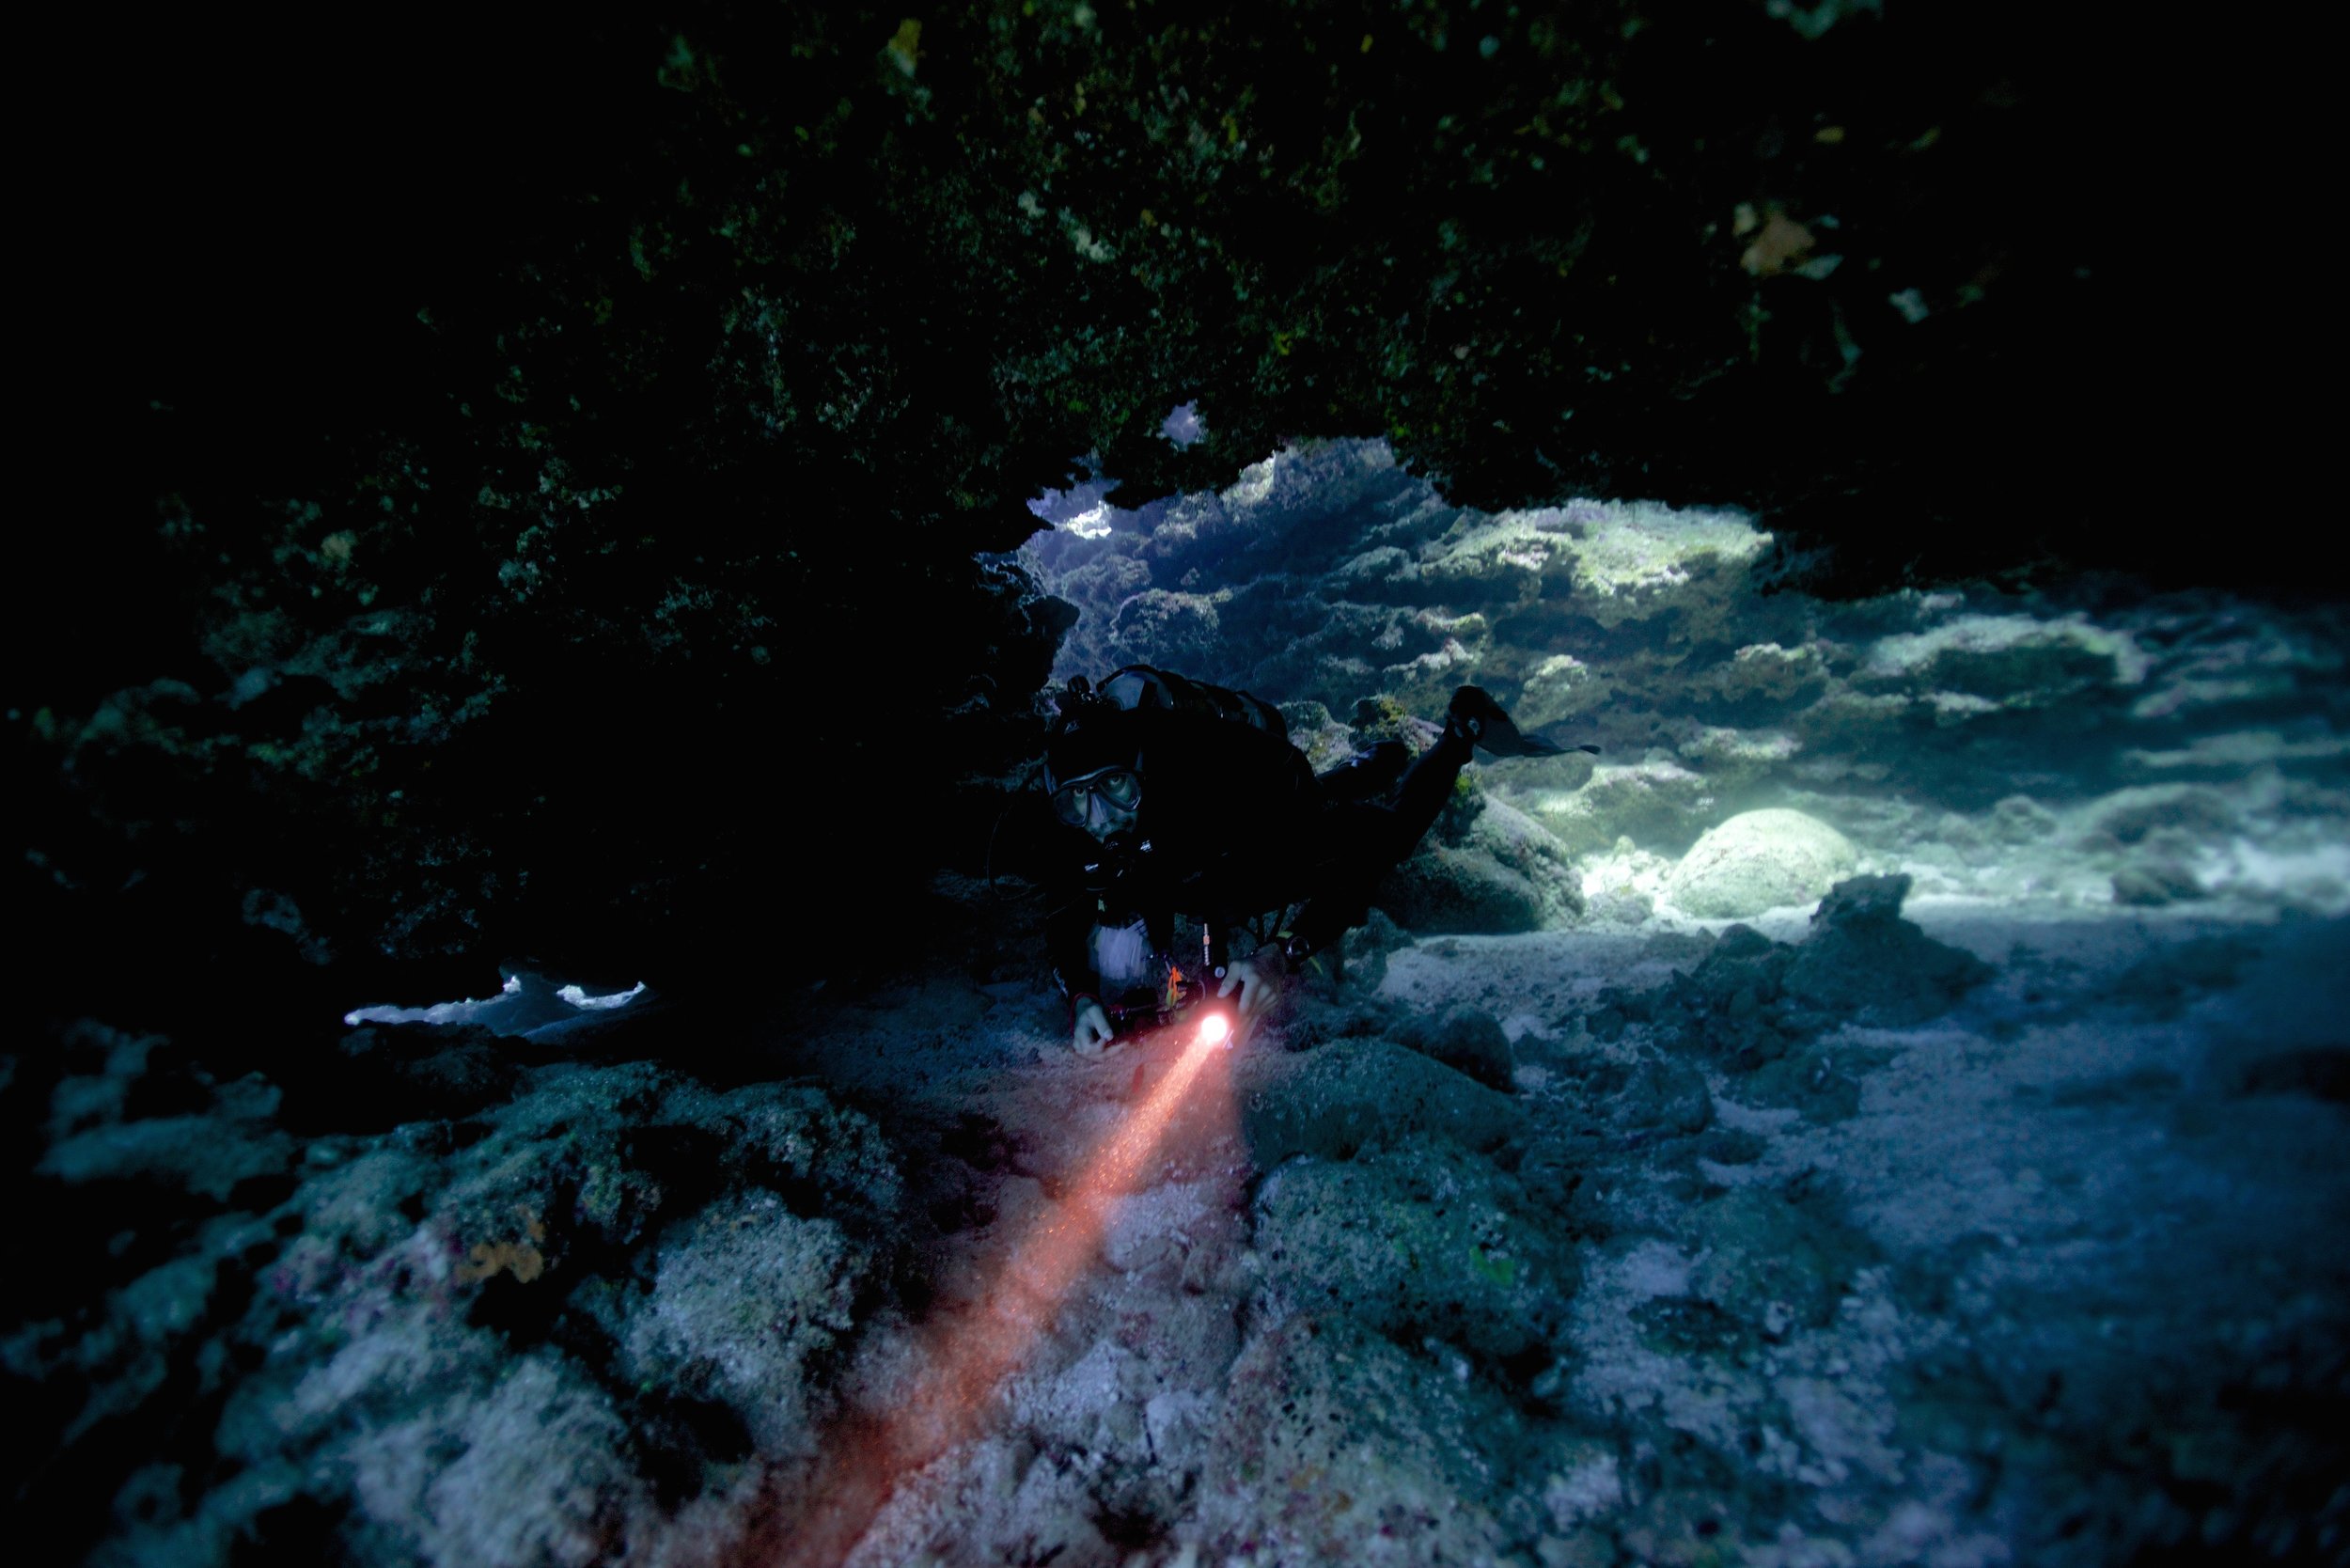
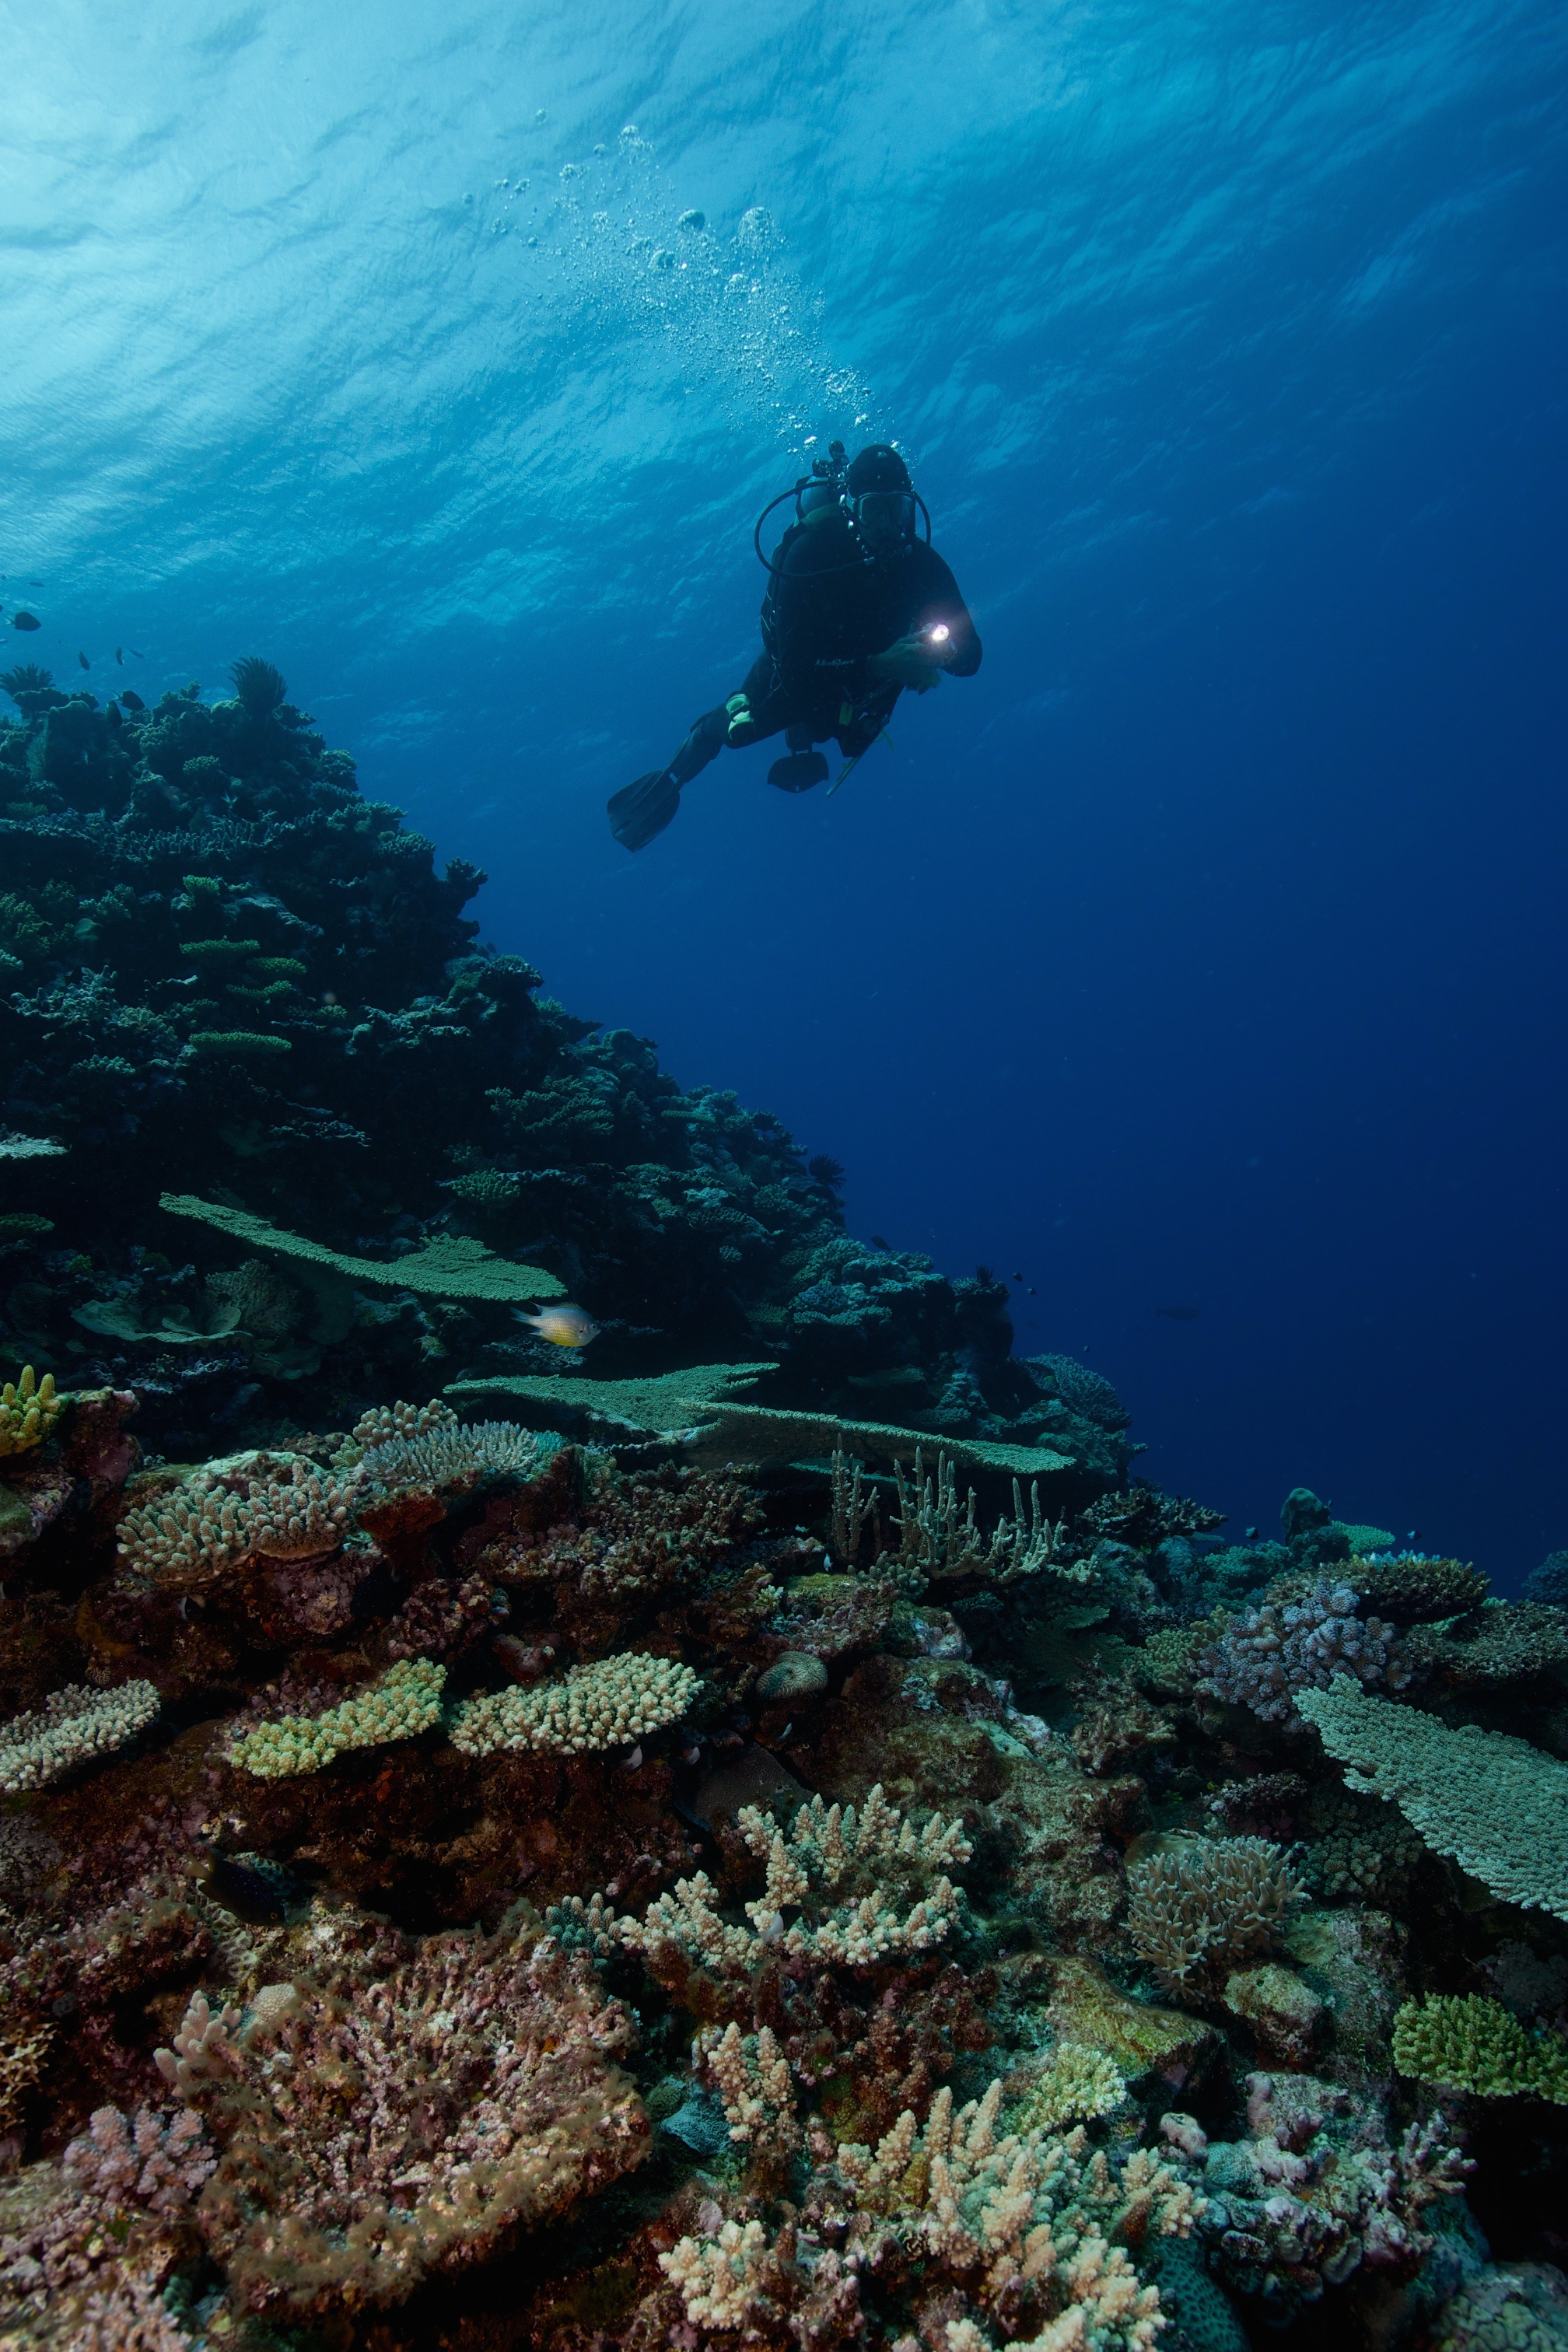
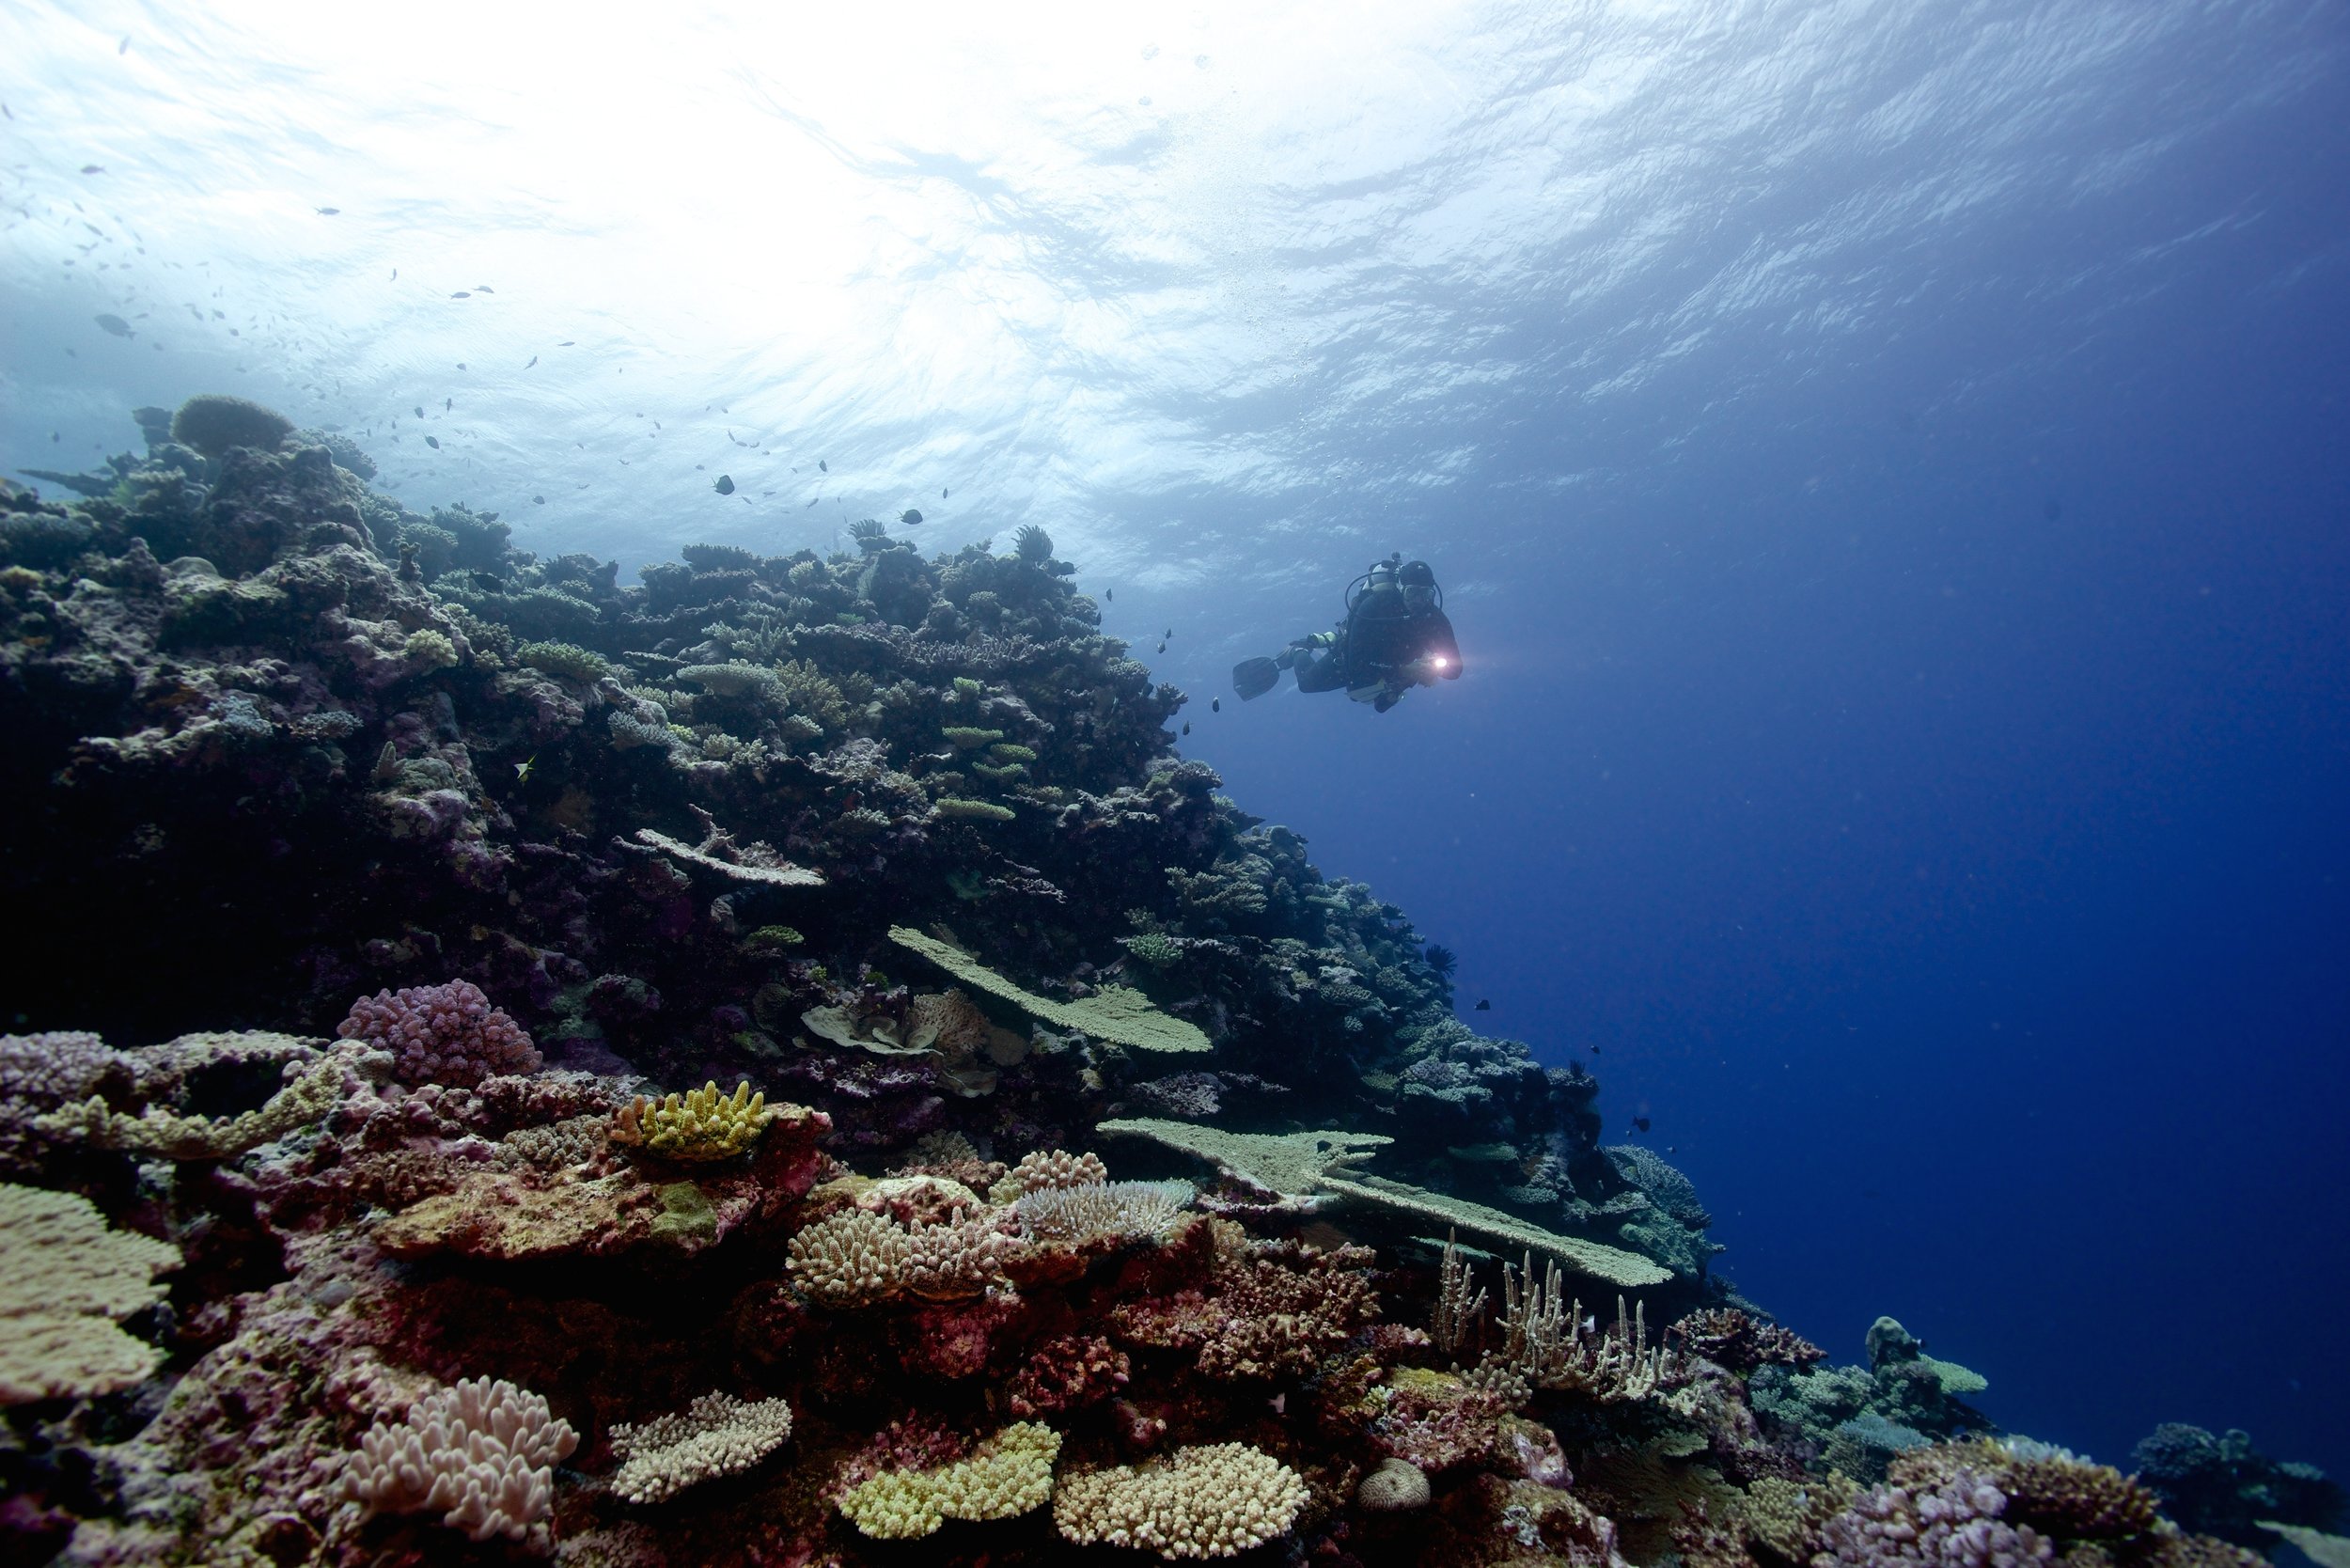
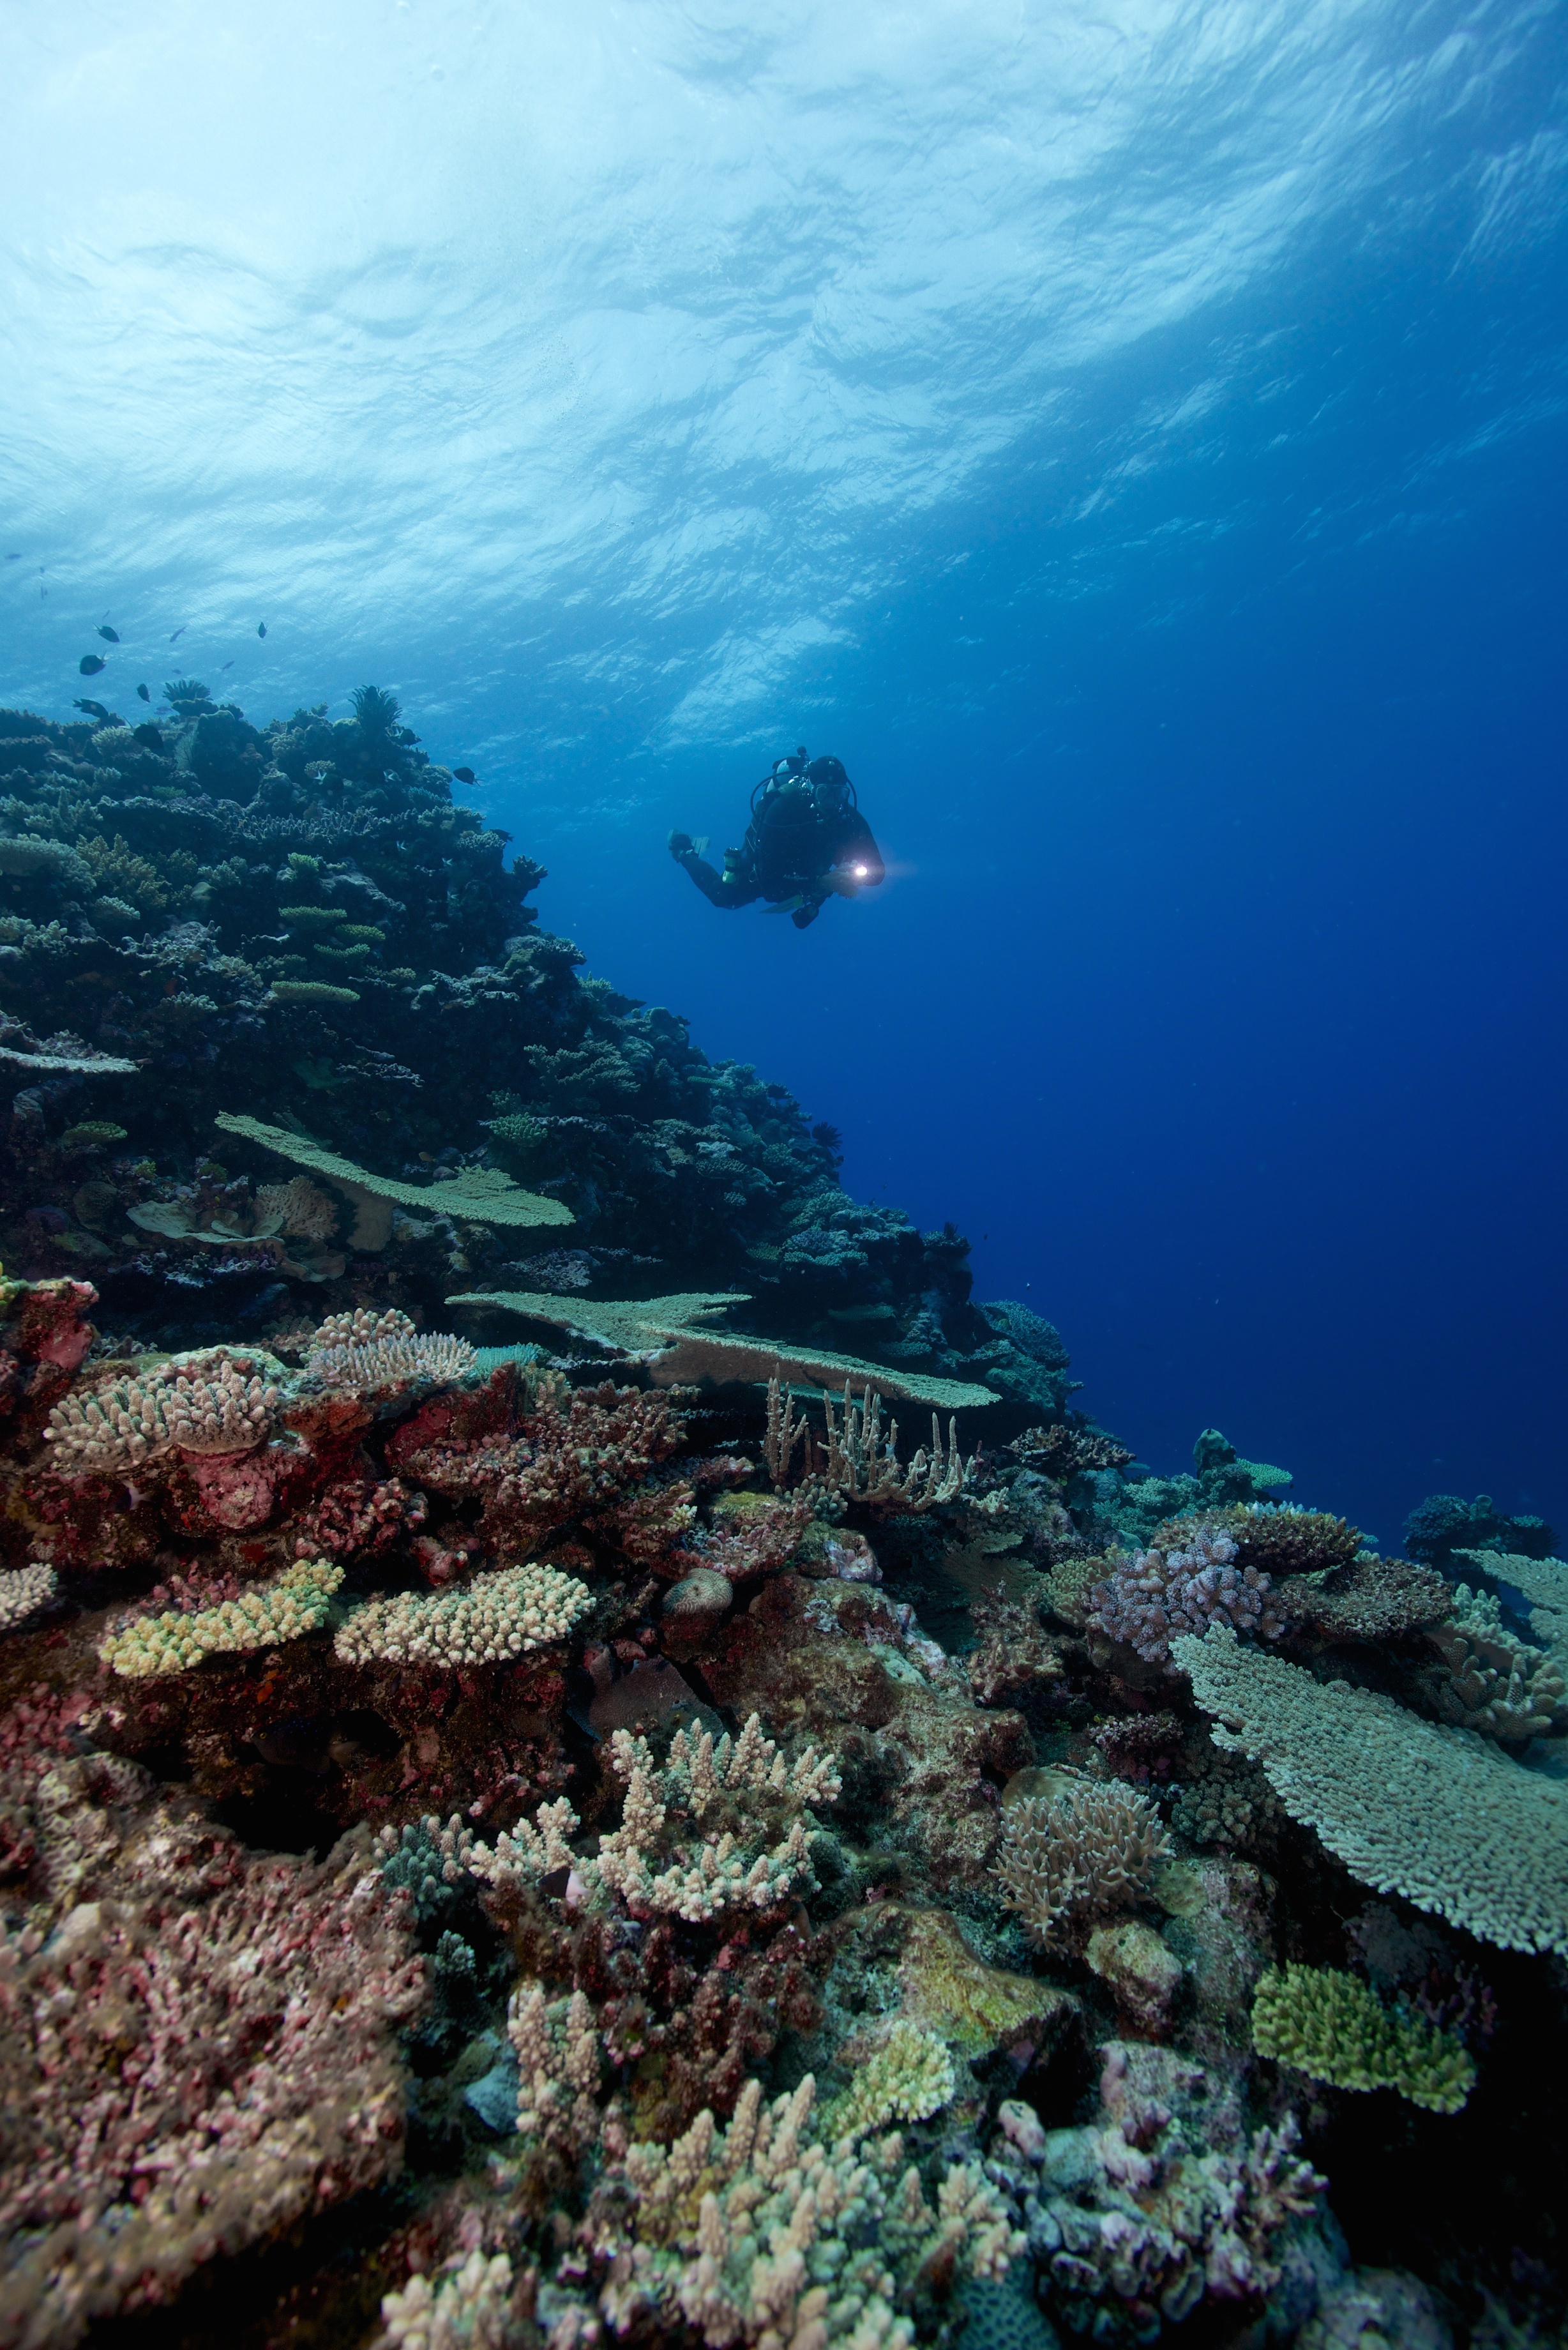
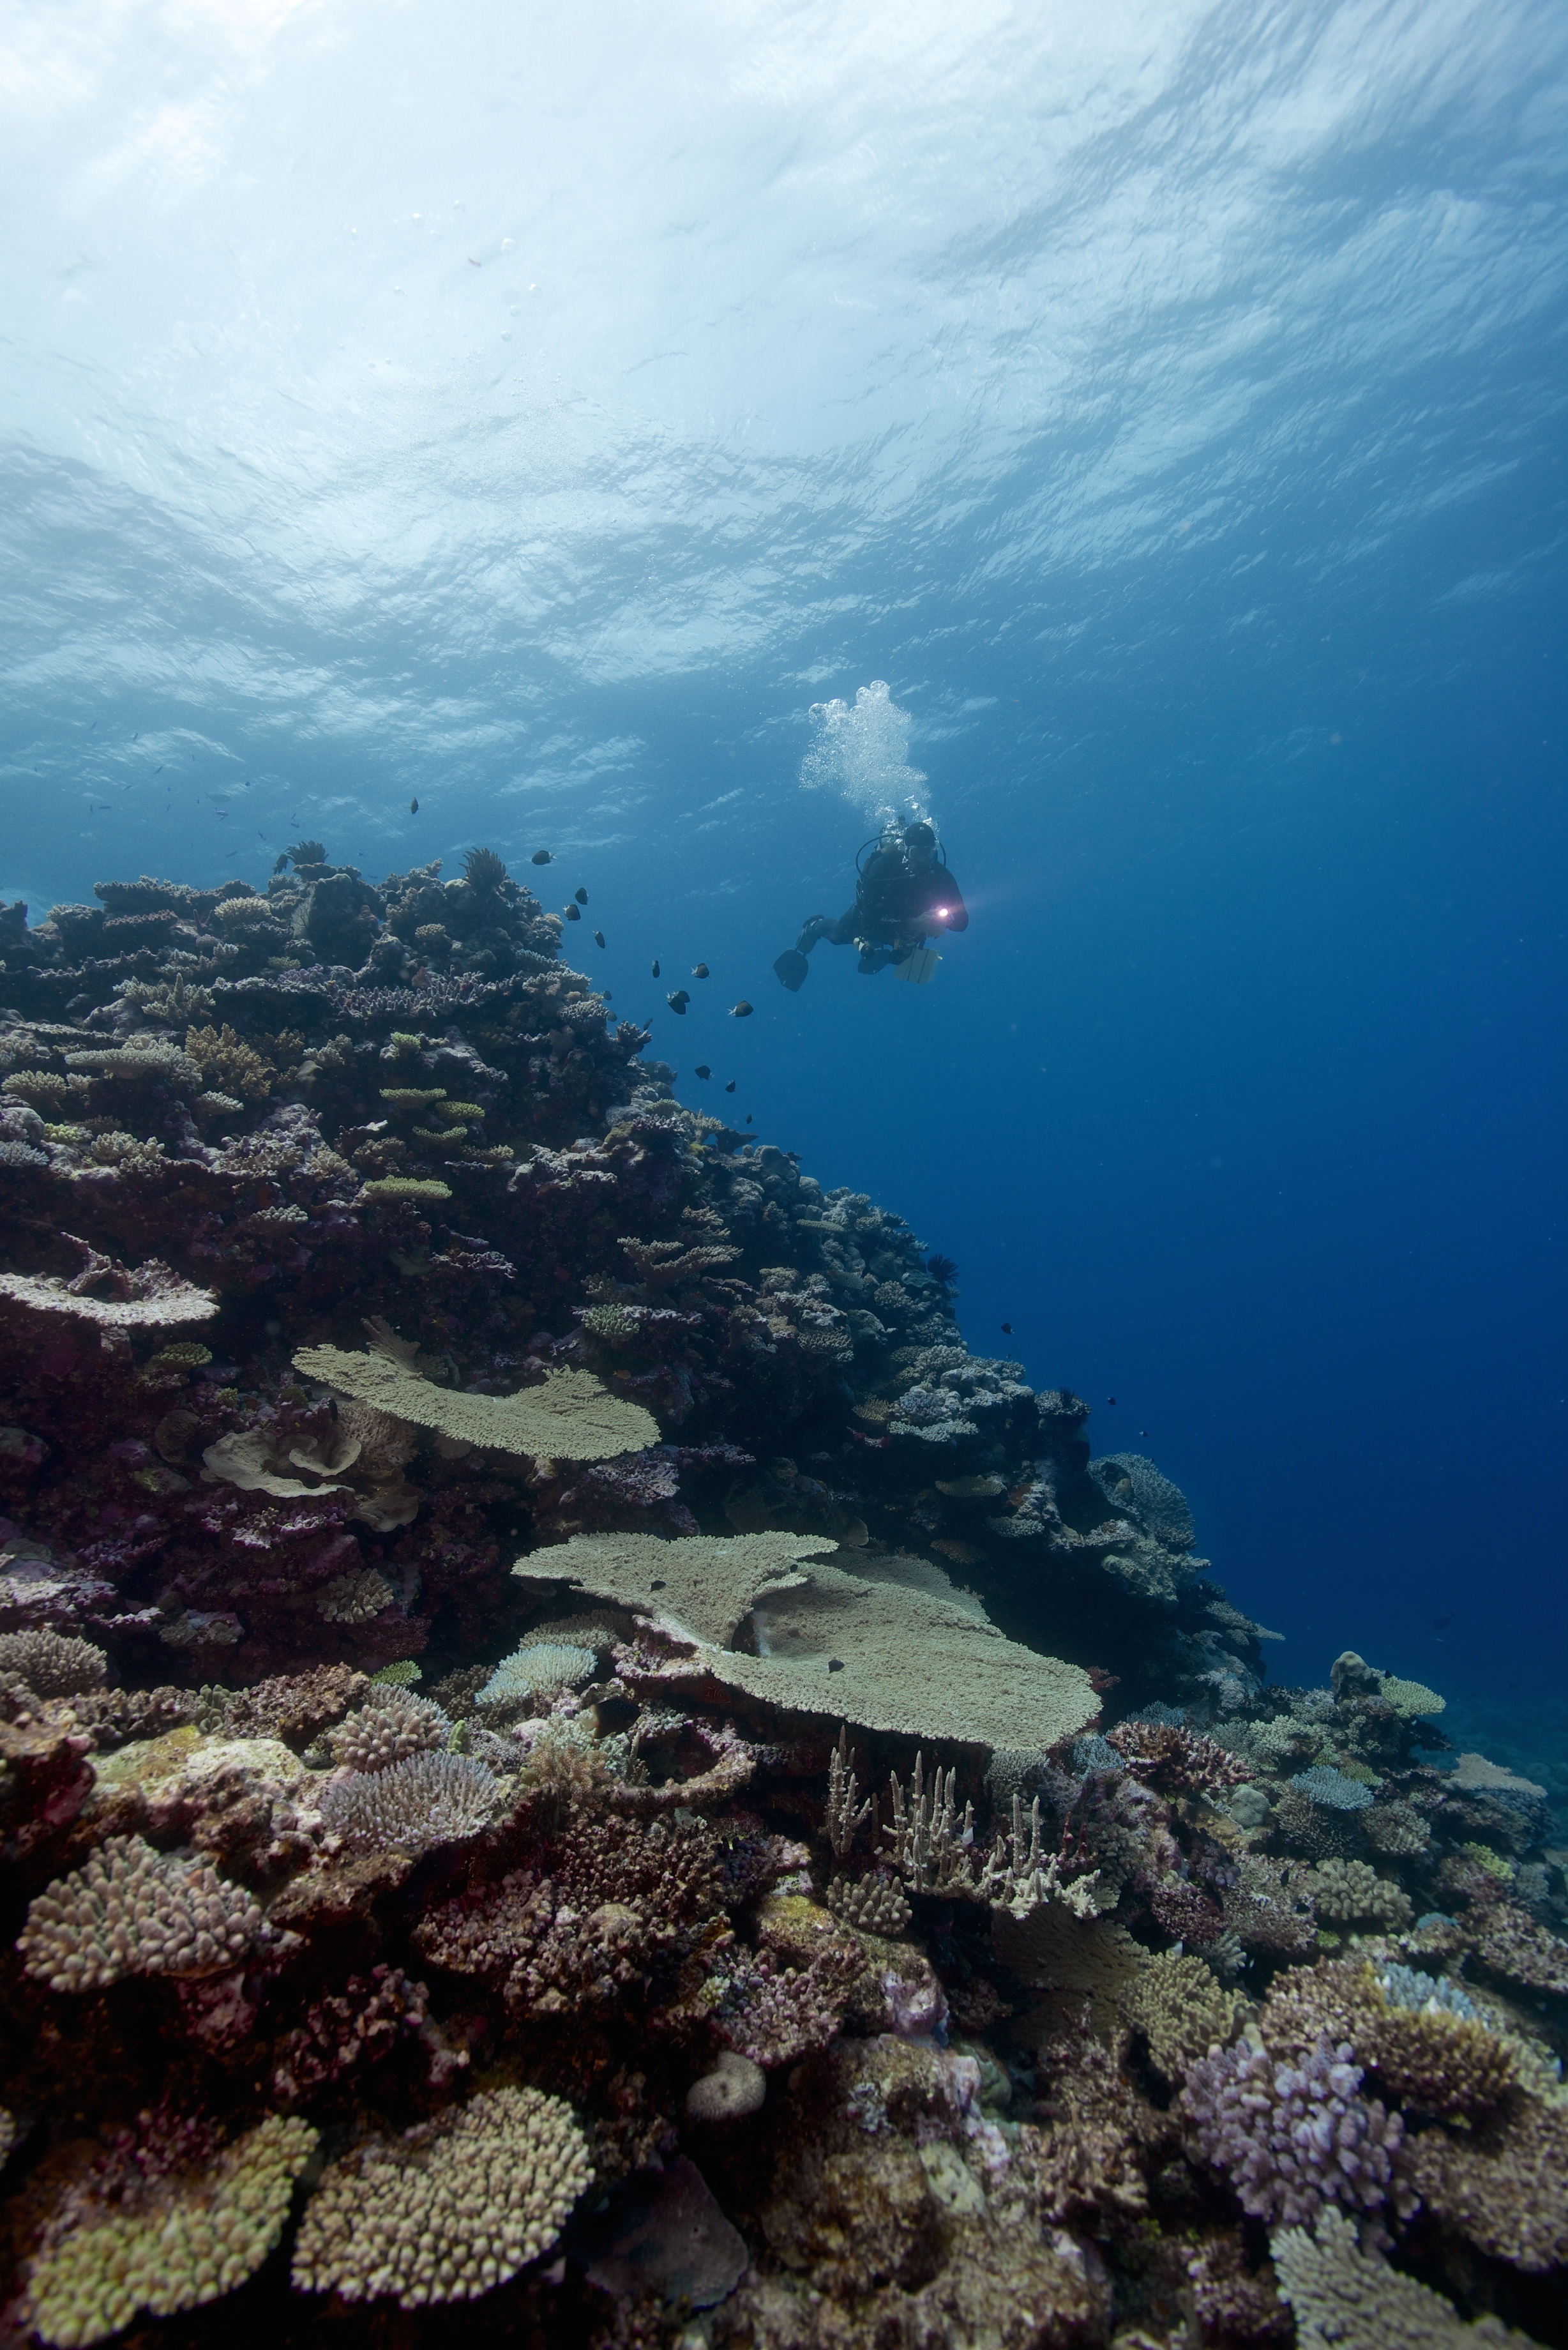
The excellent shots below (of me) were taken by Dr. Joao Monteiro (University of the Azores). I normally hate photos of myself, but these are among the rare exceptions.


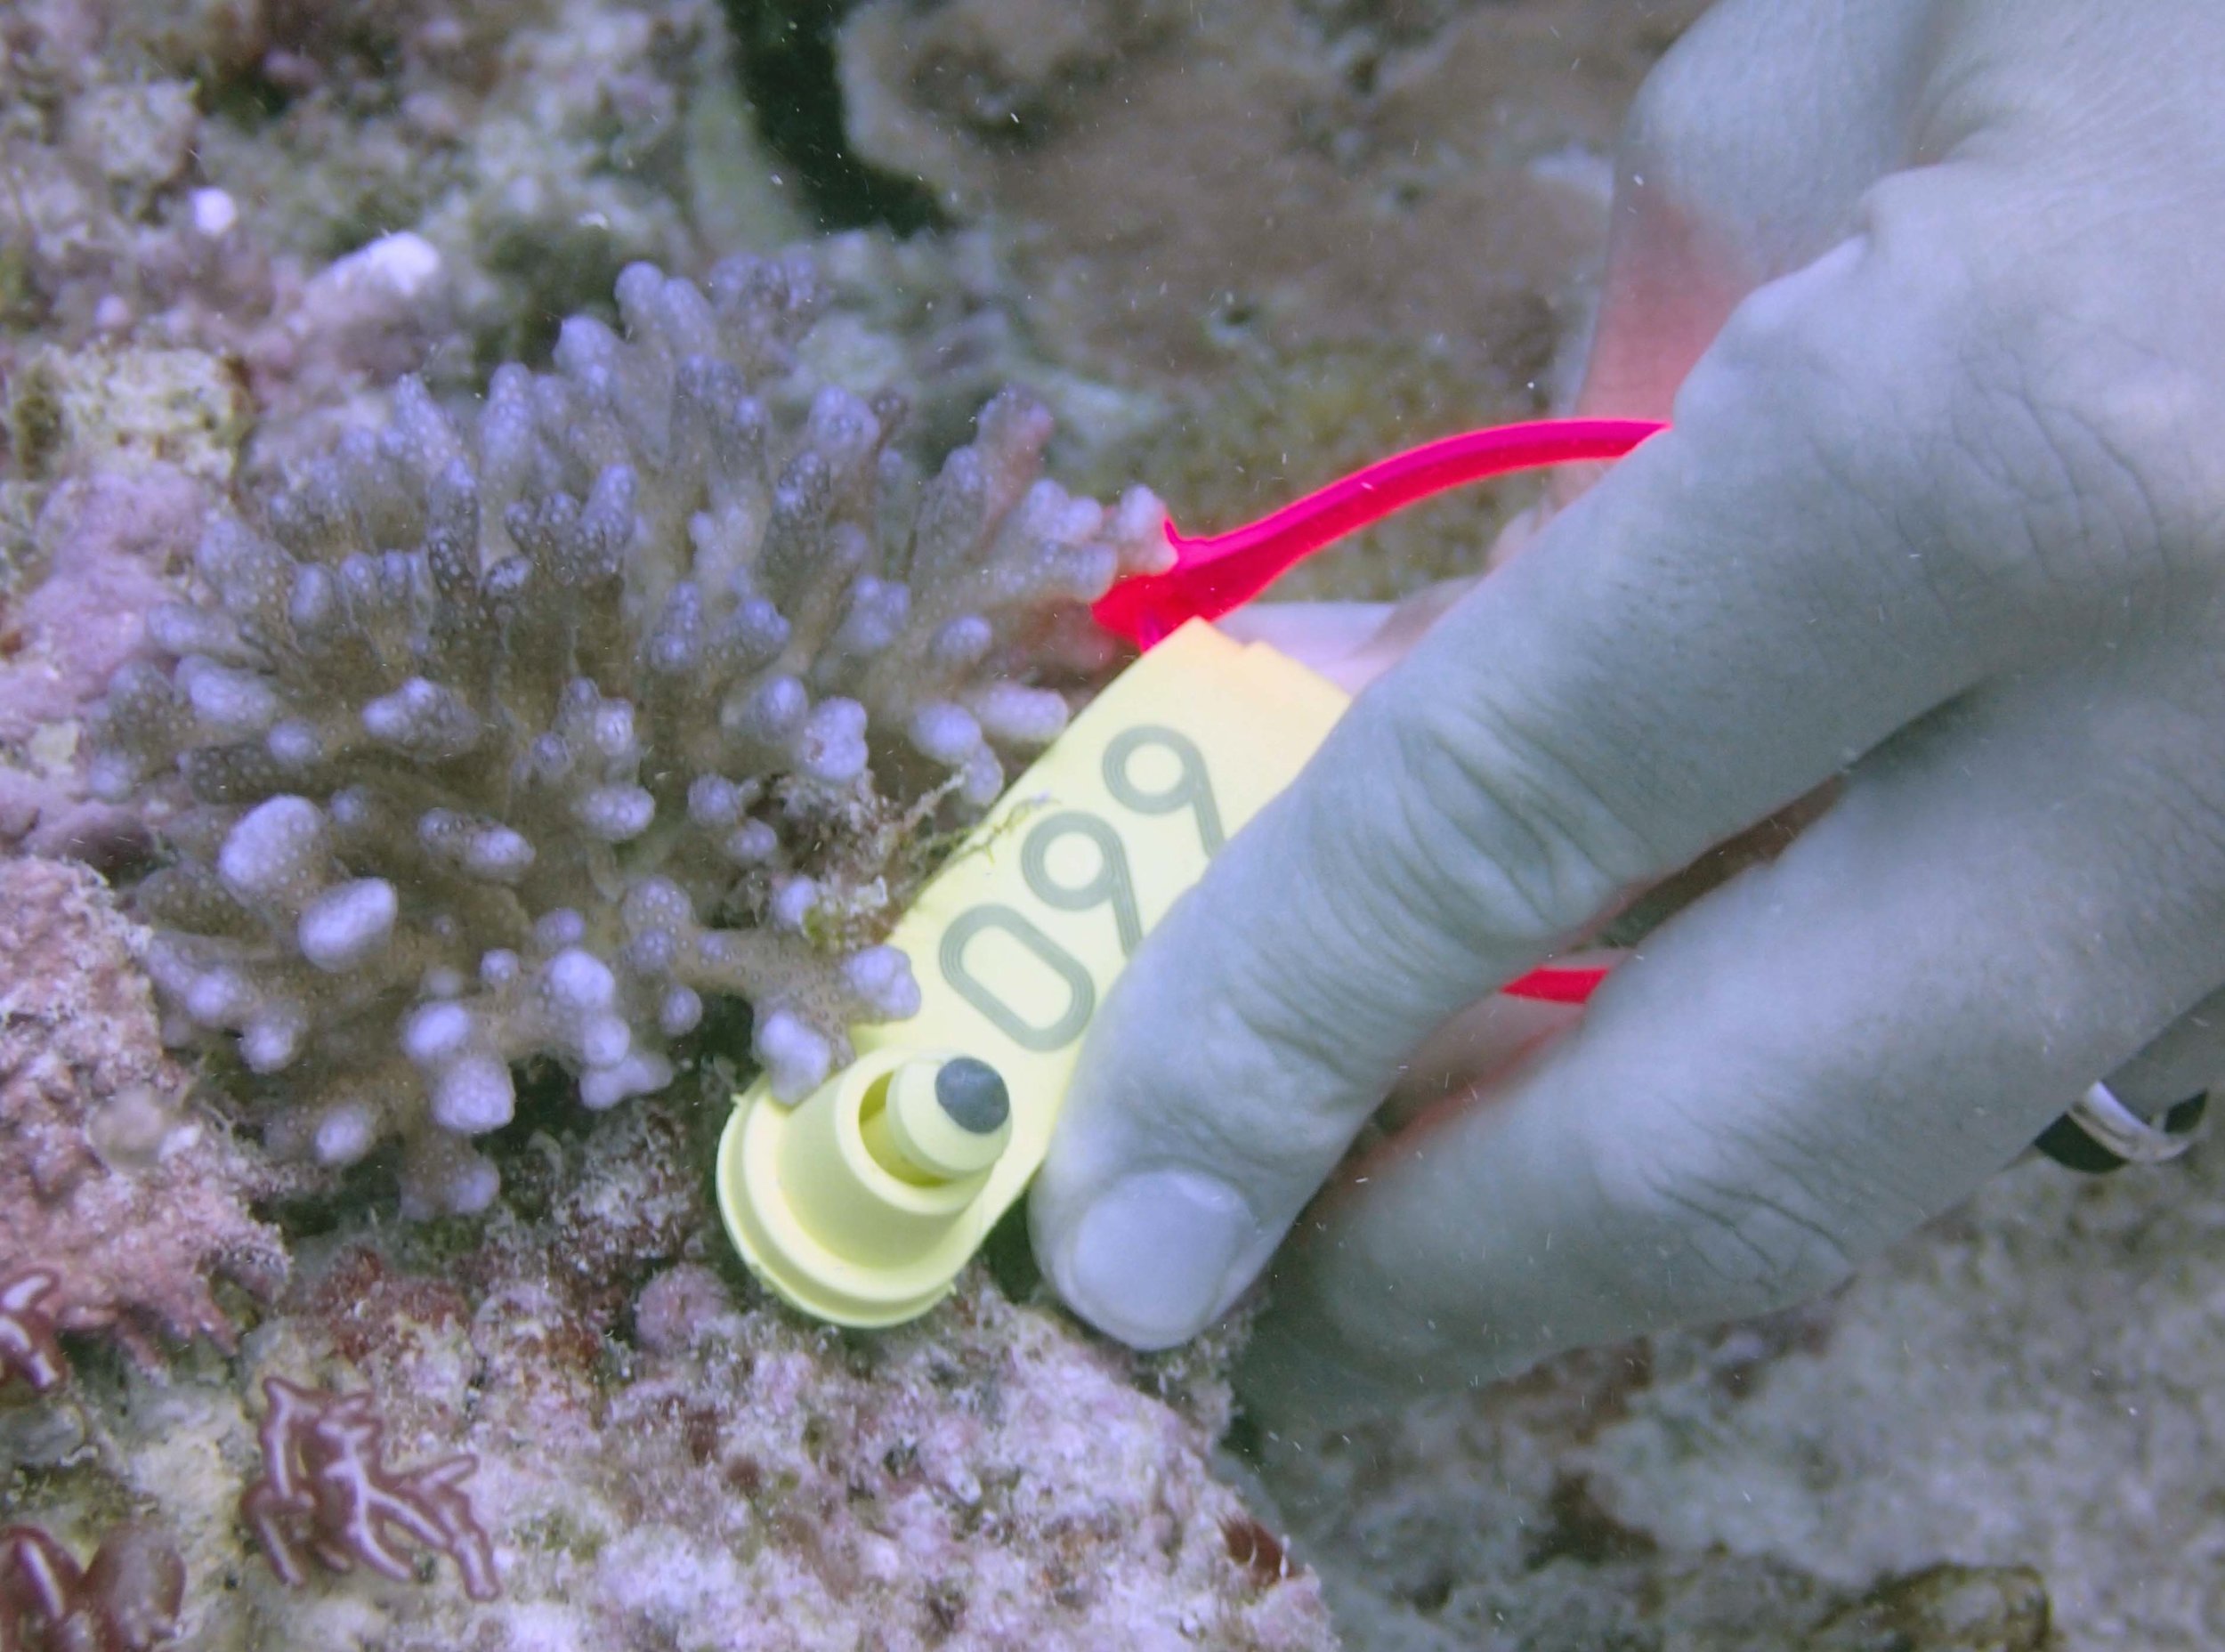
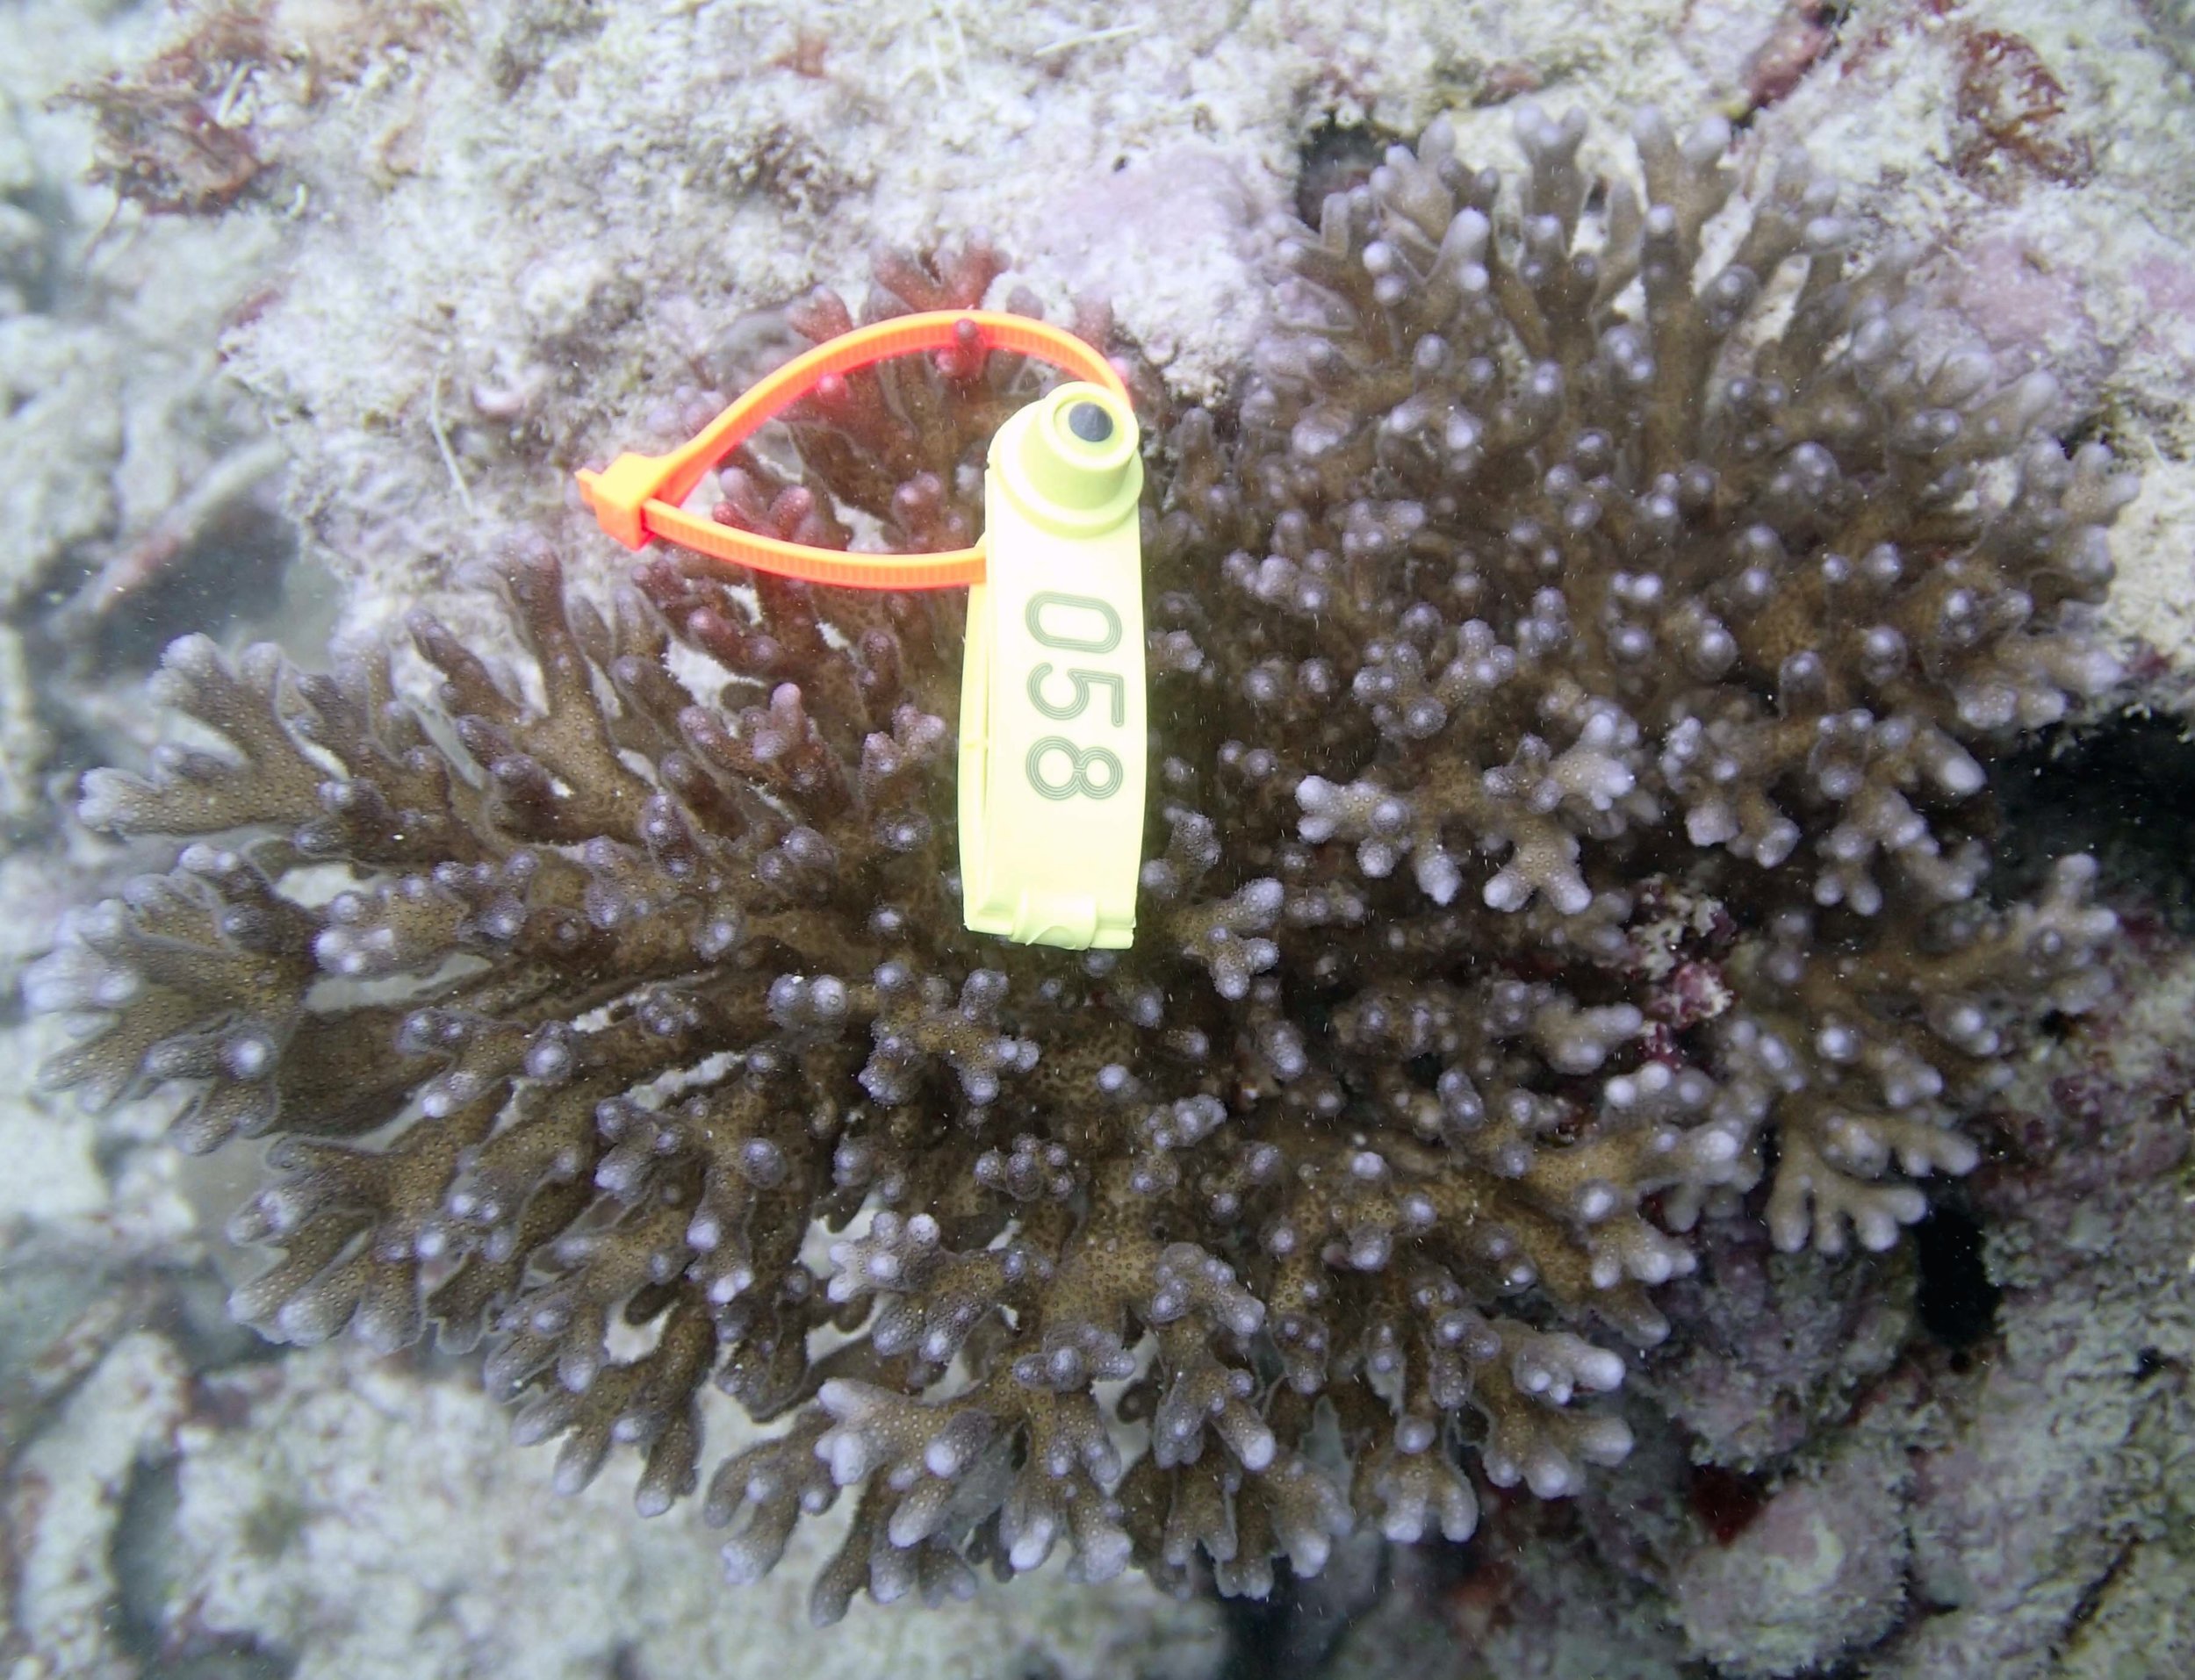
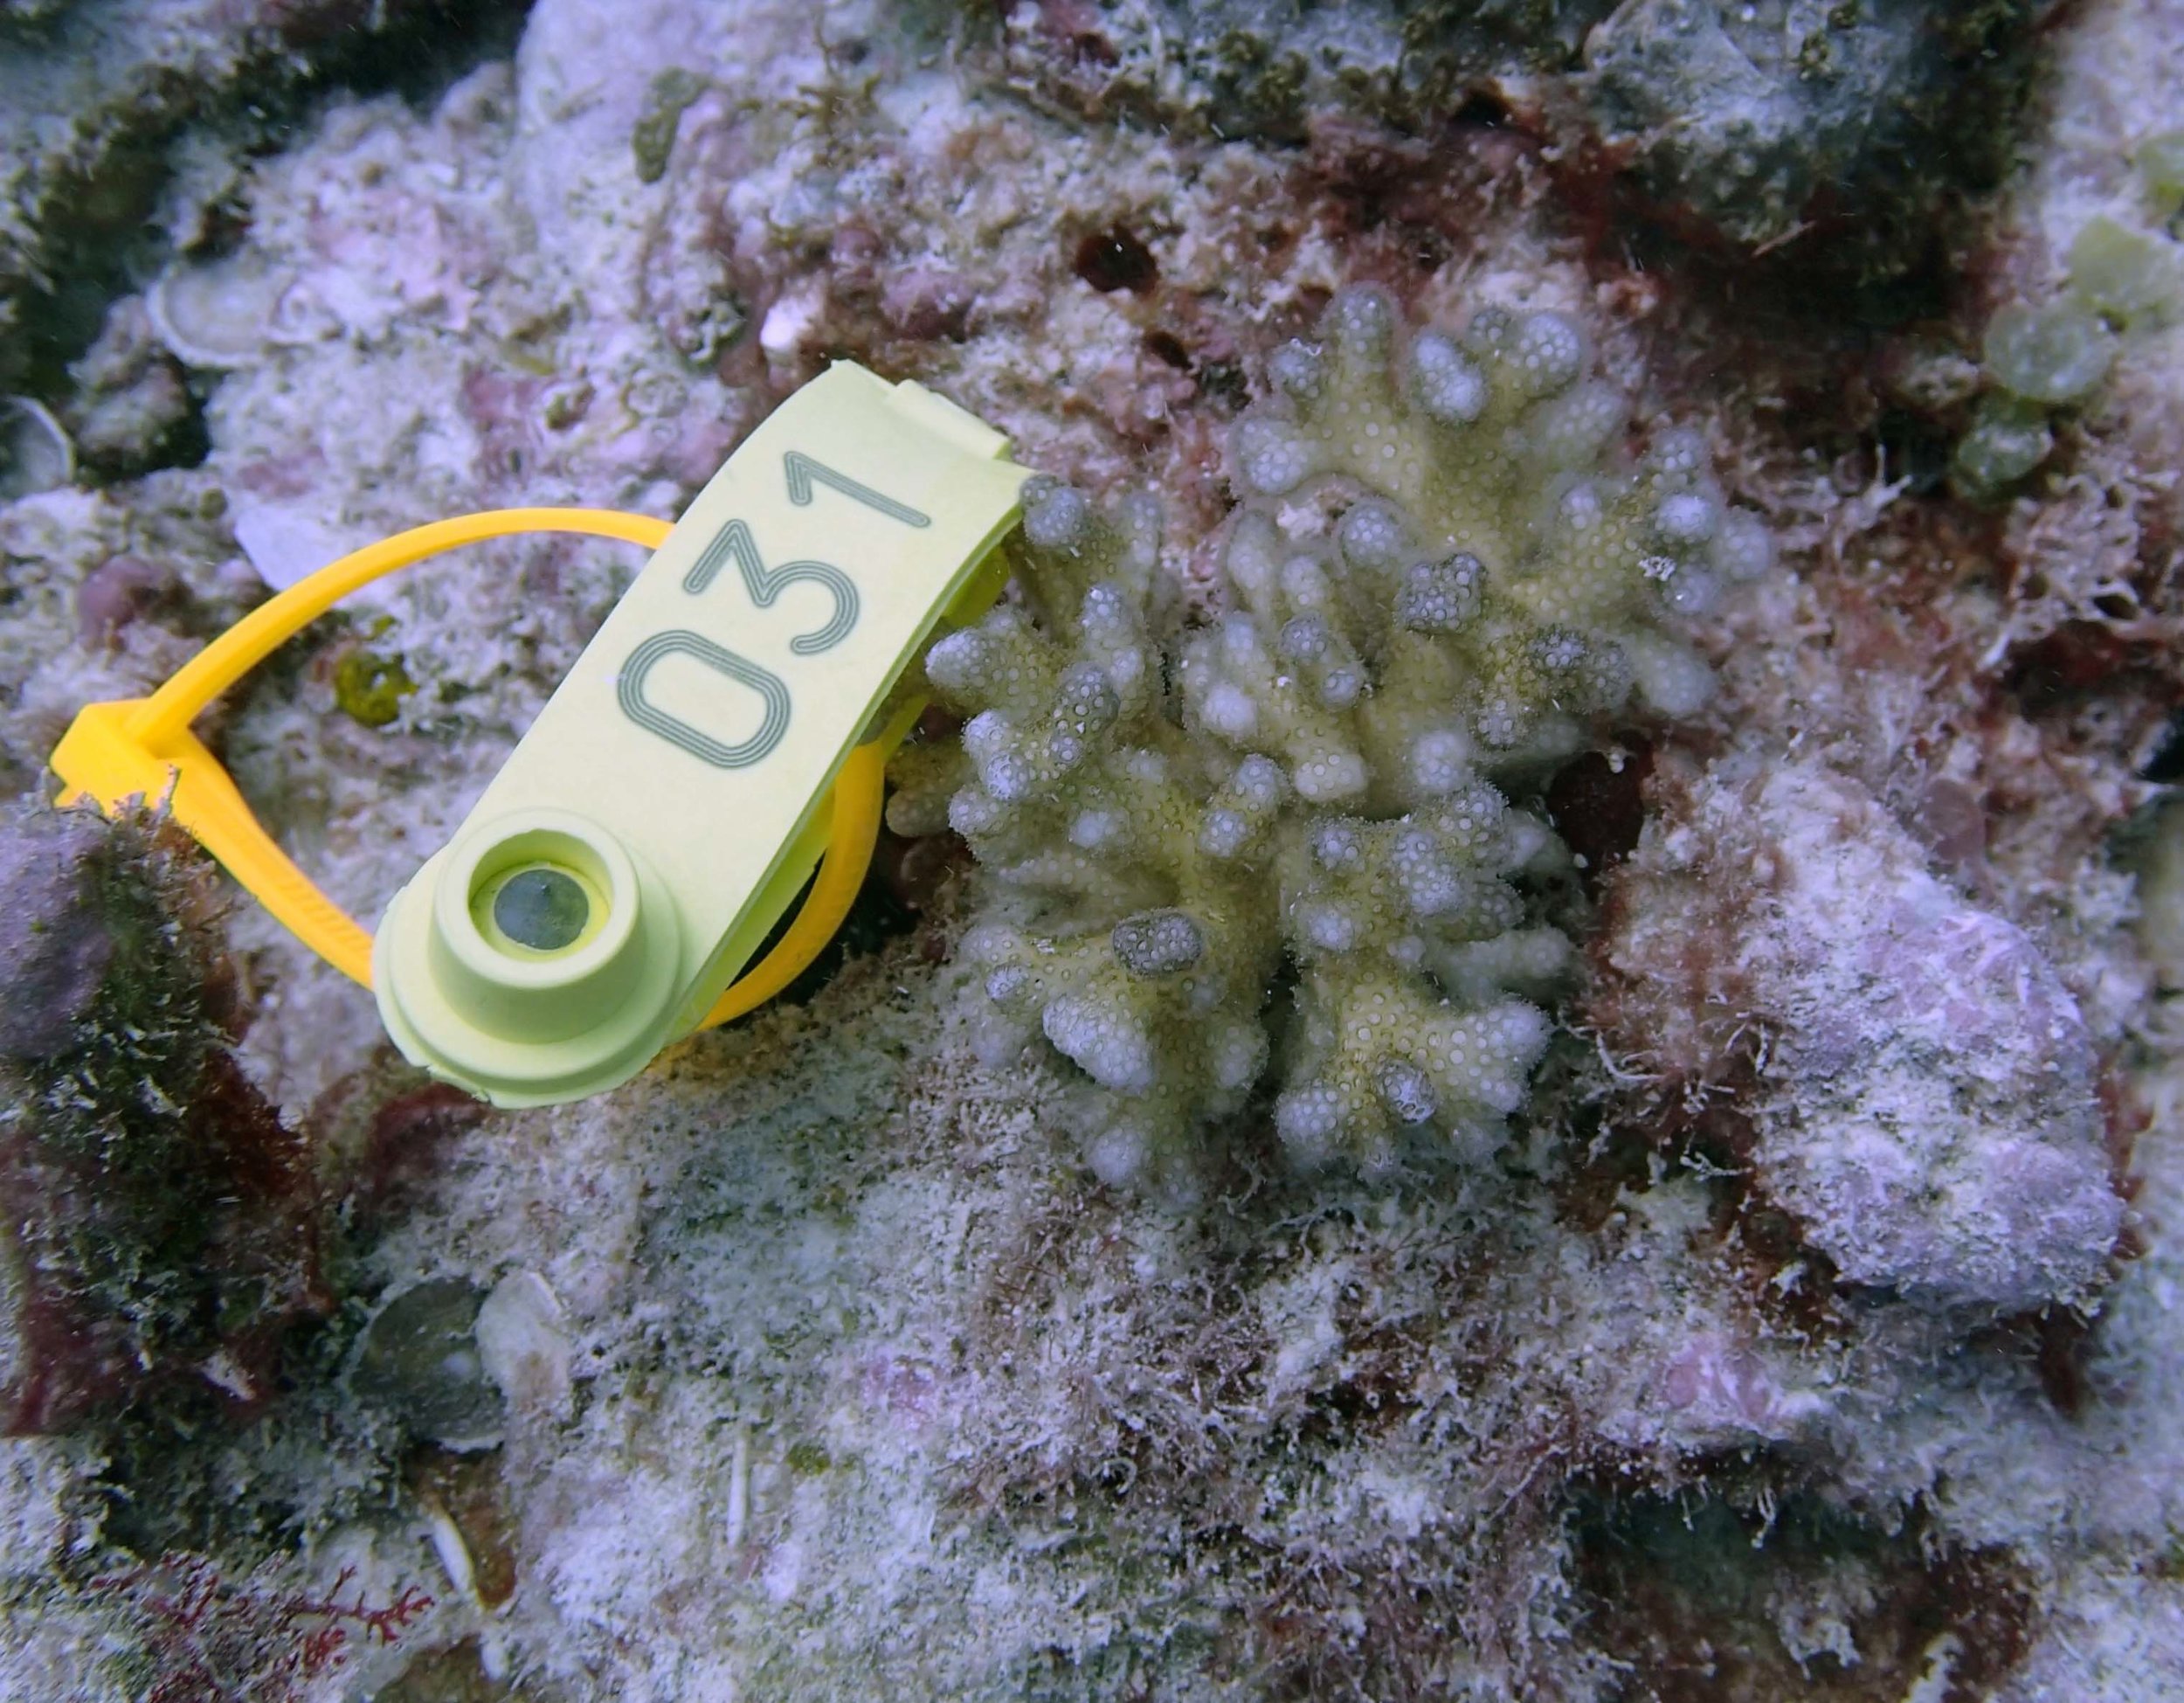
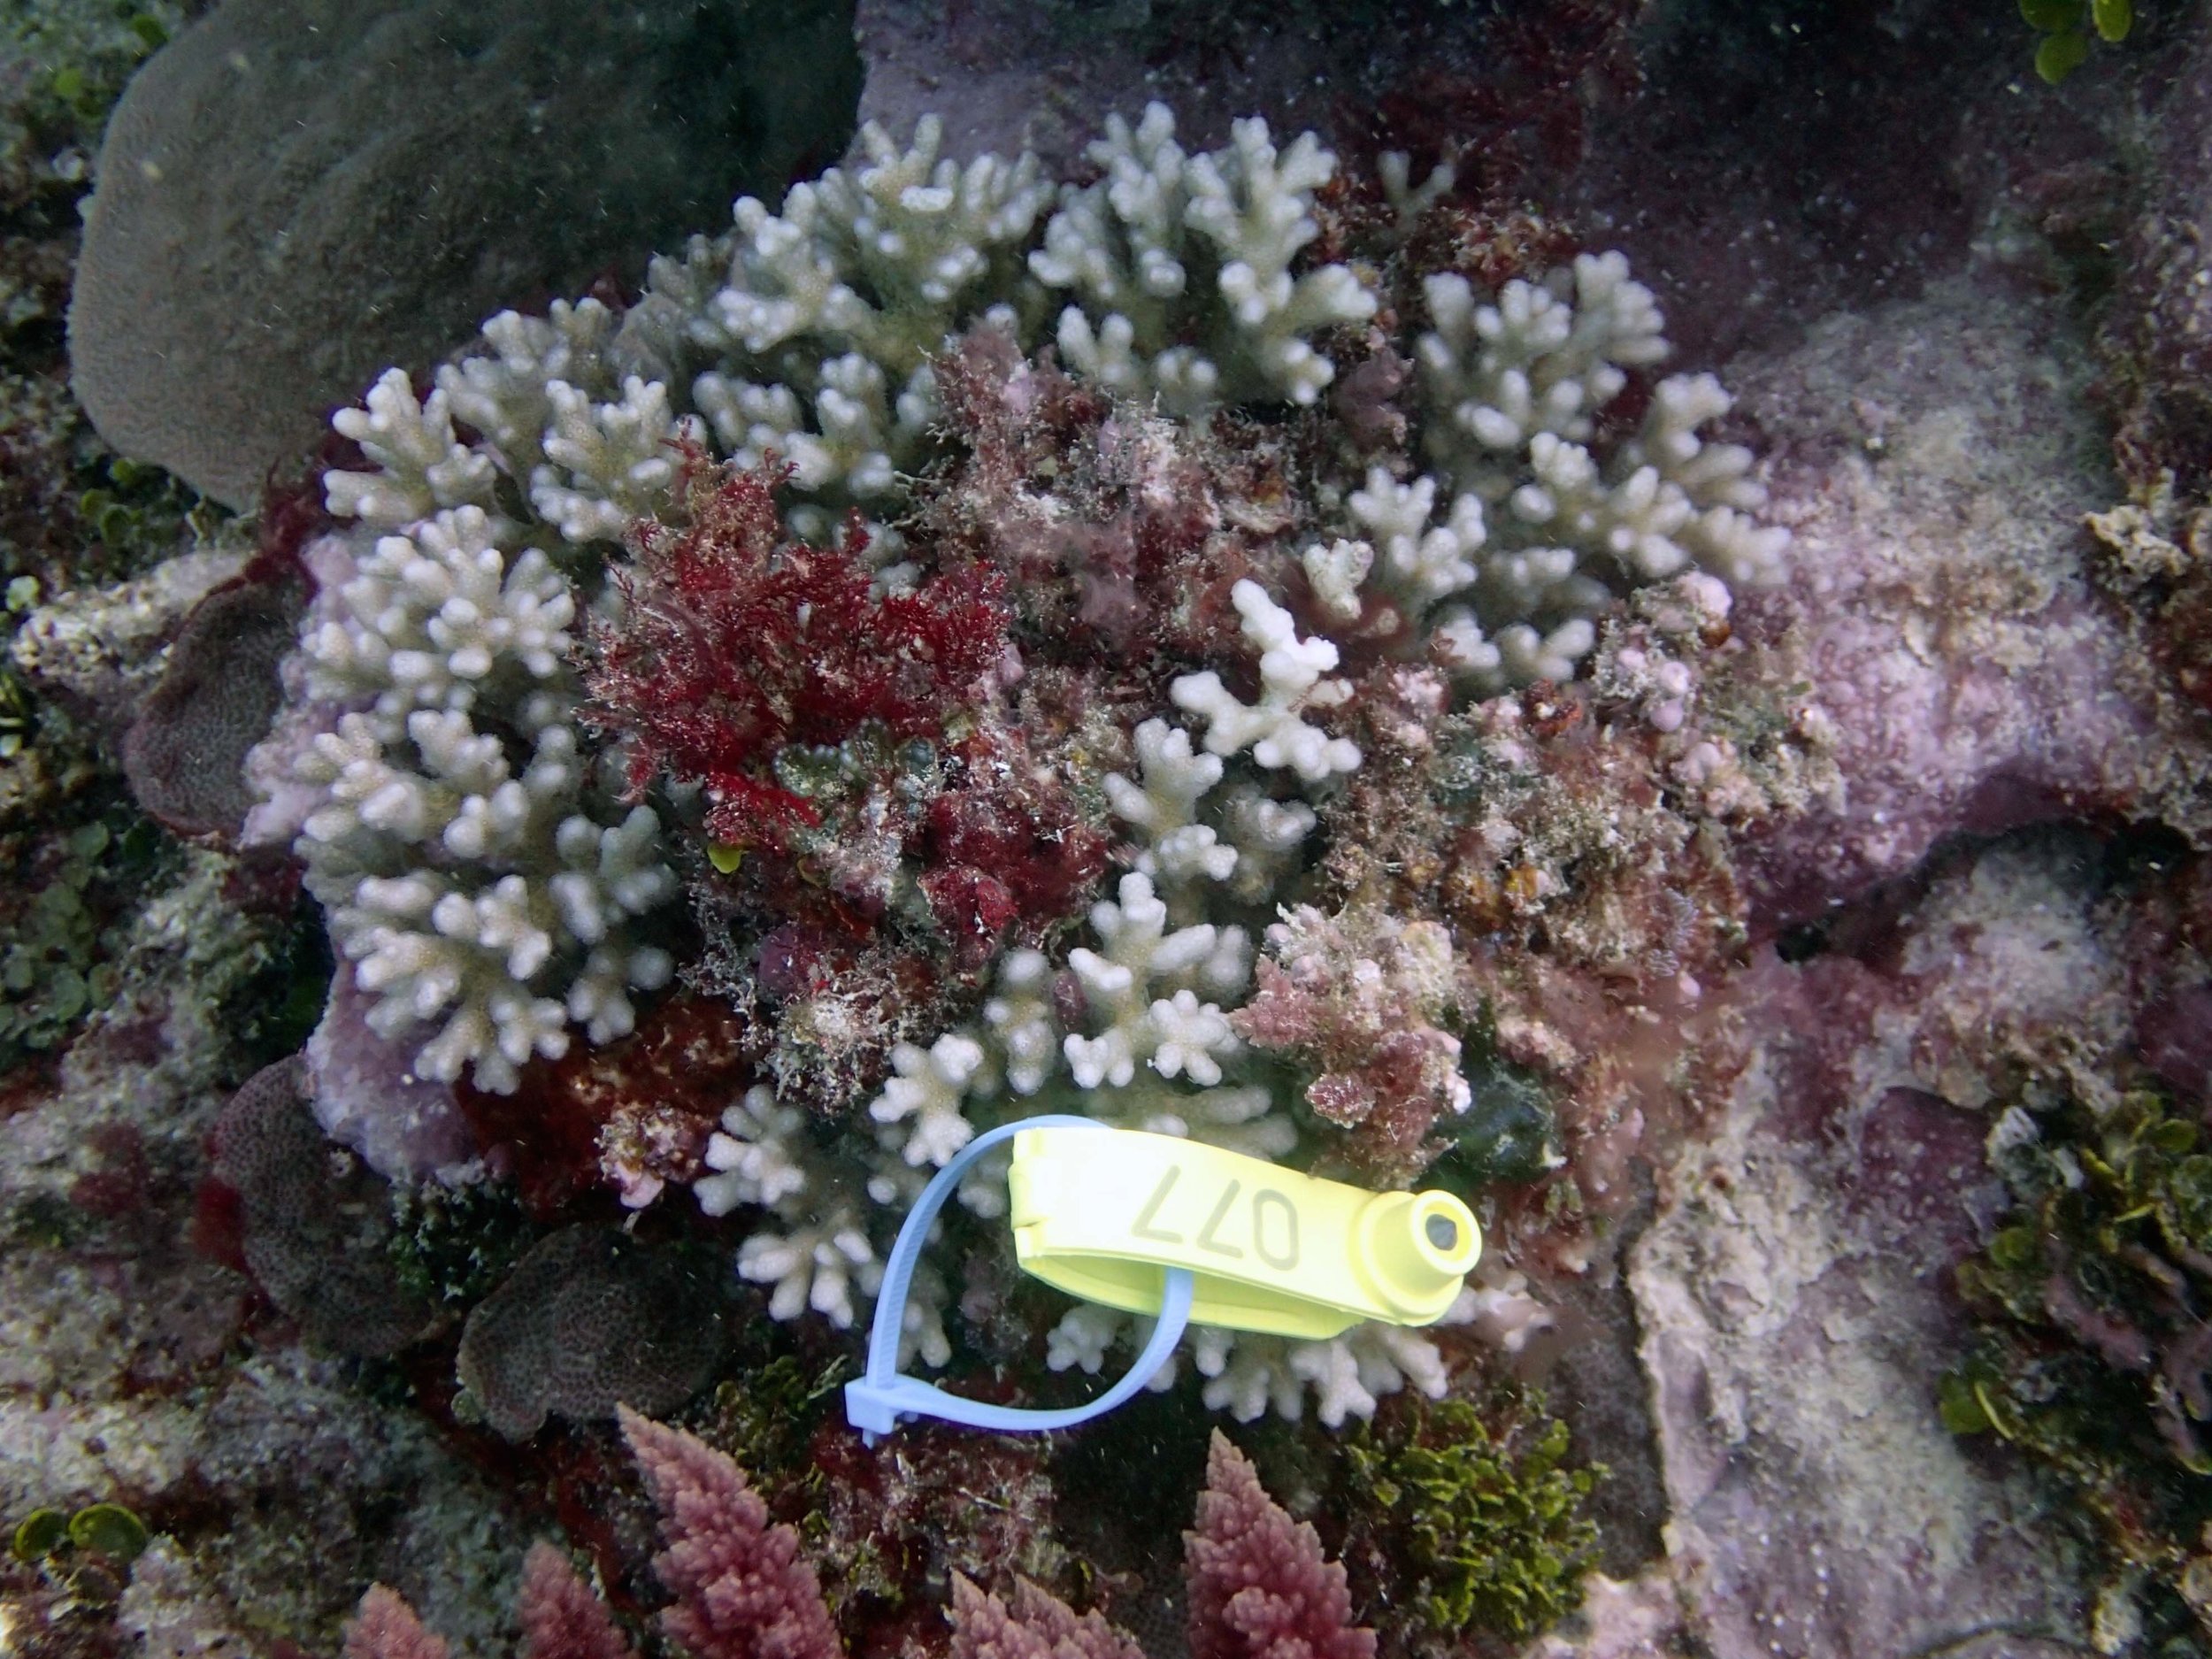
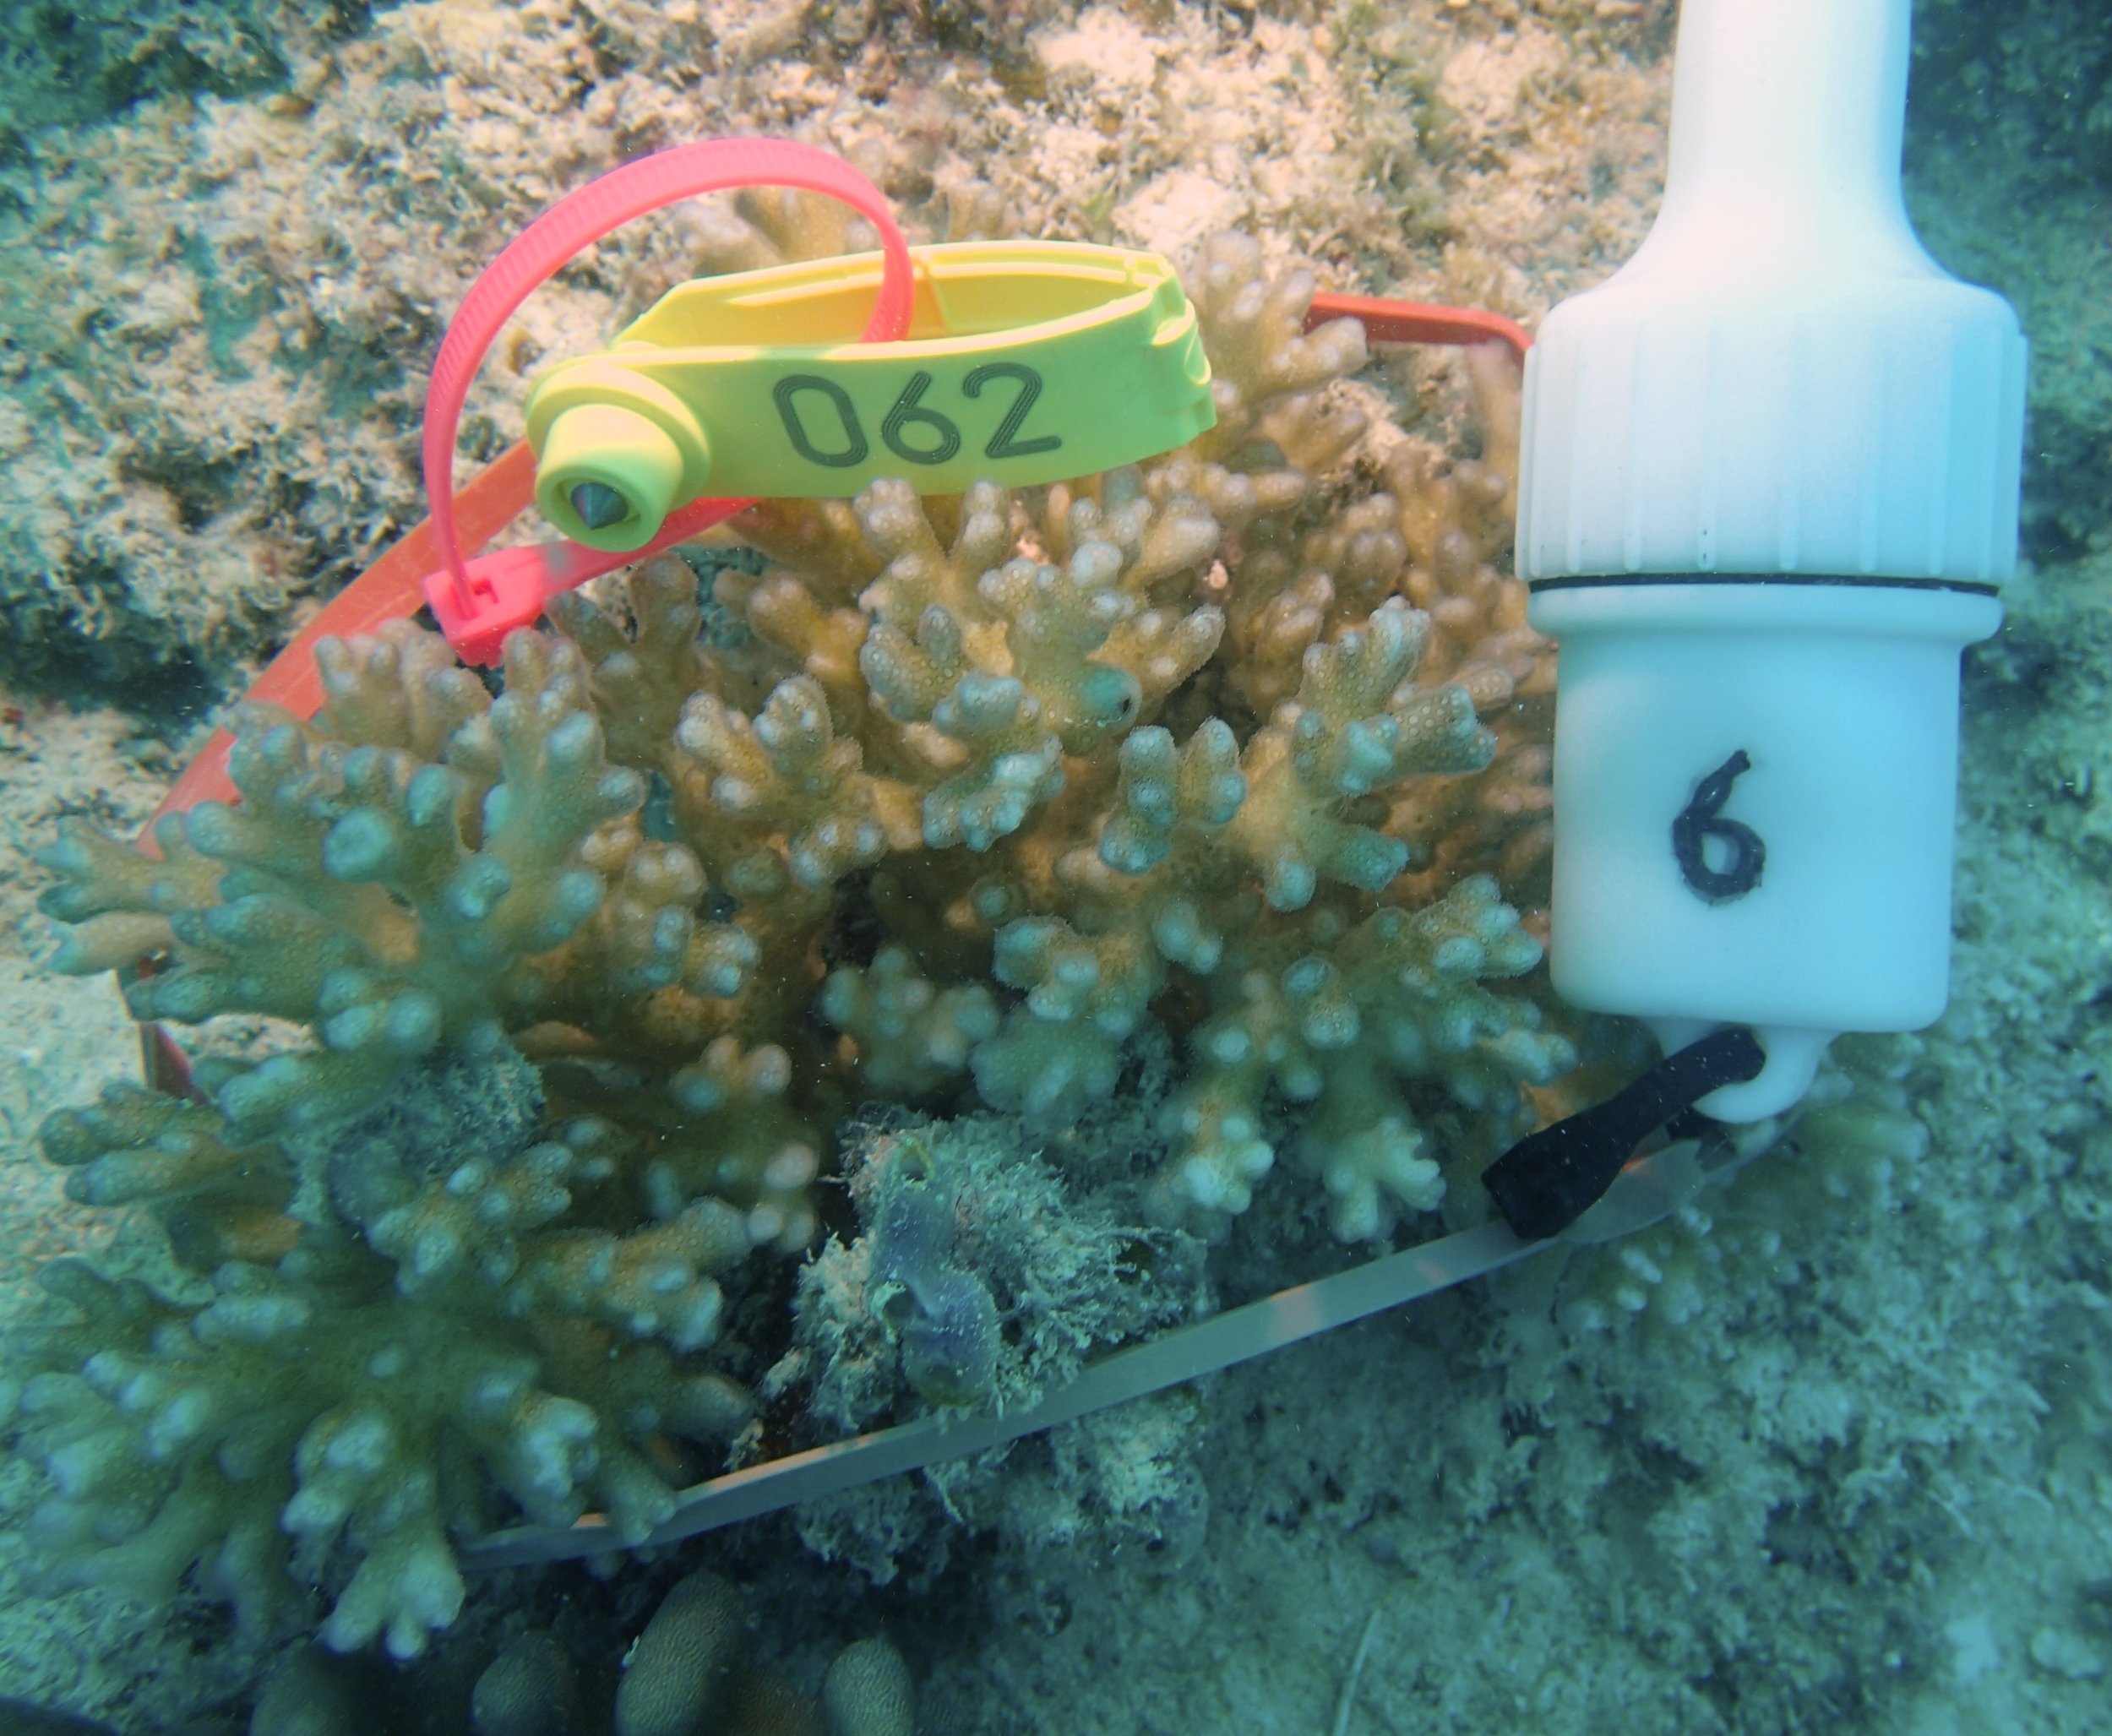
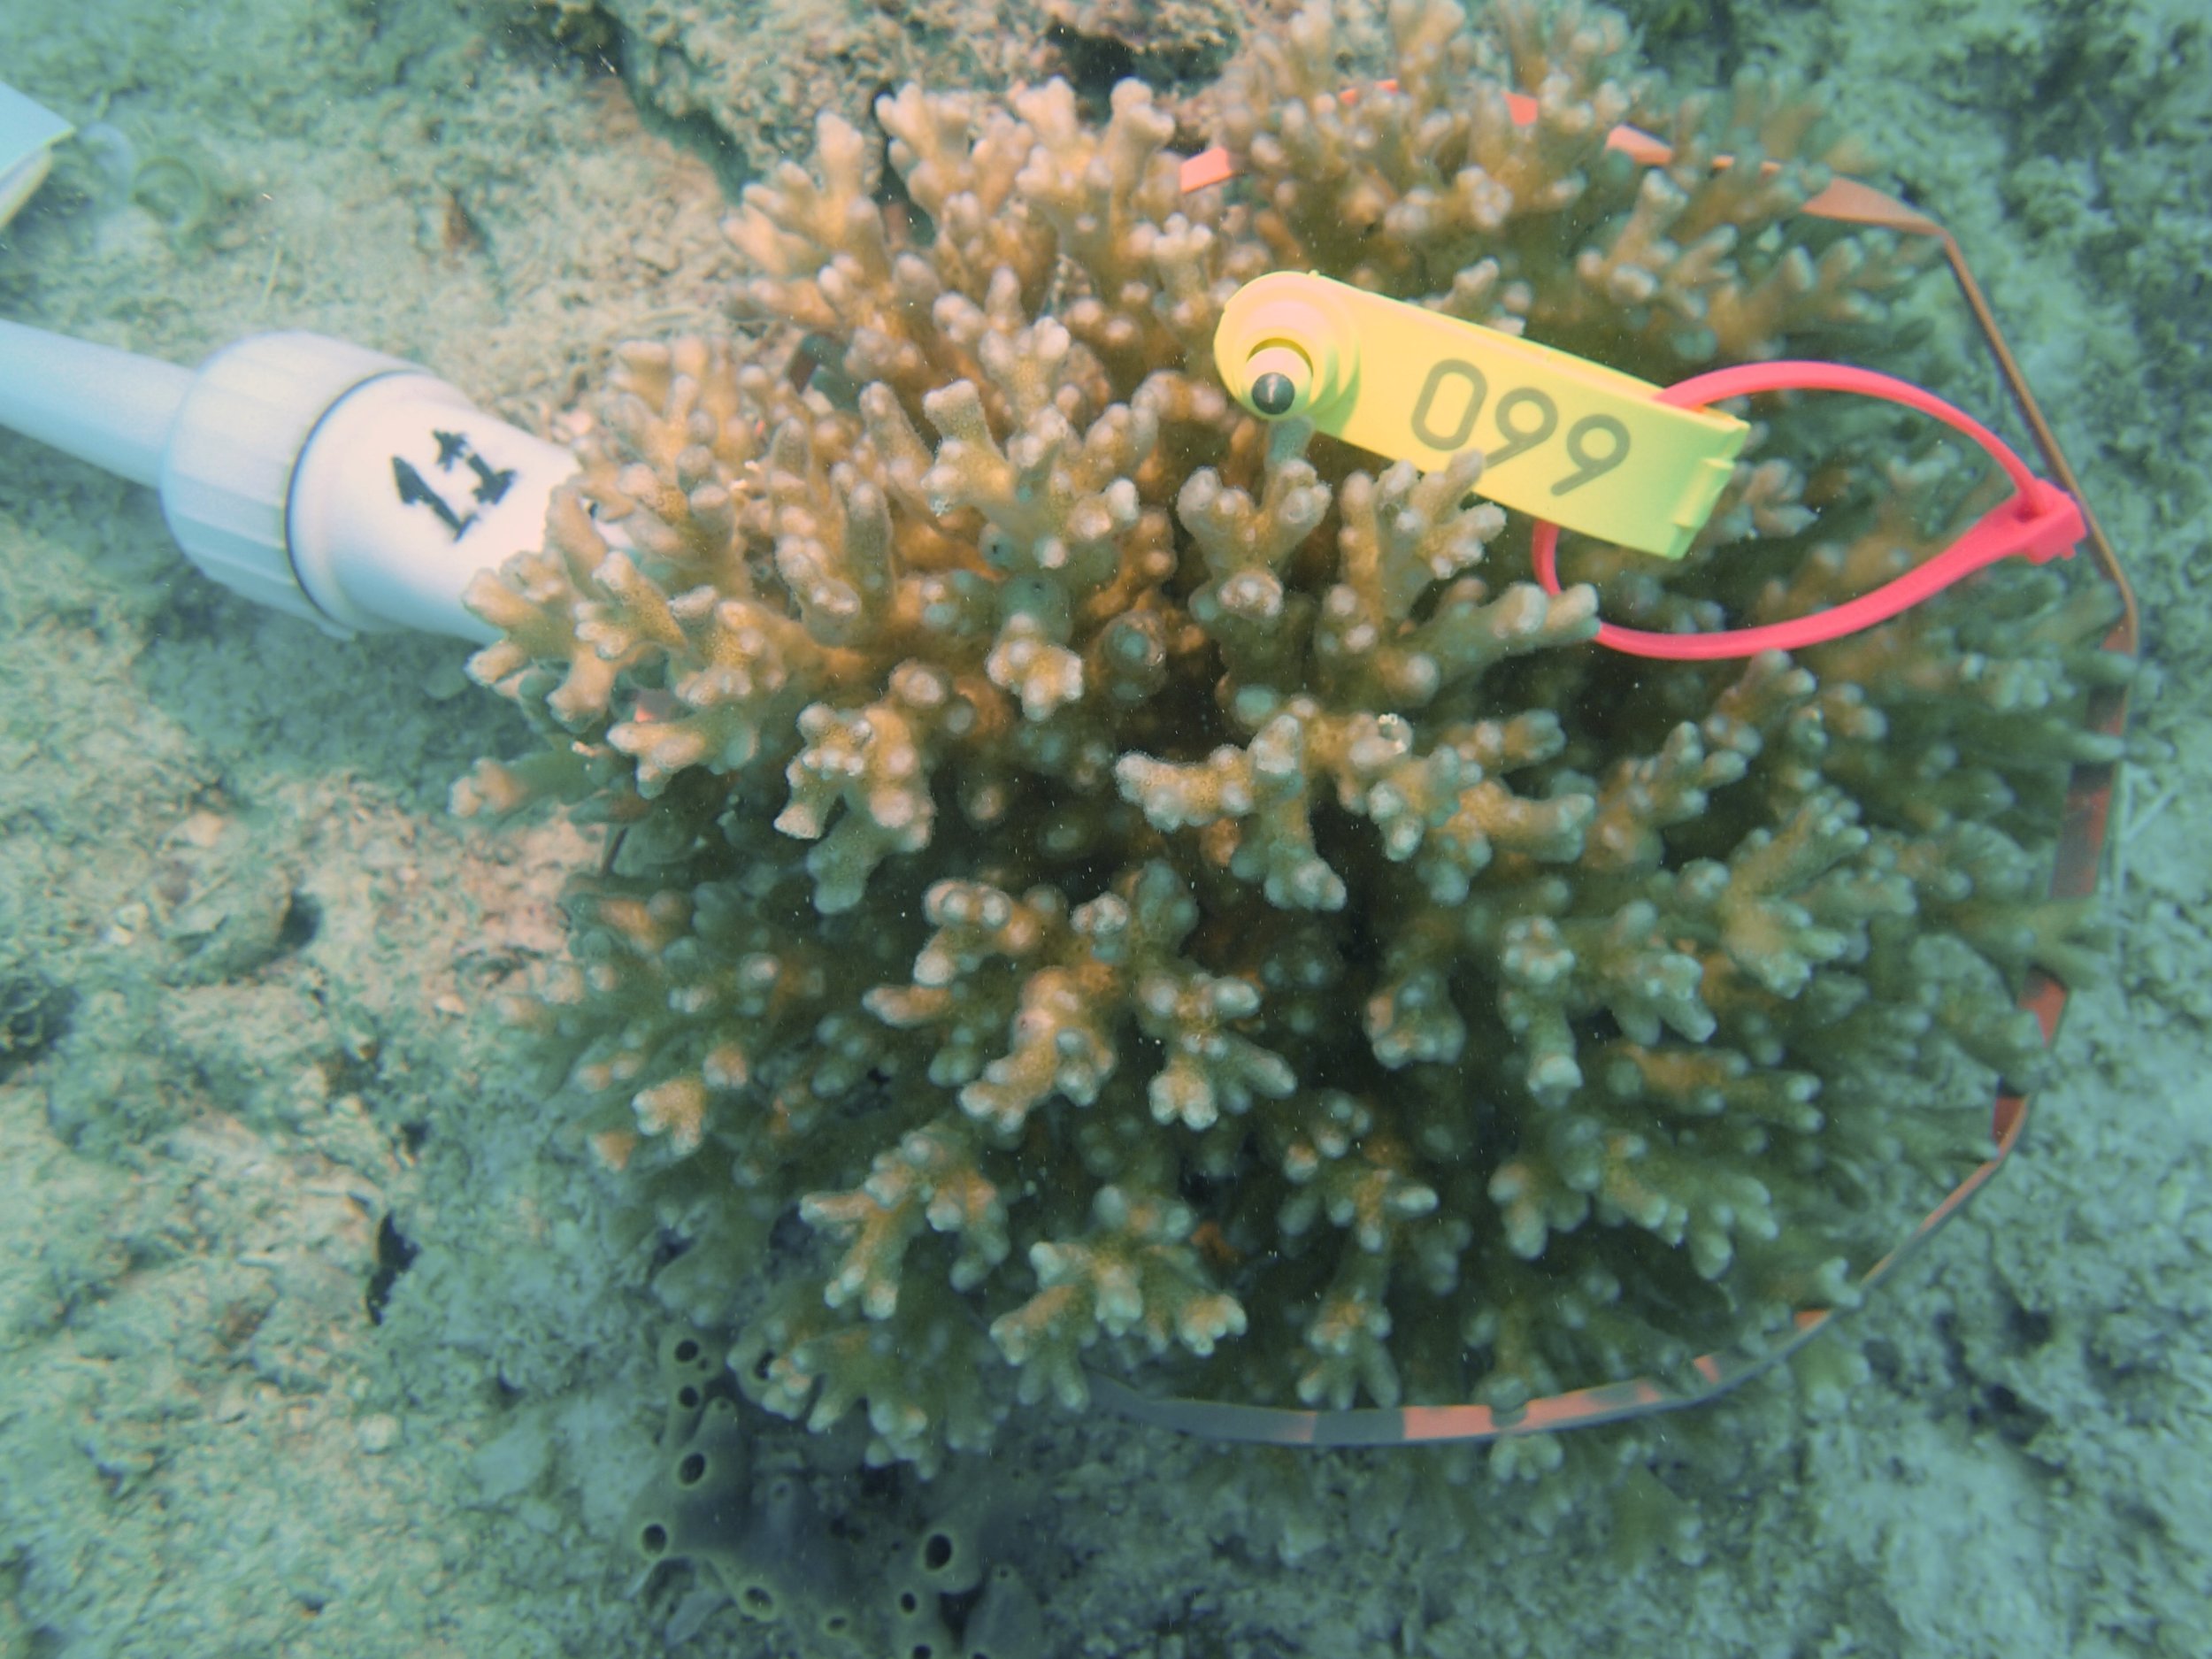
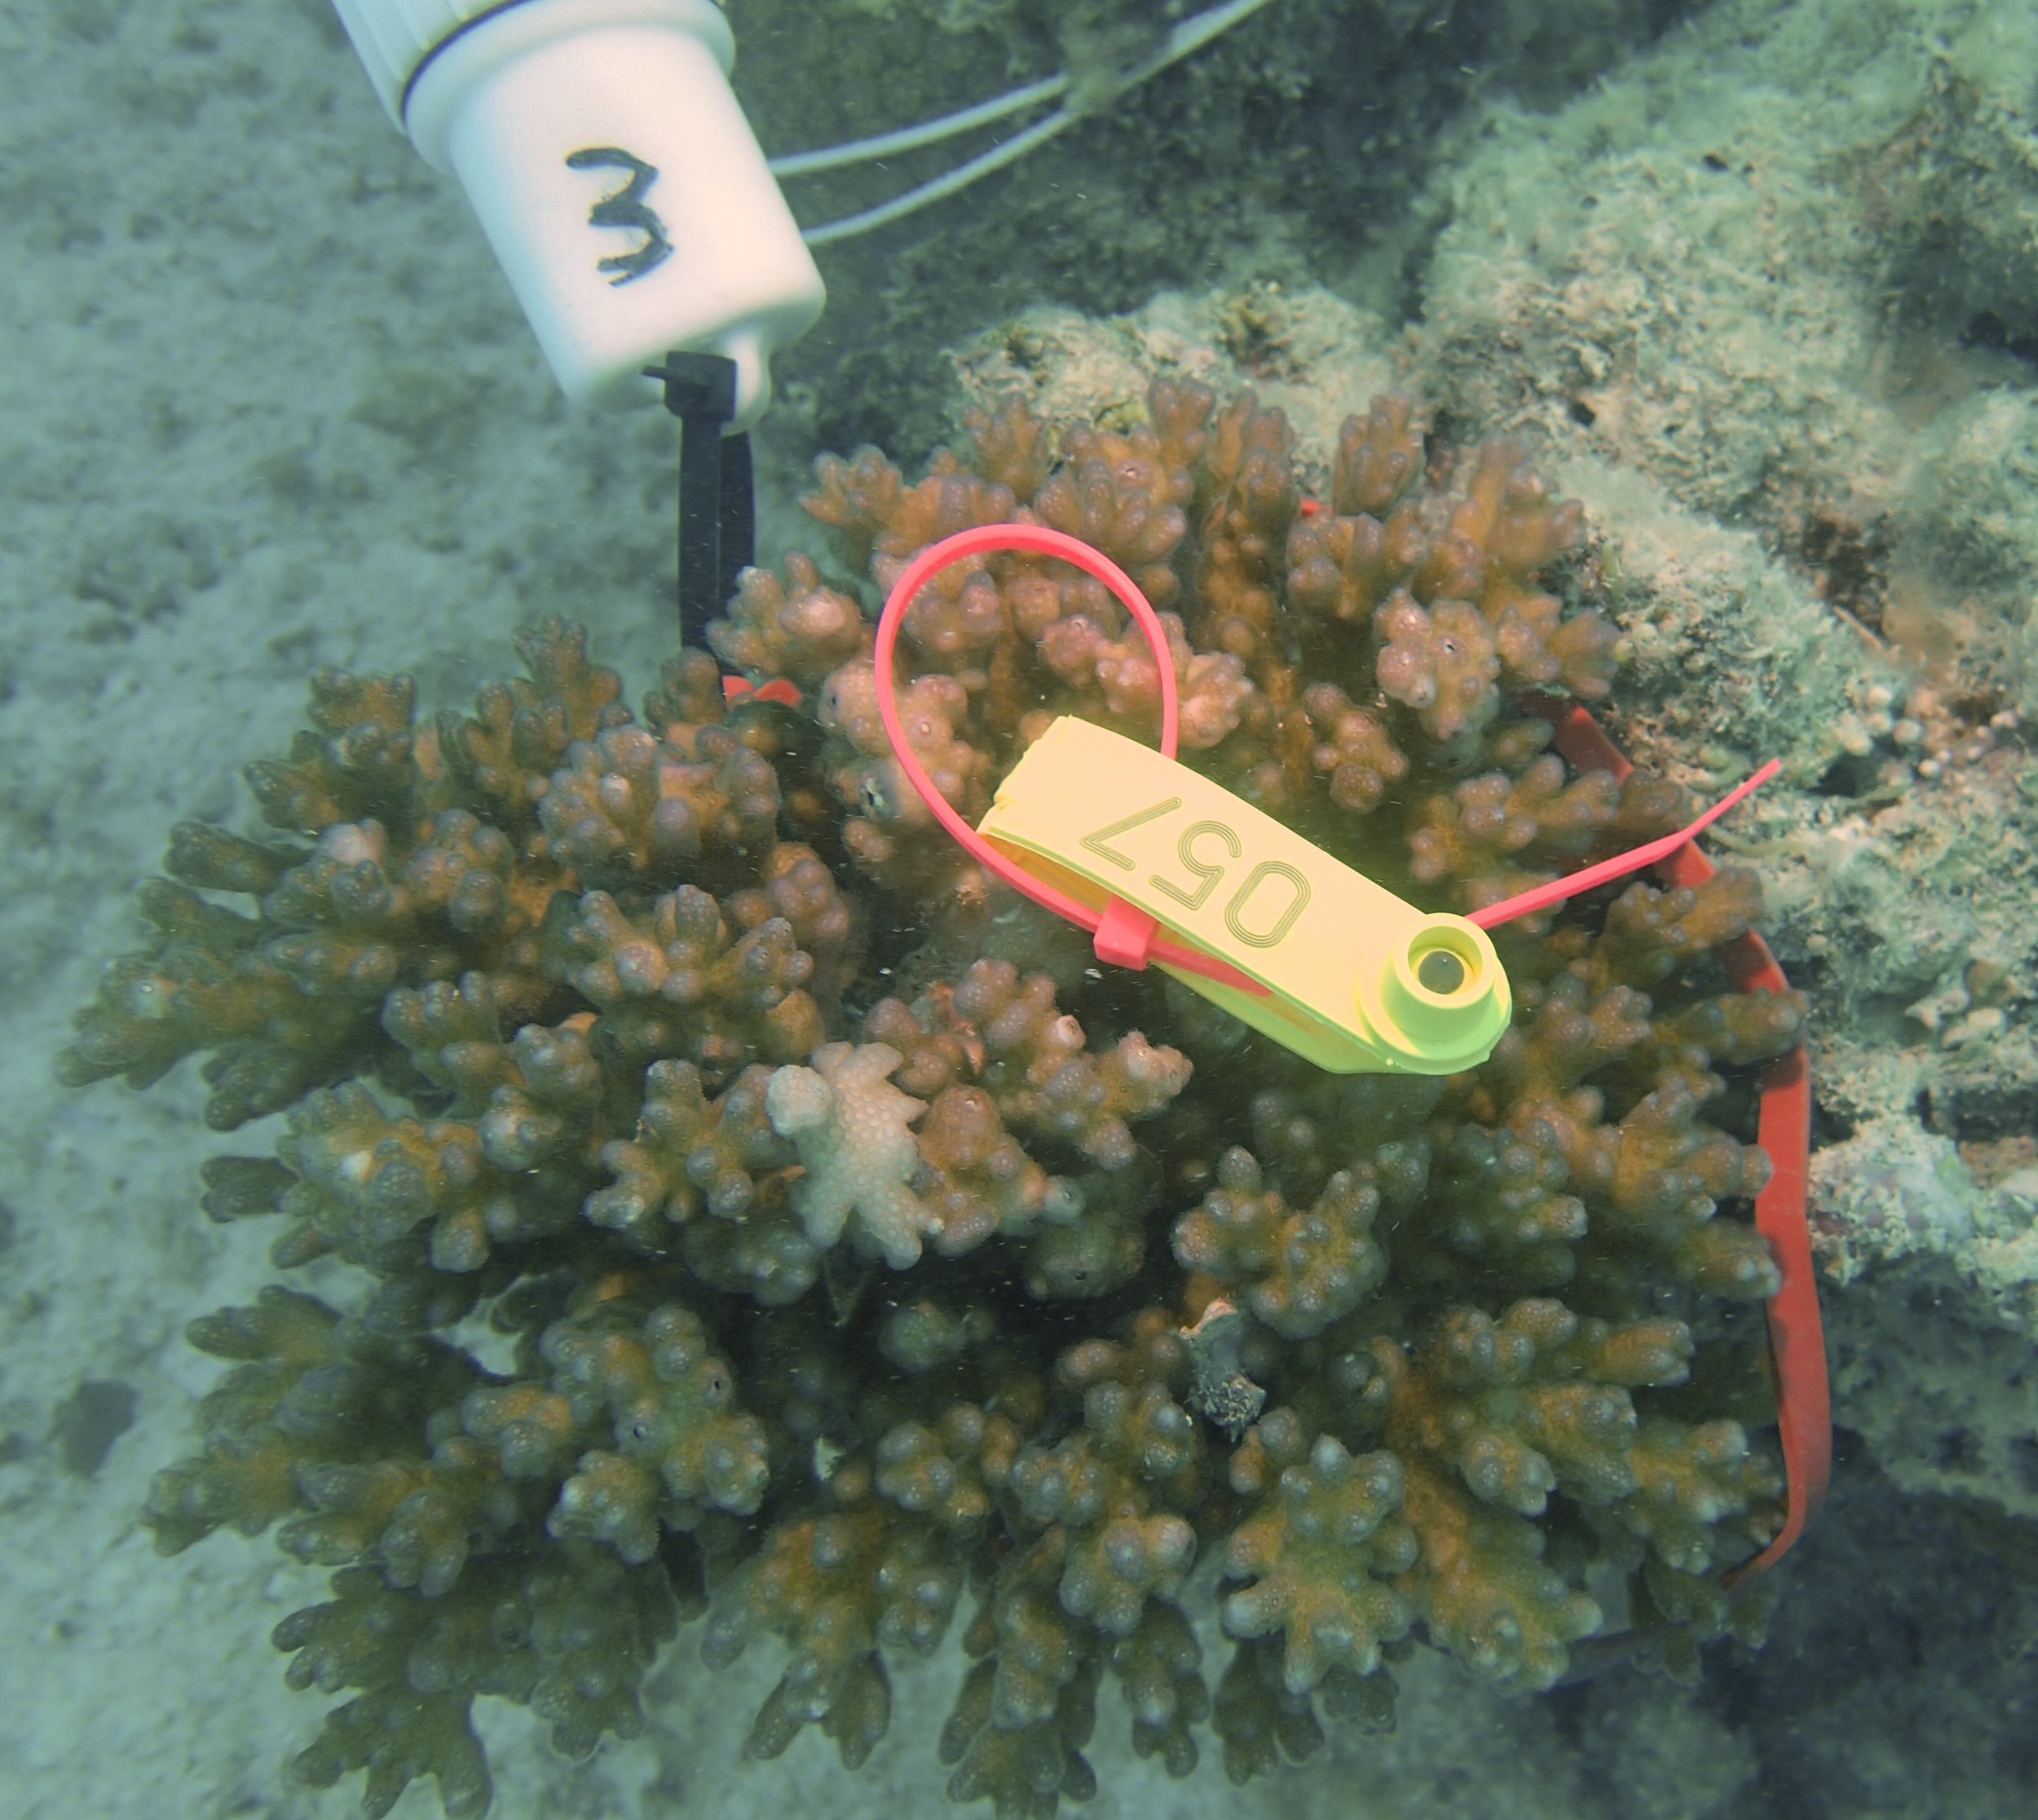
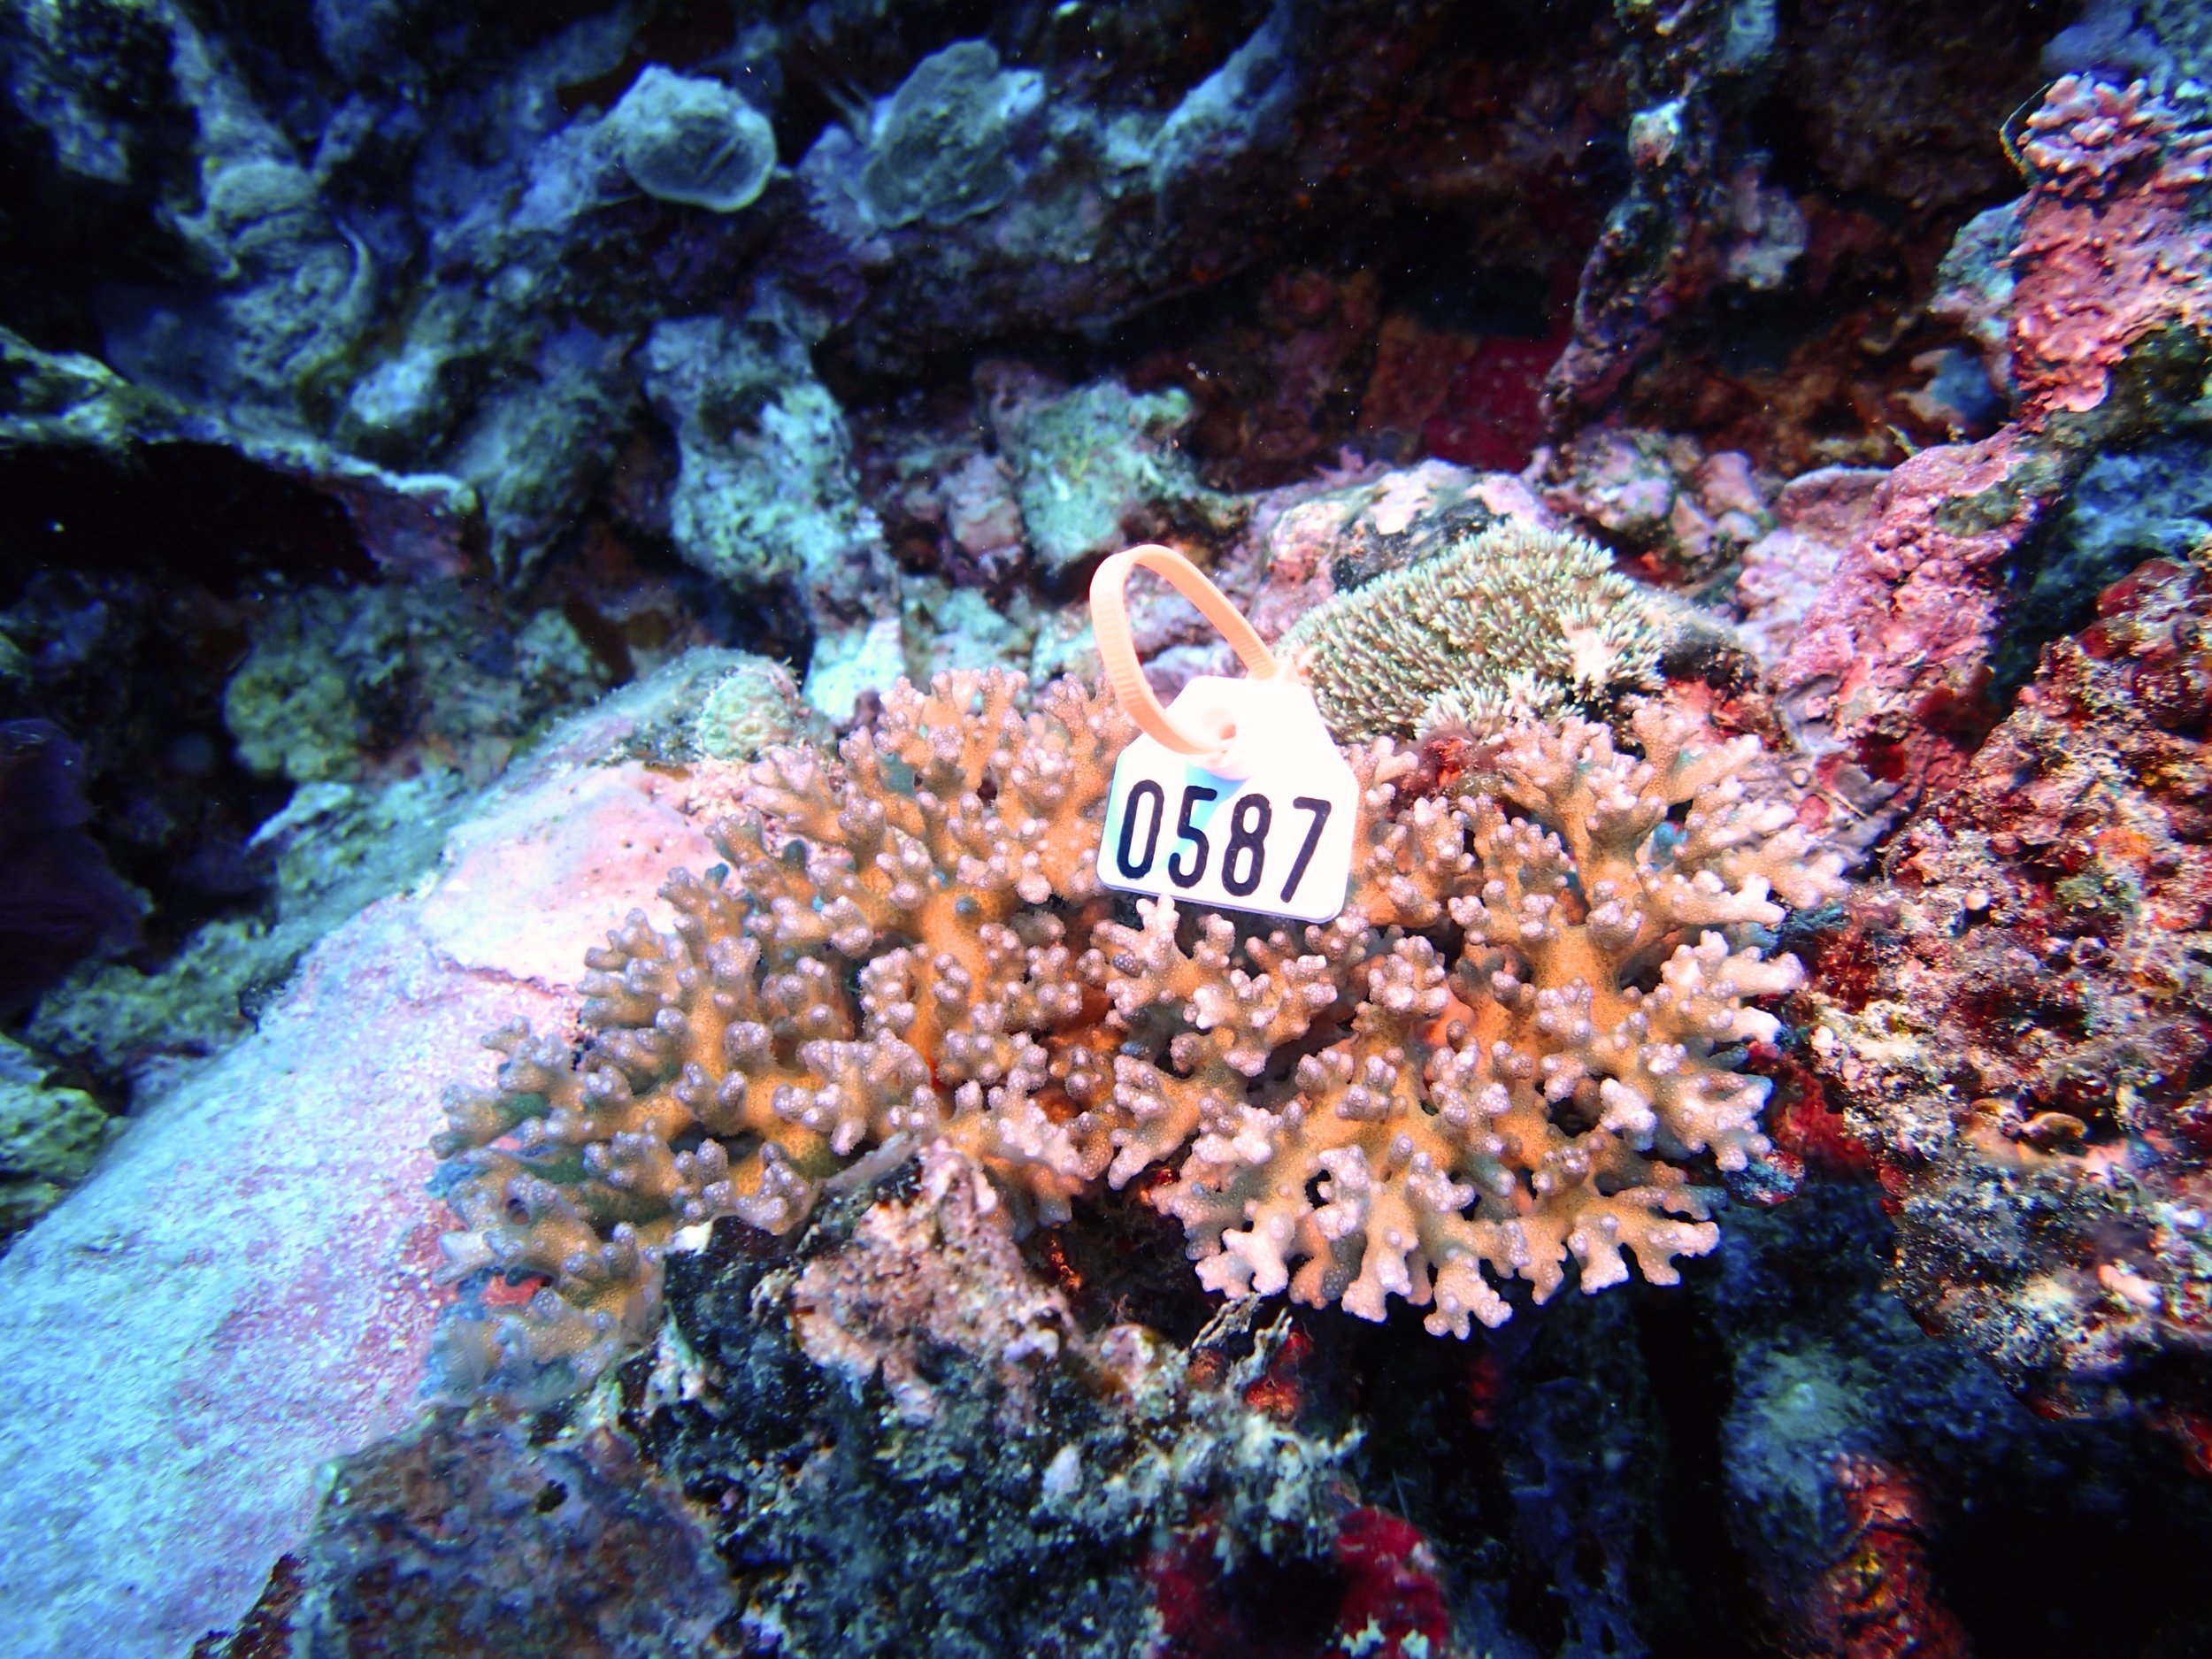
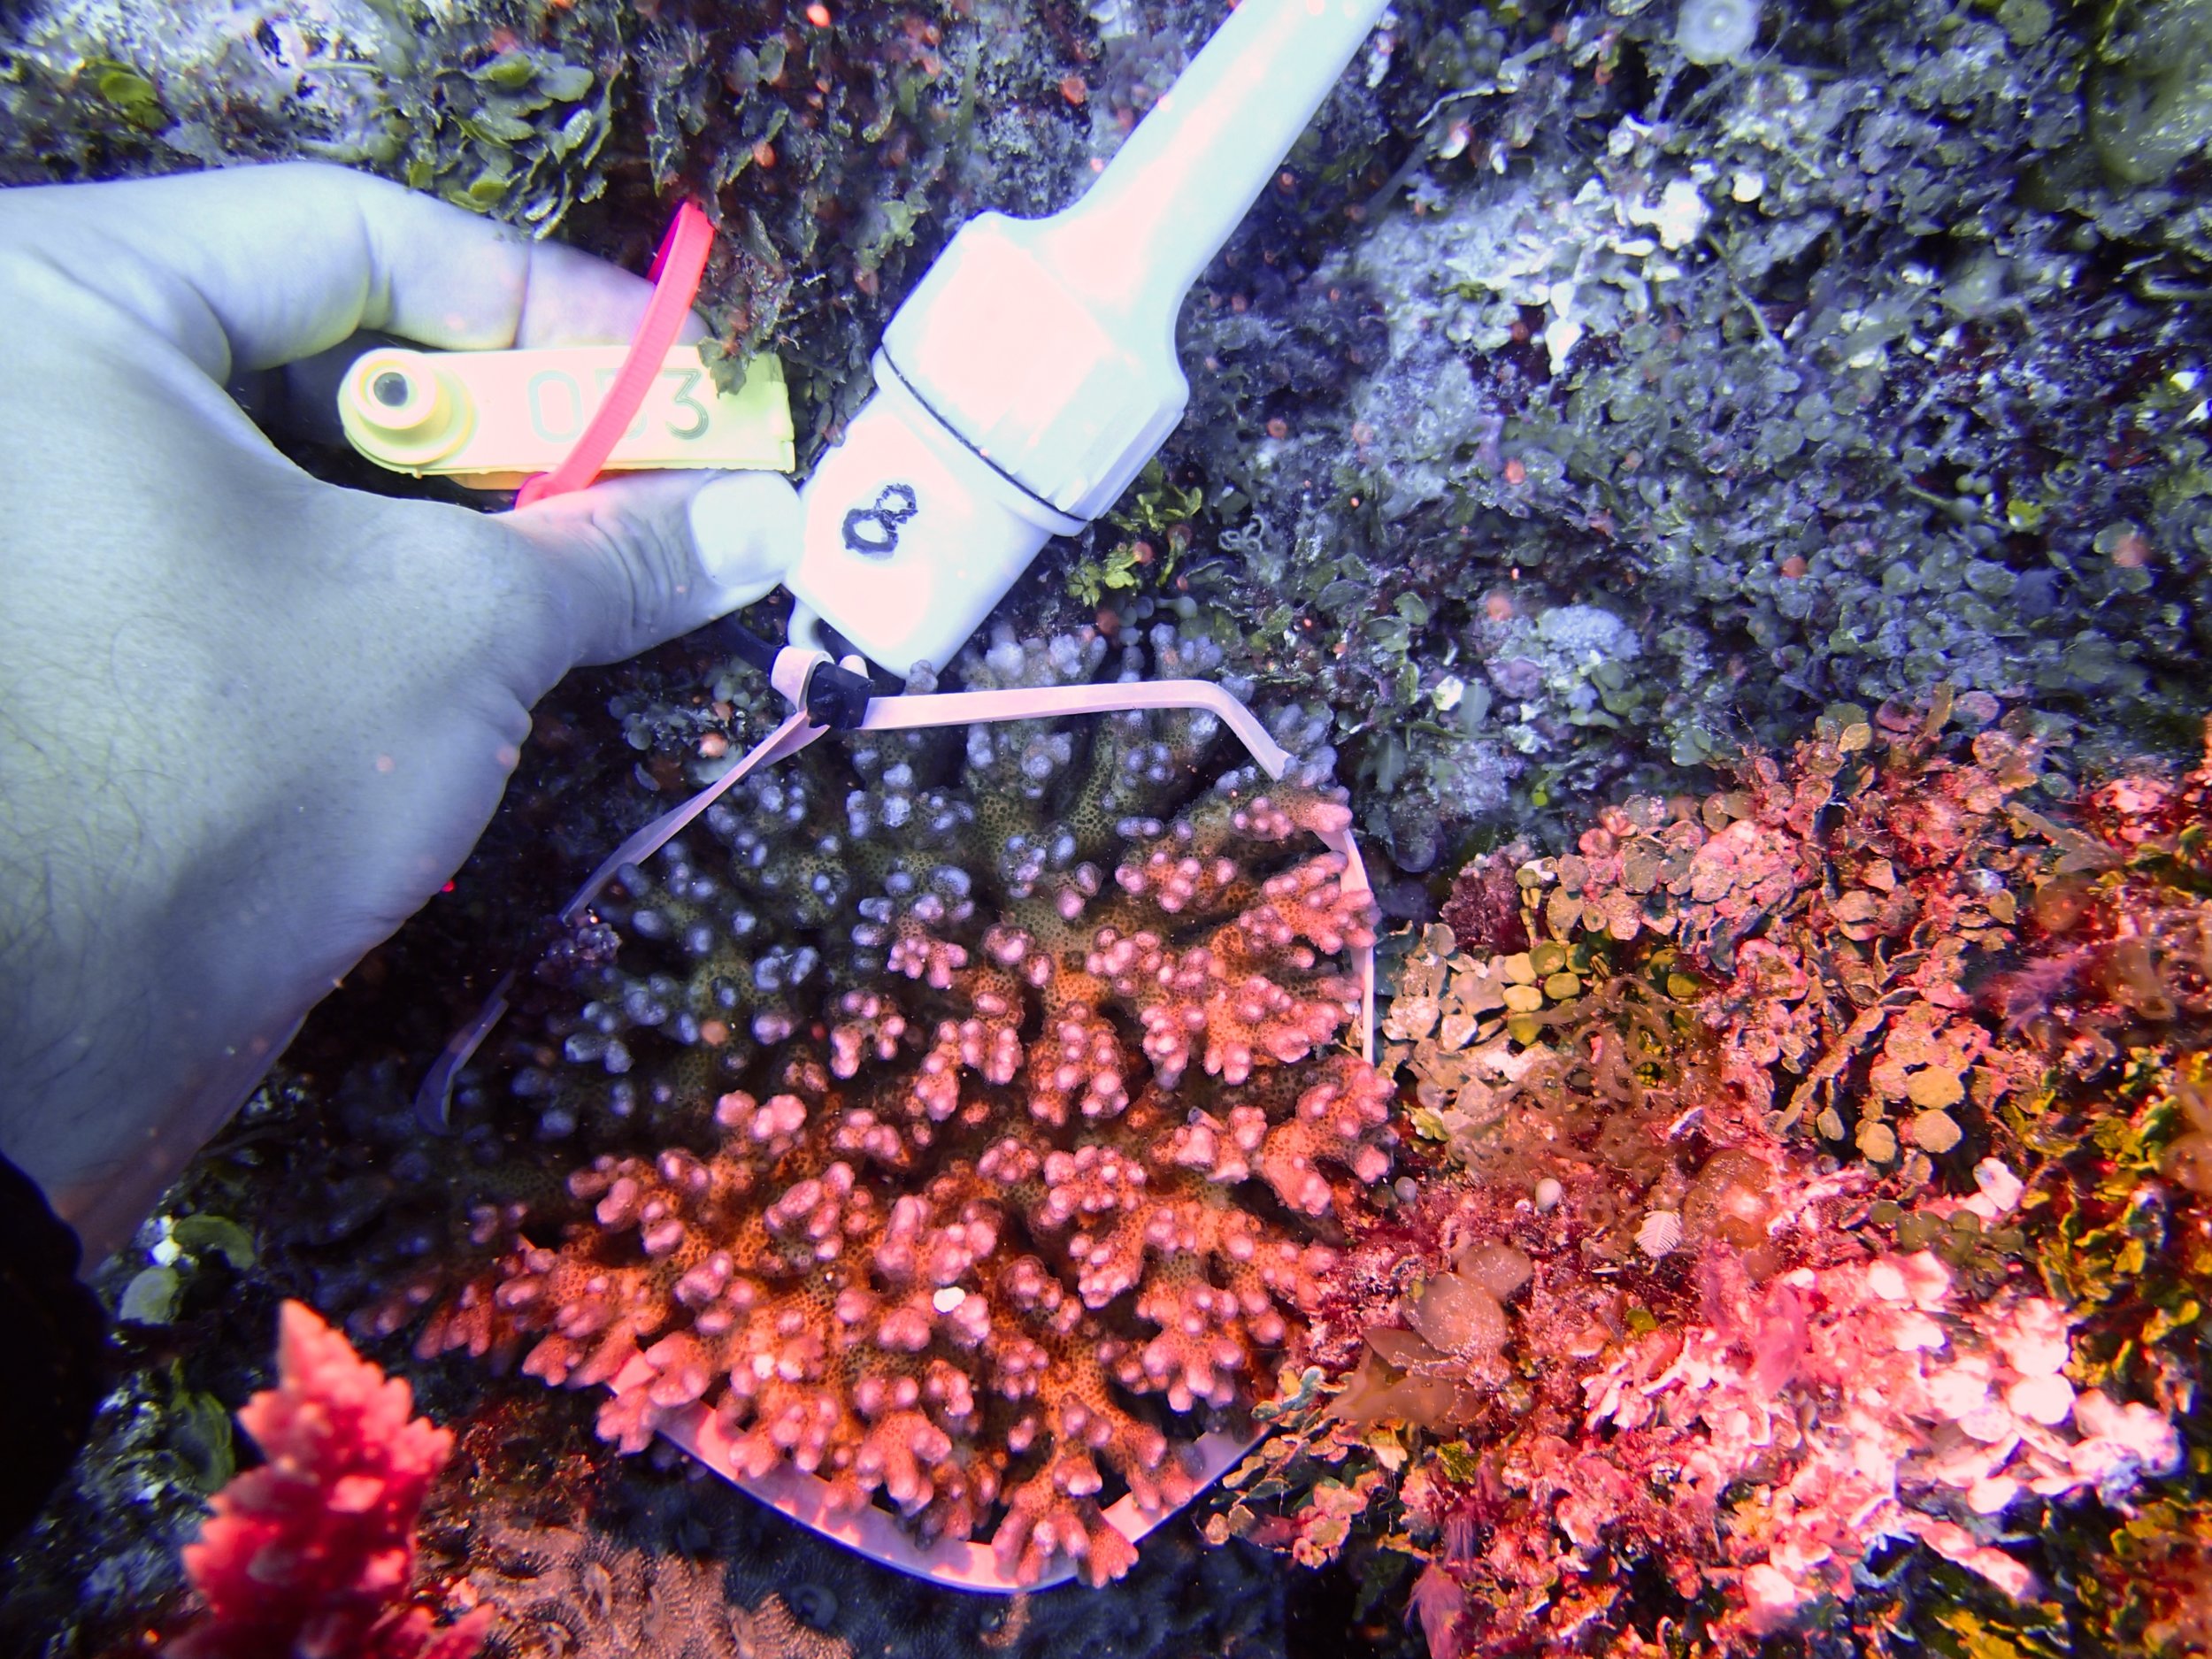
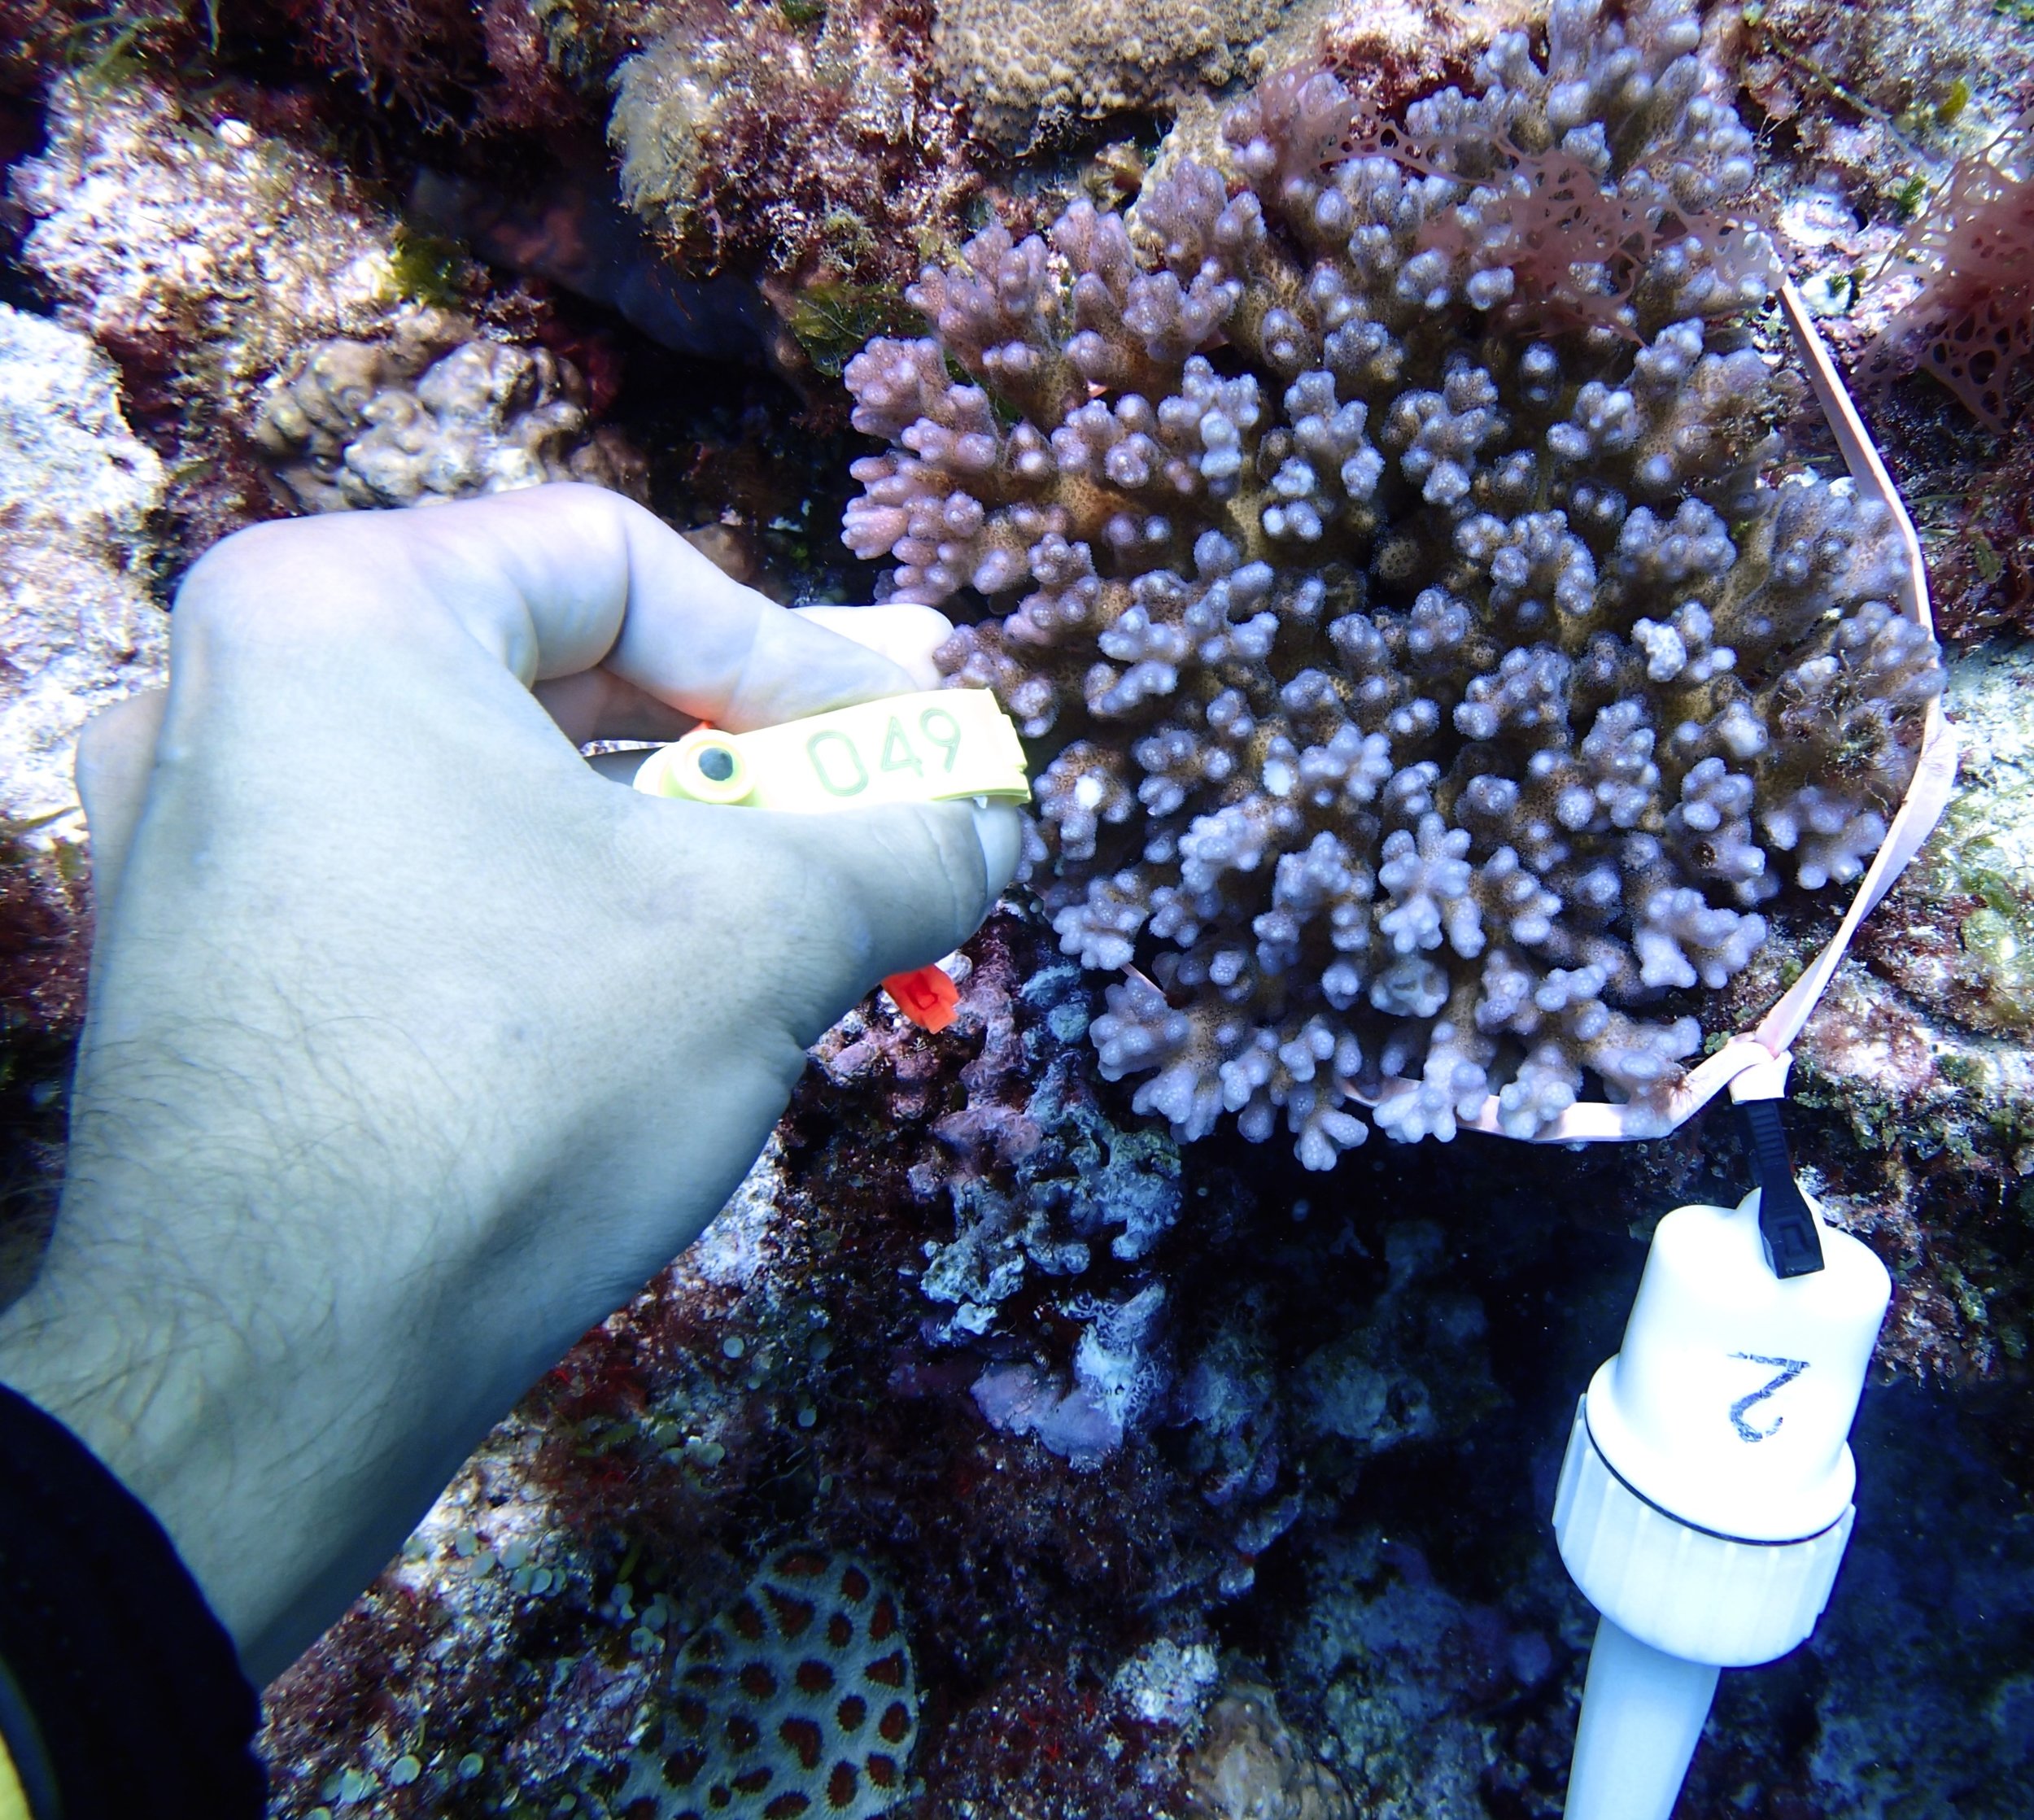
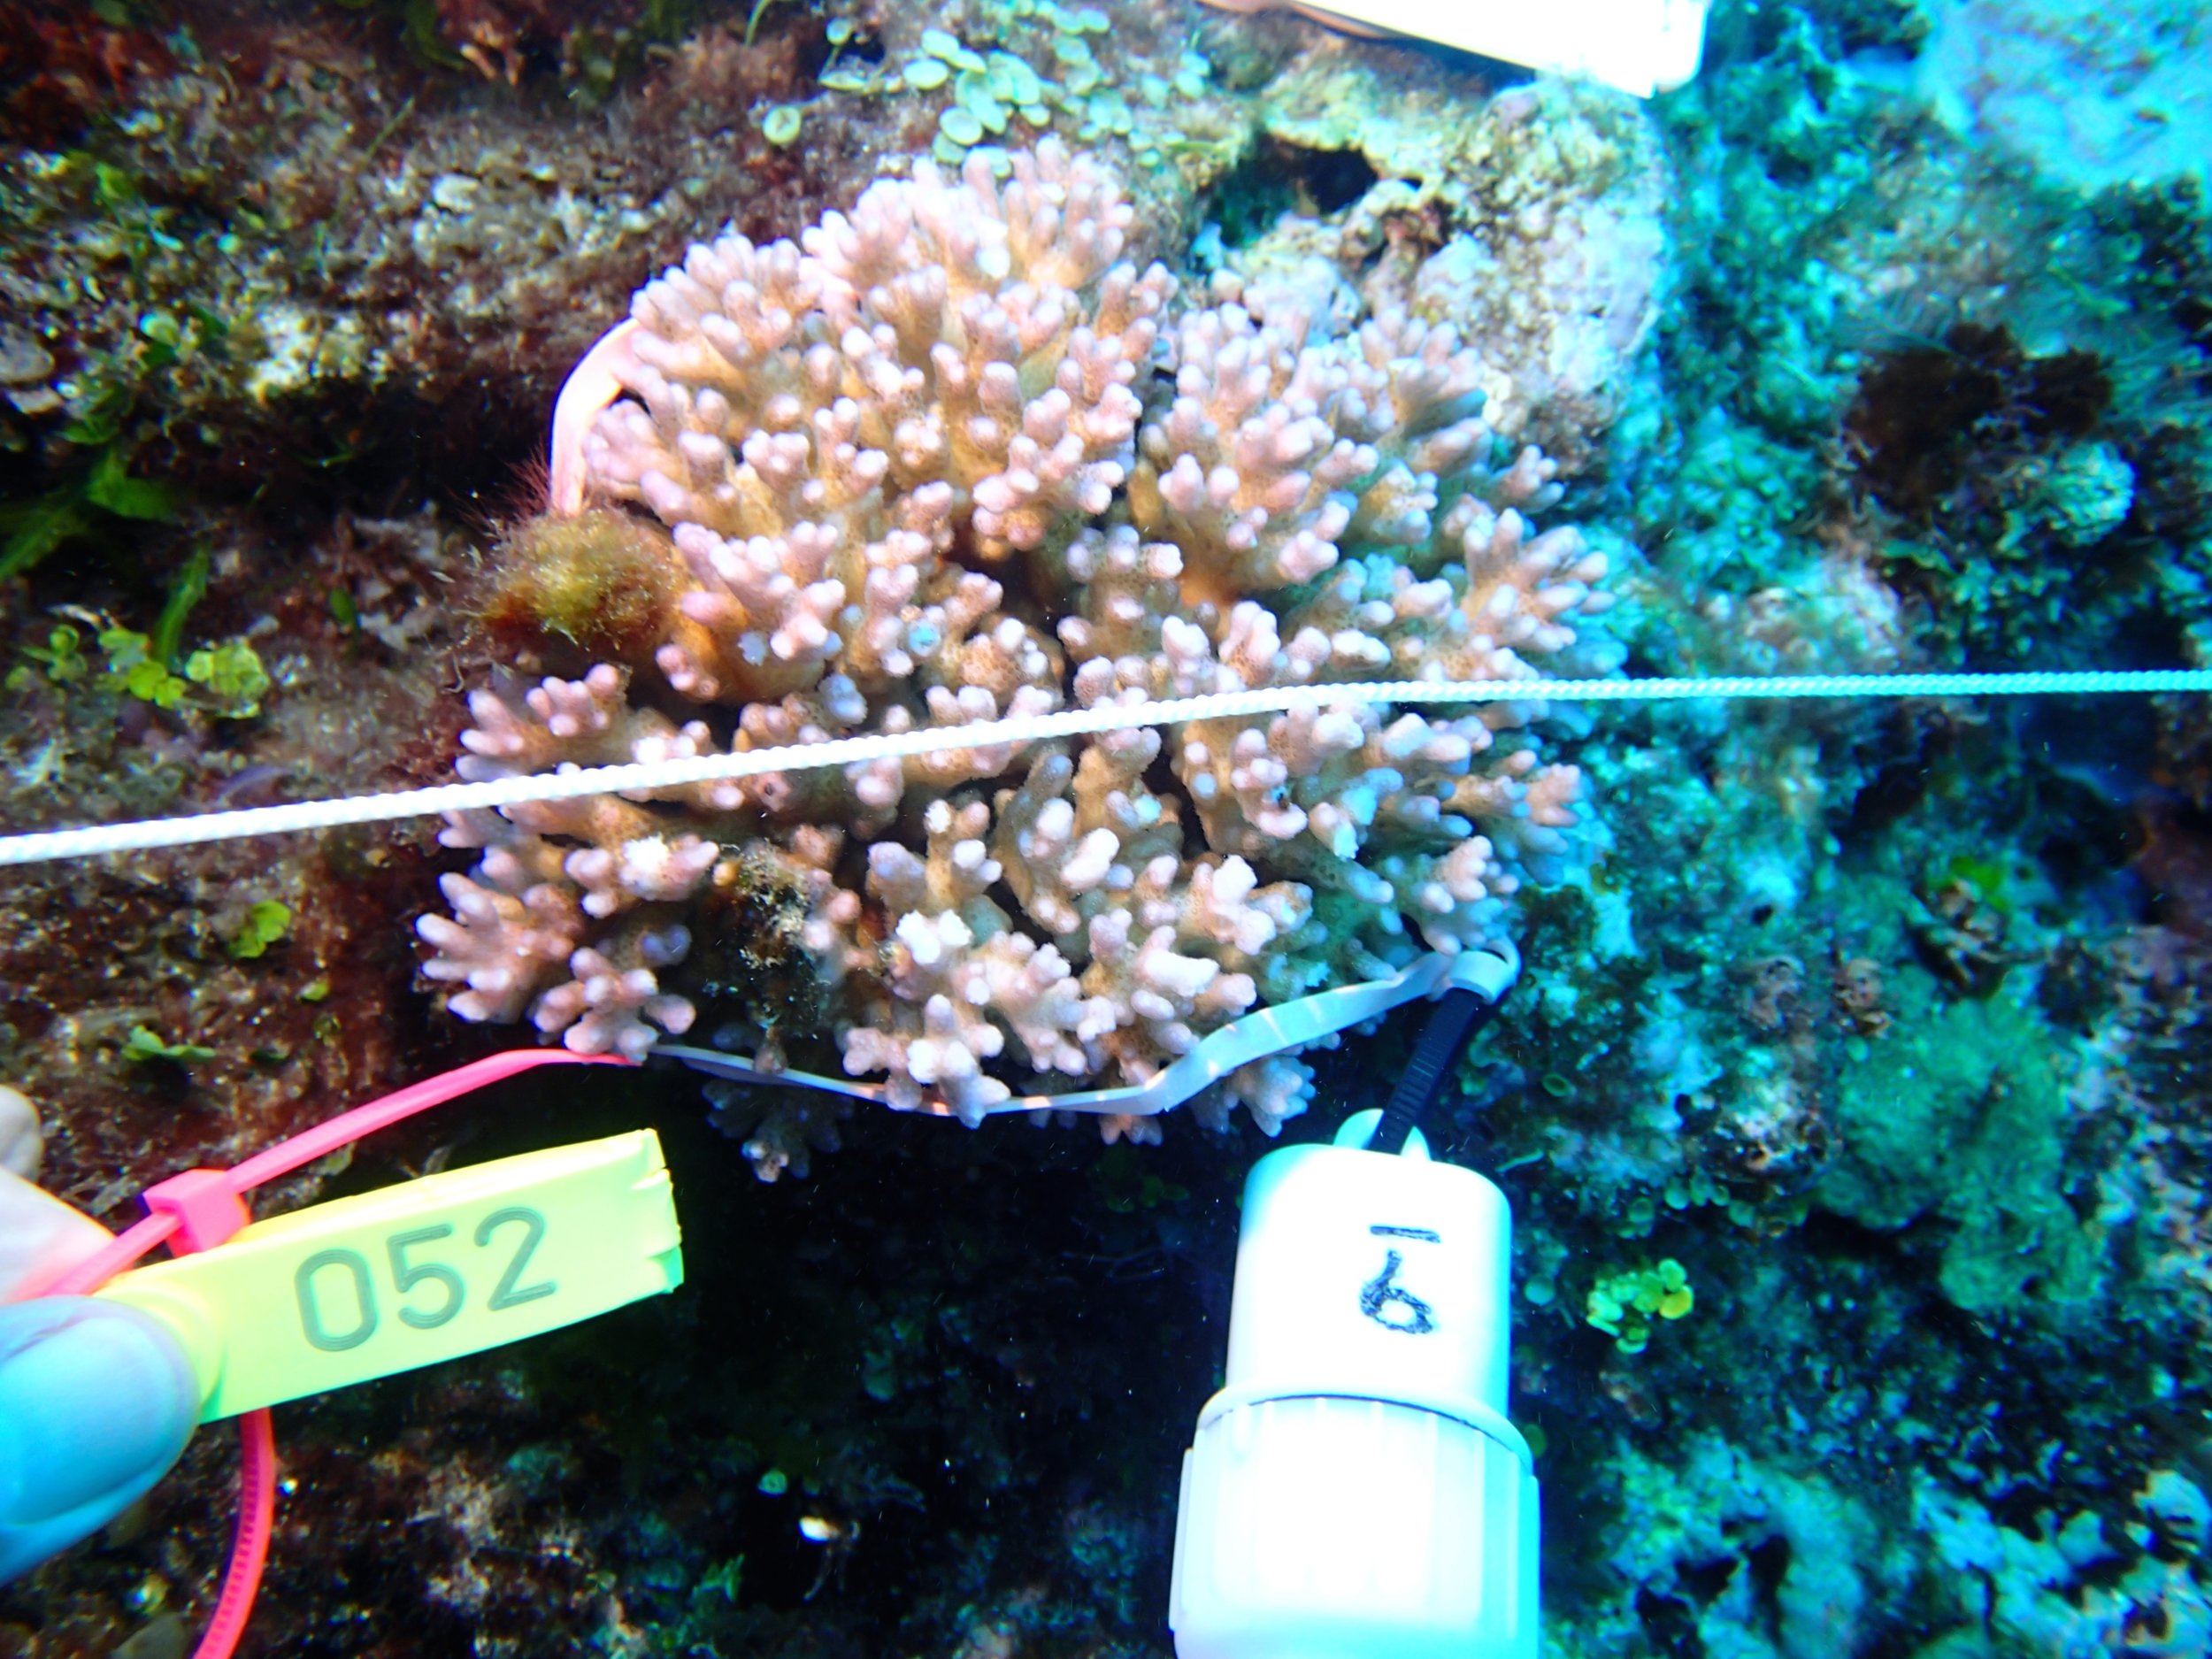
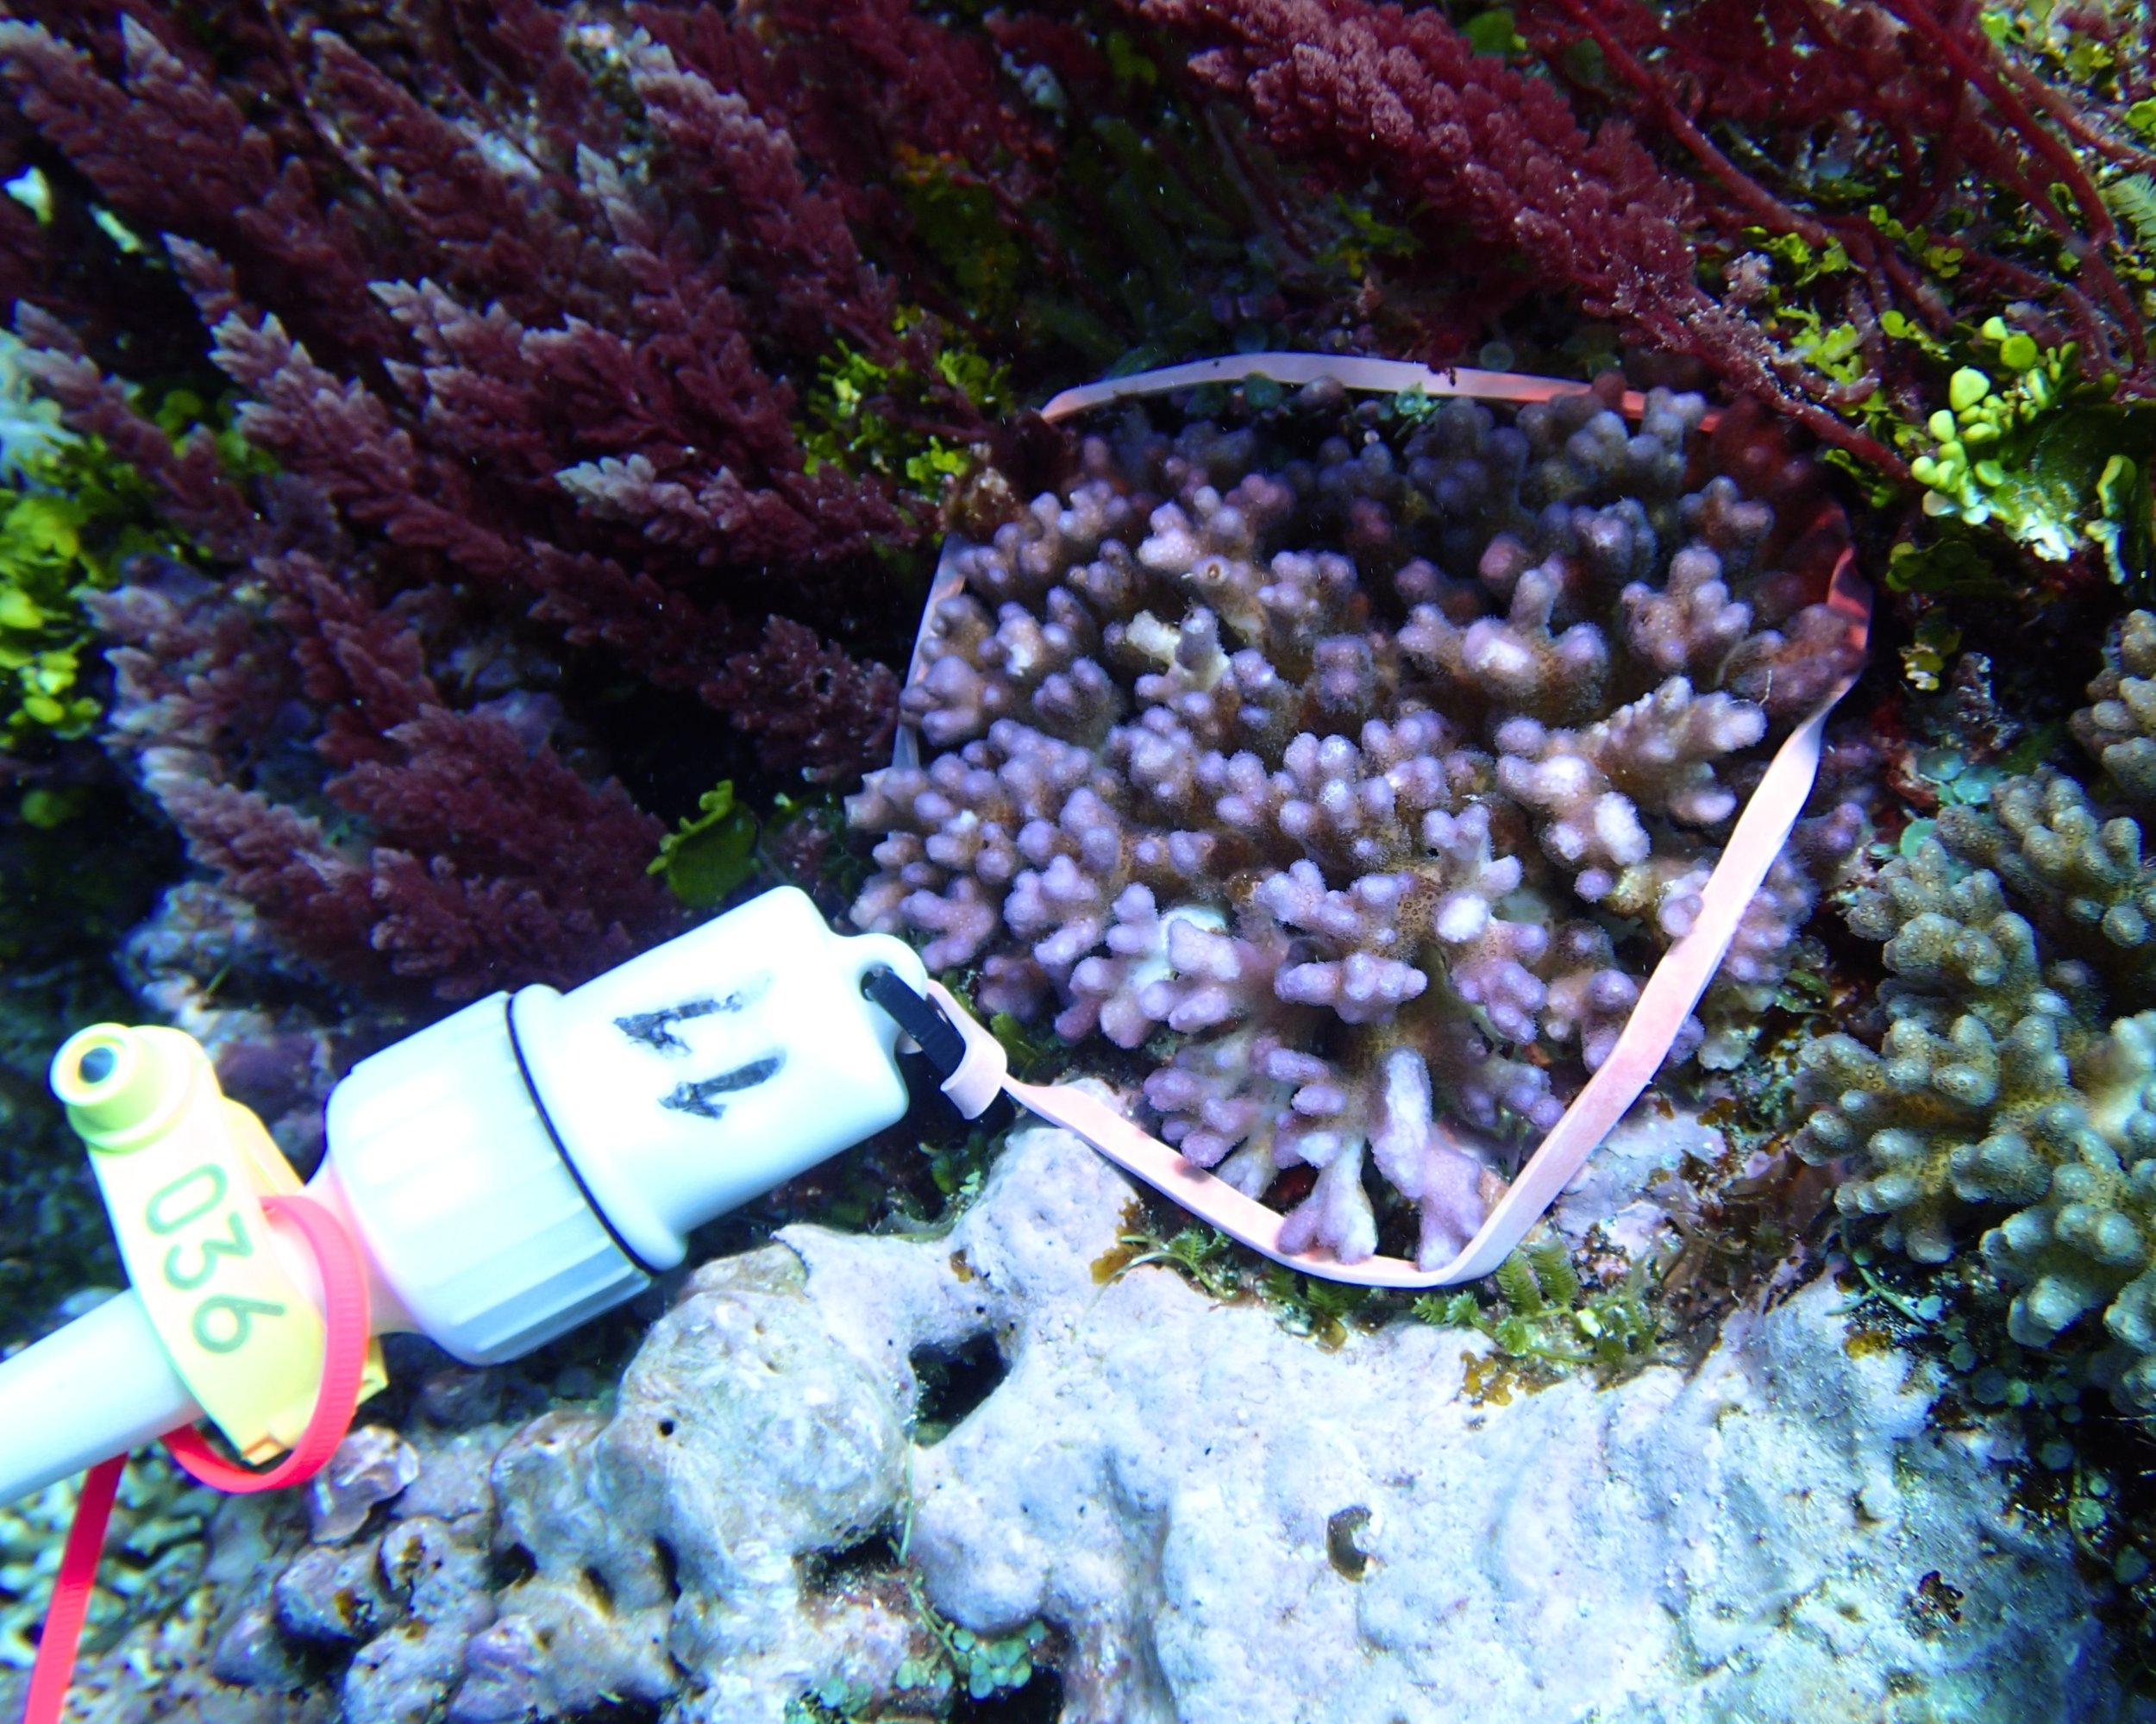
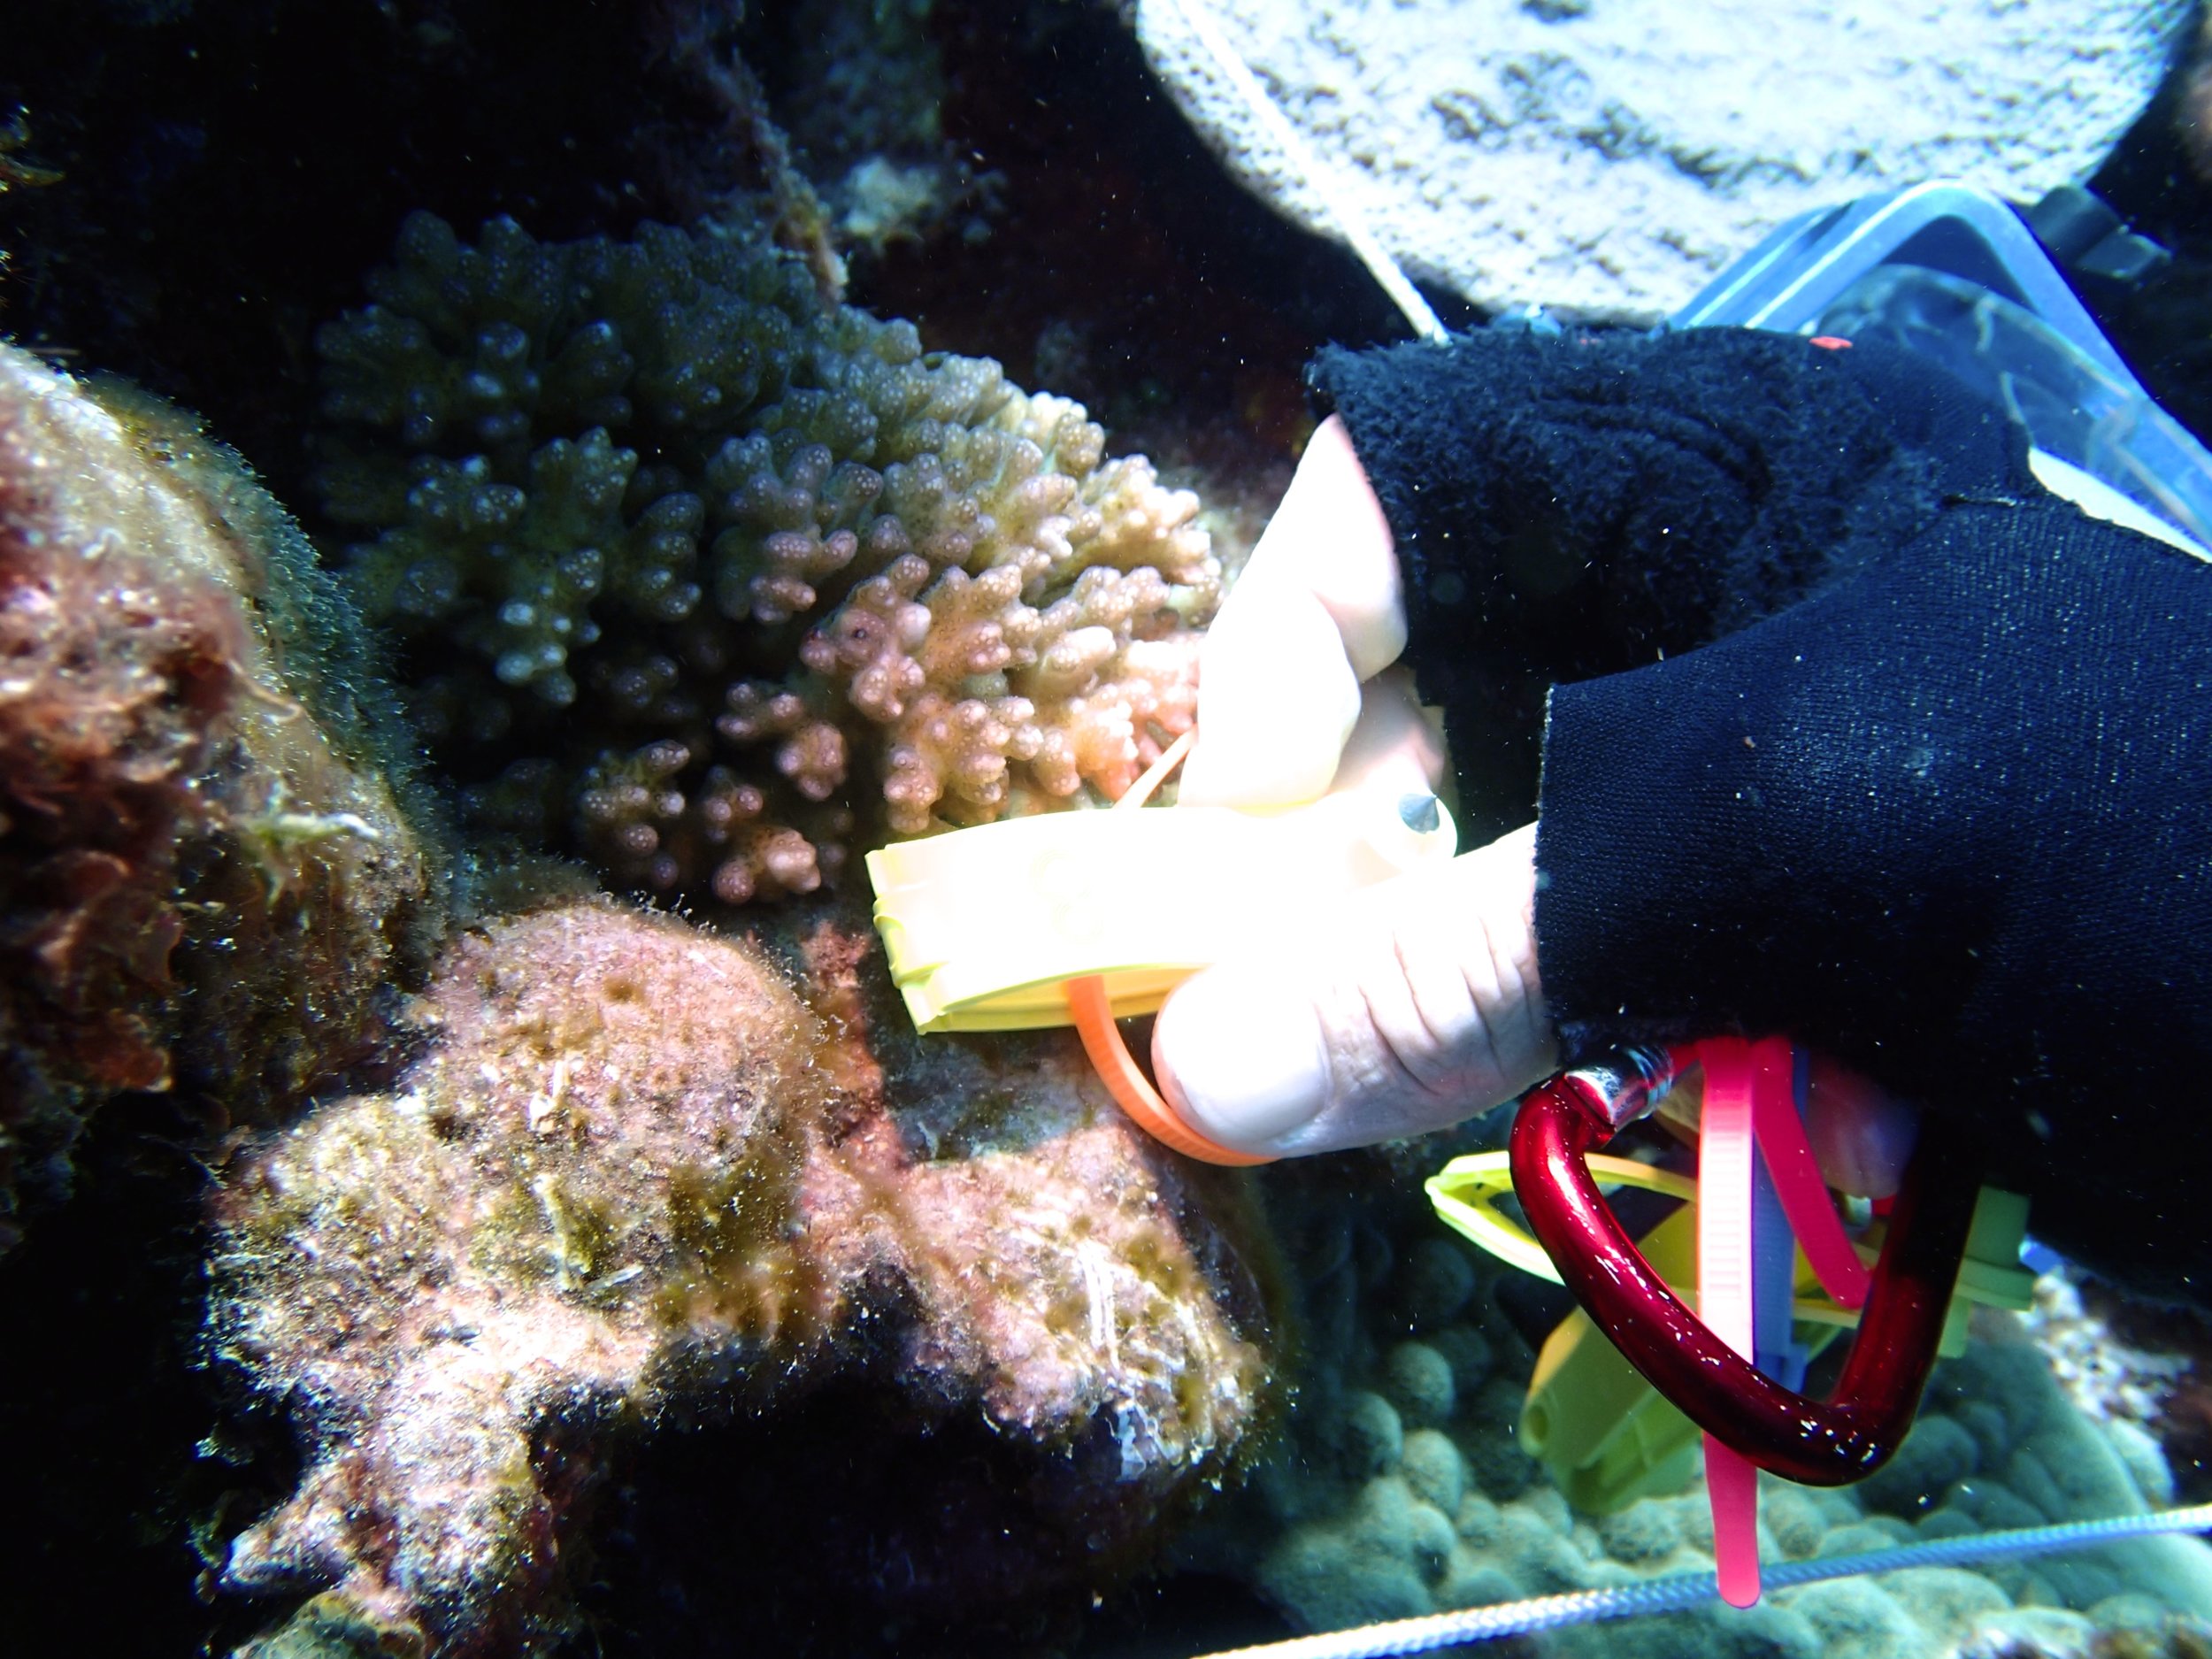
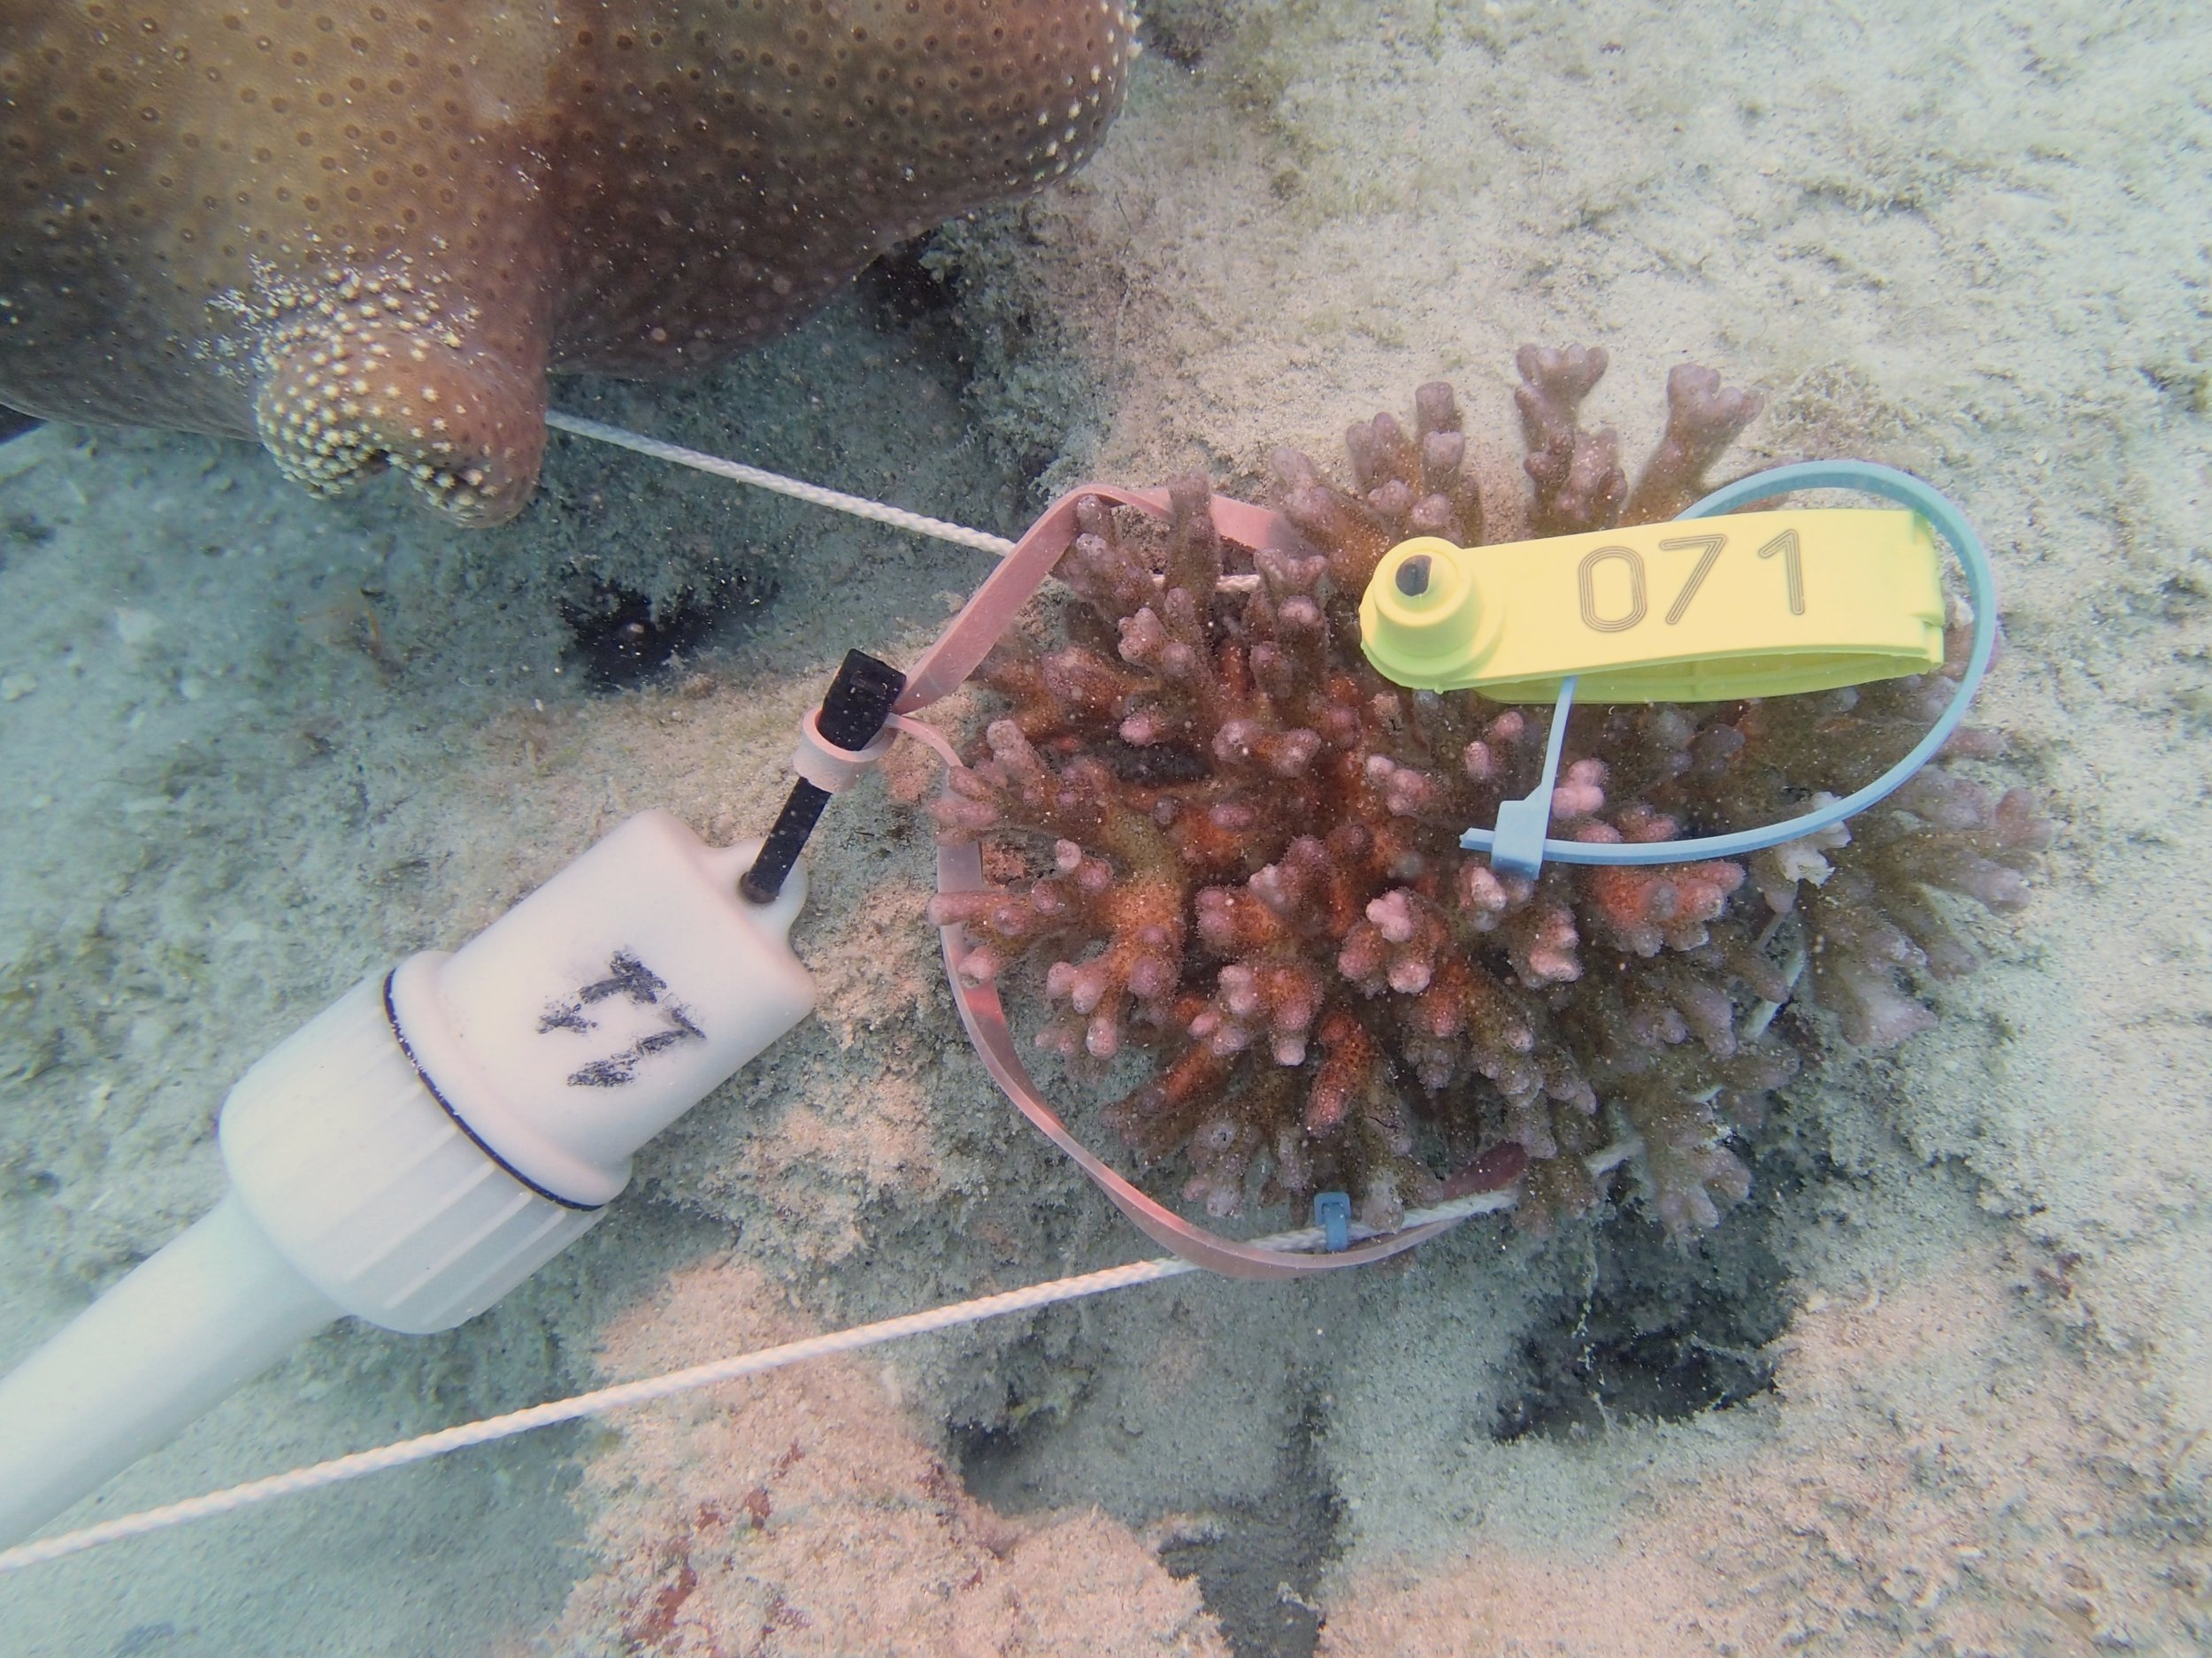
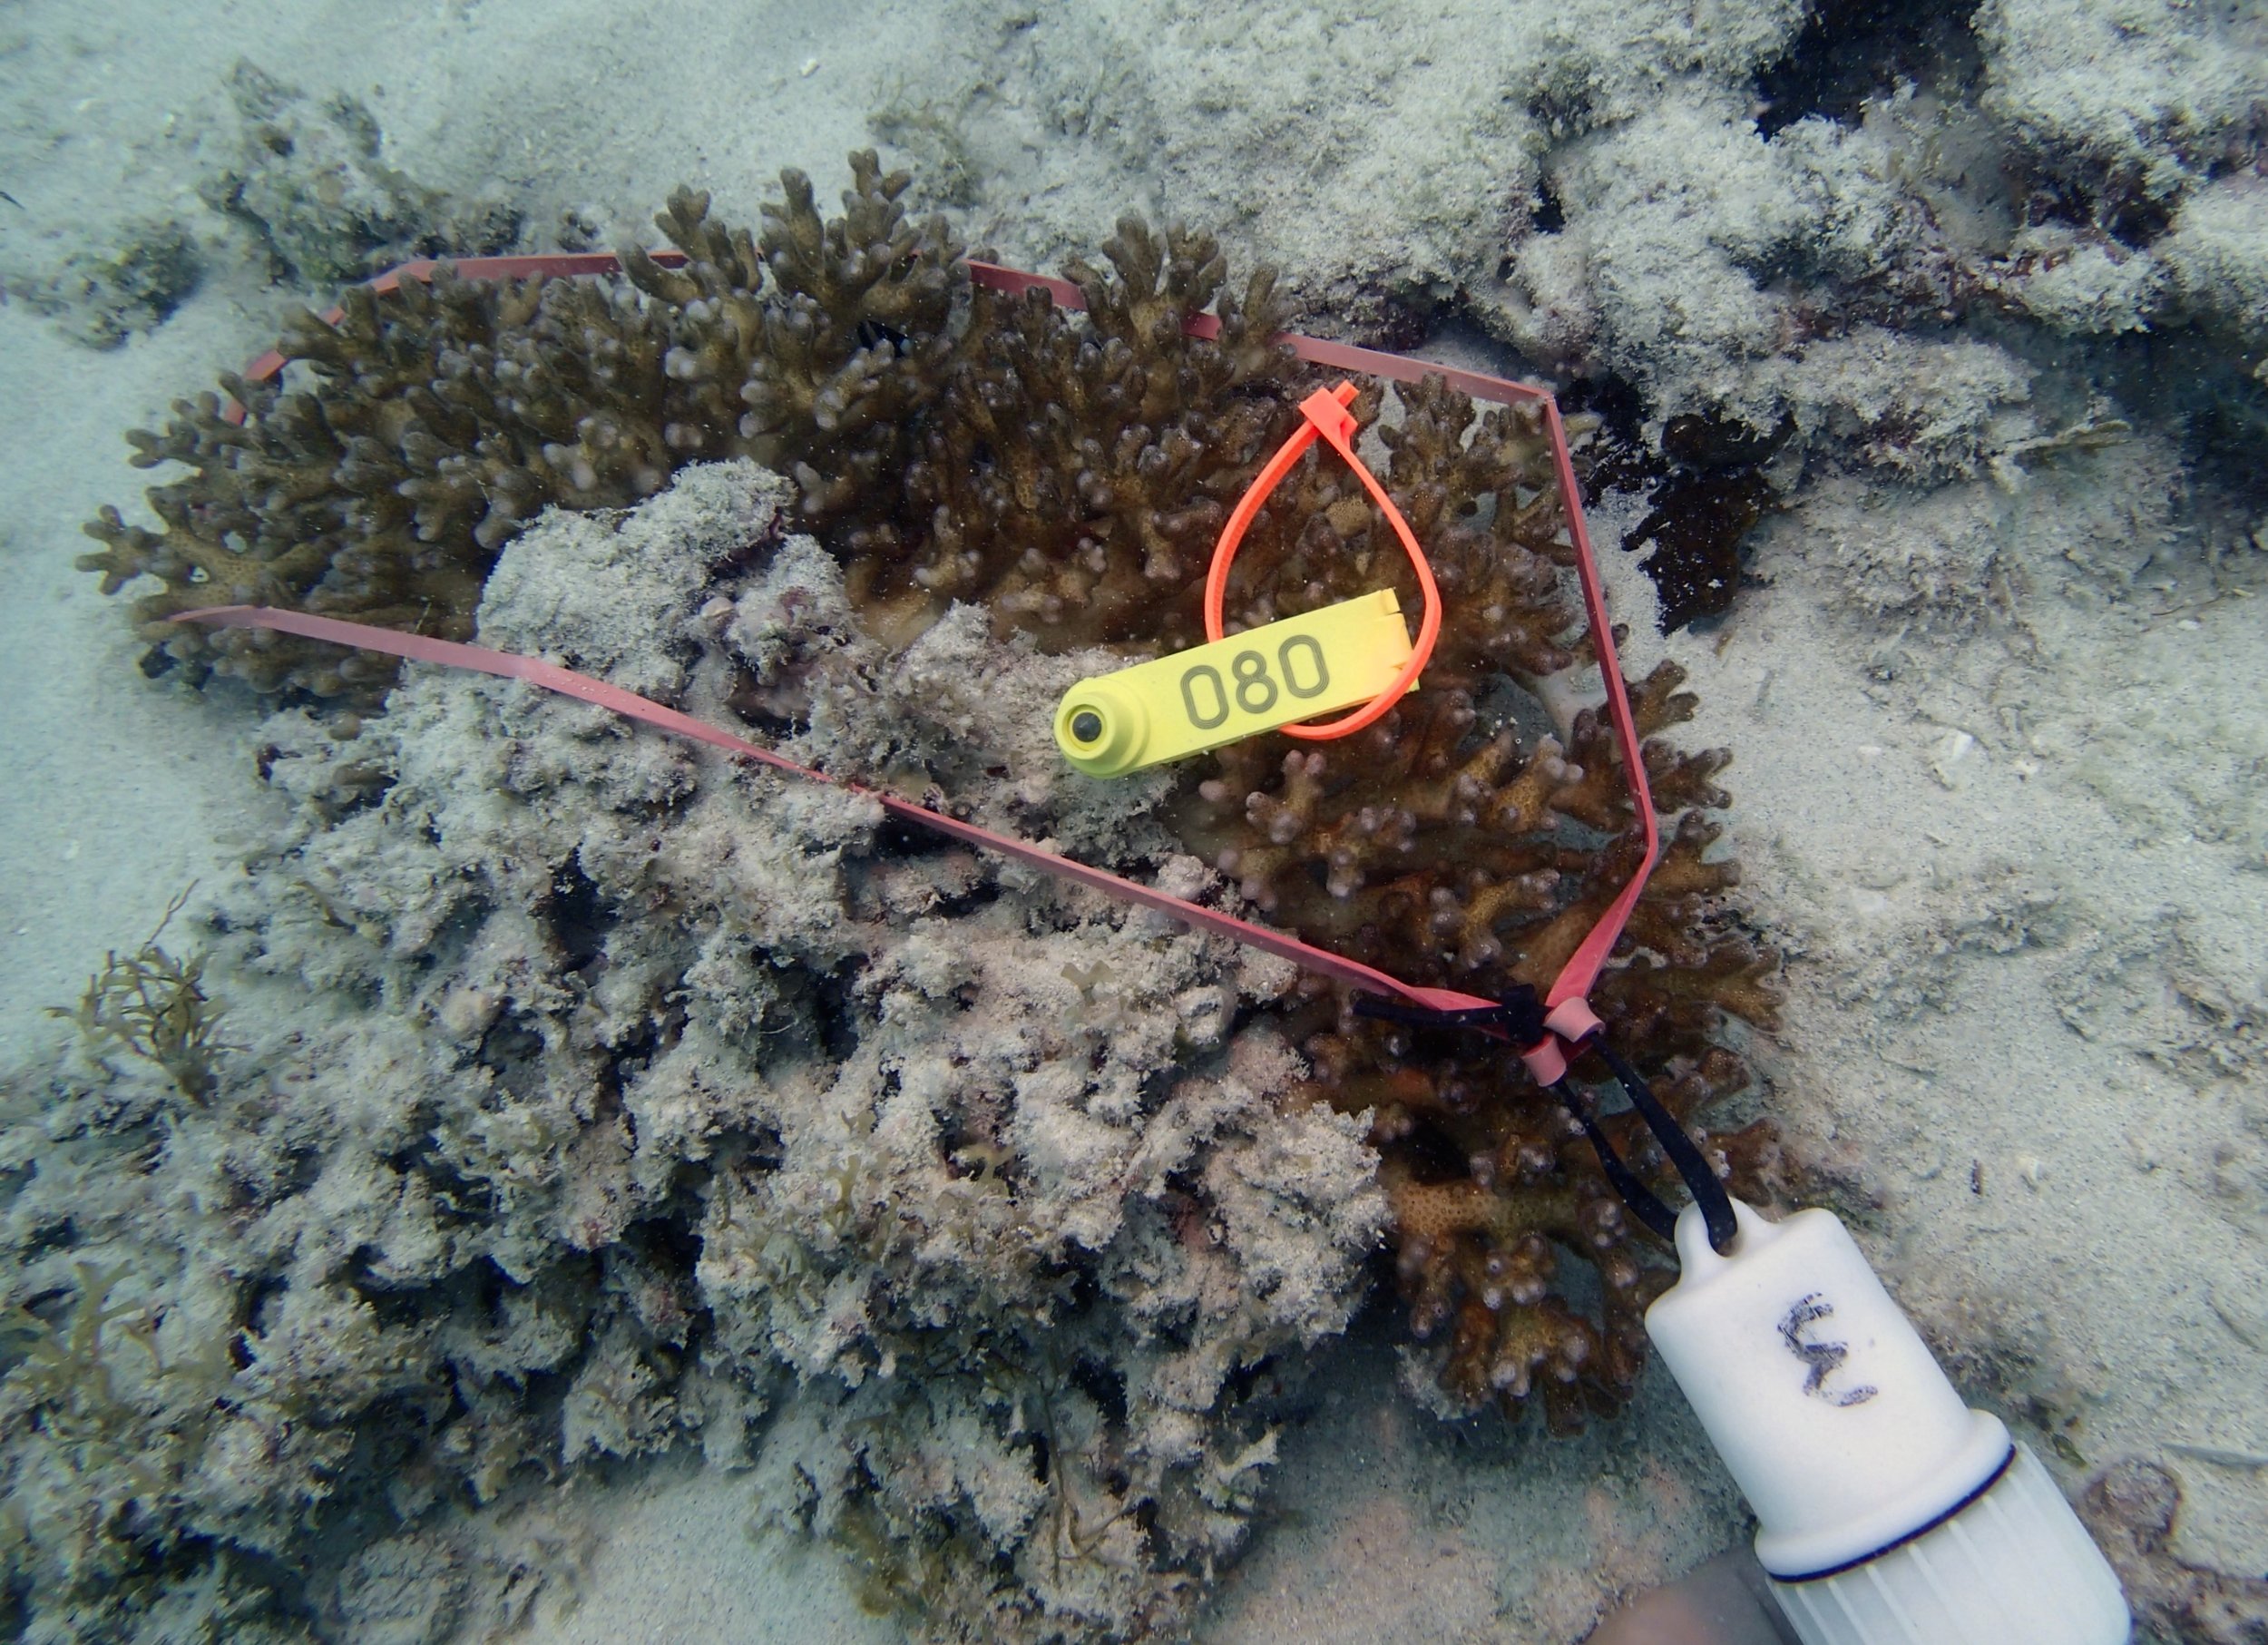
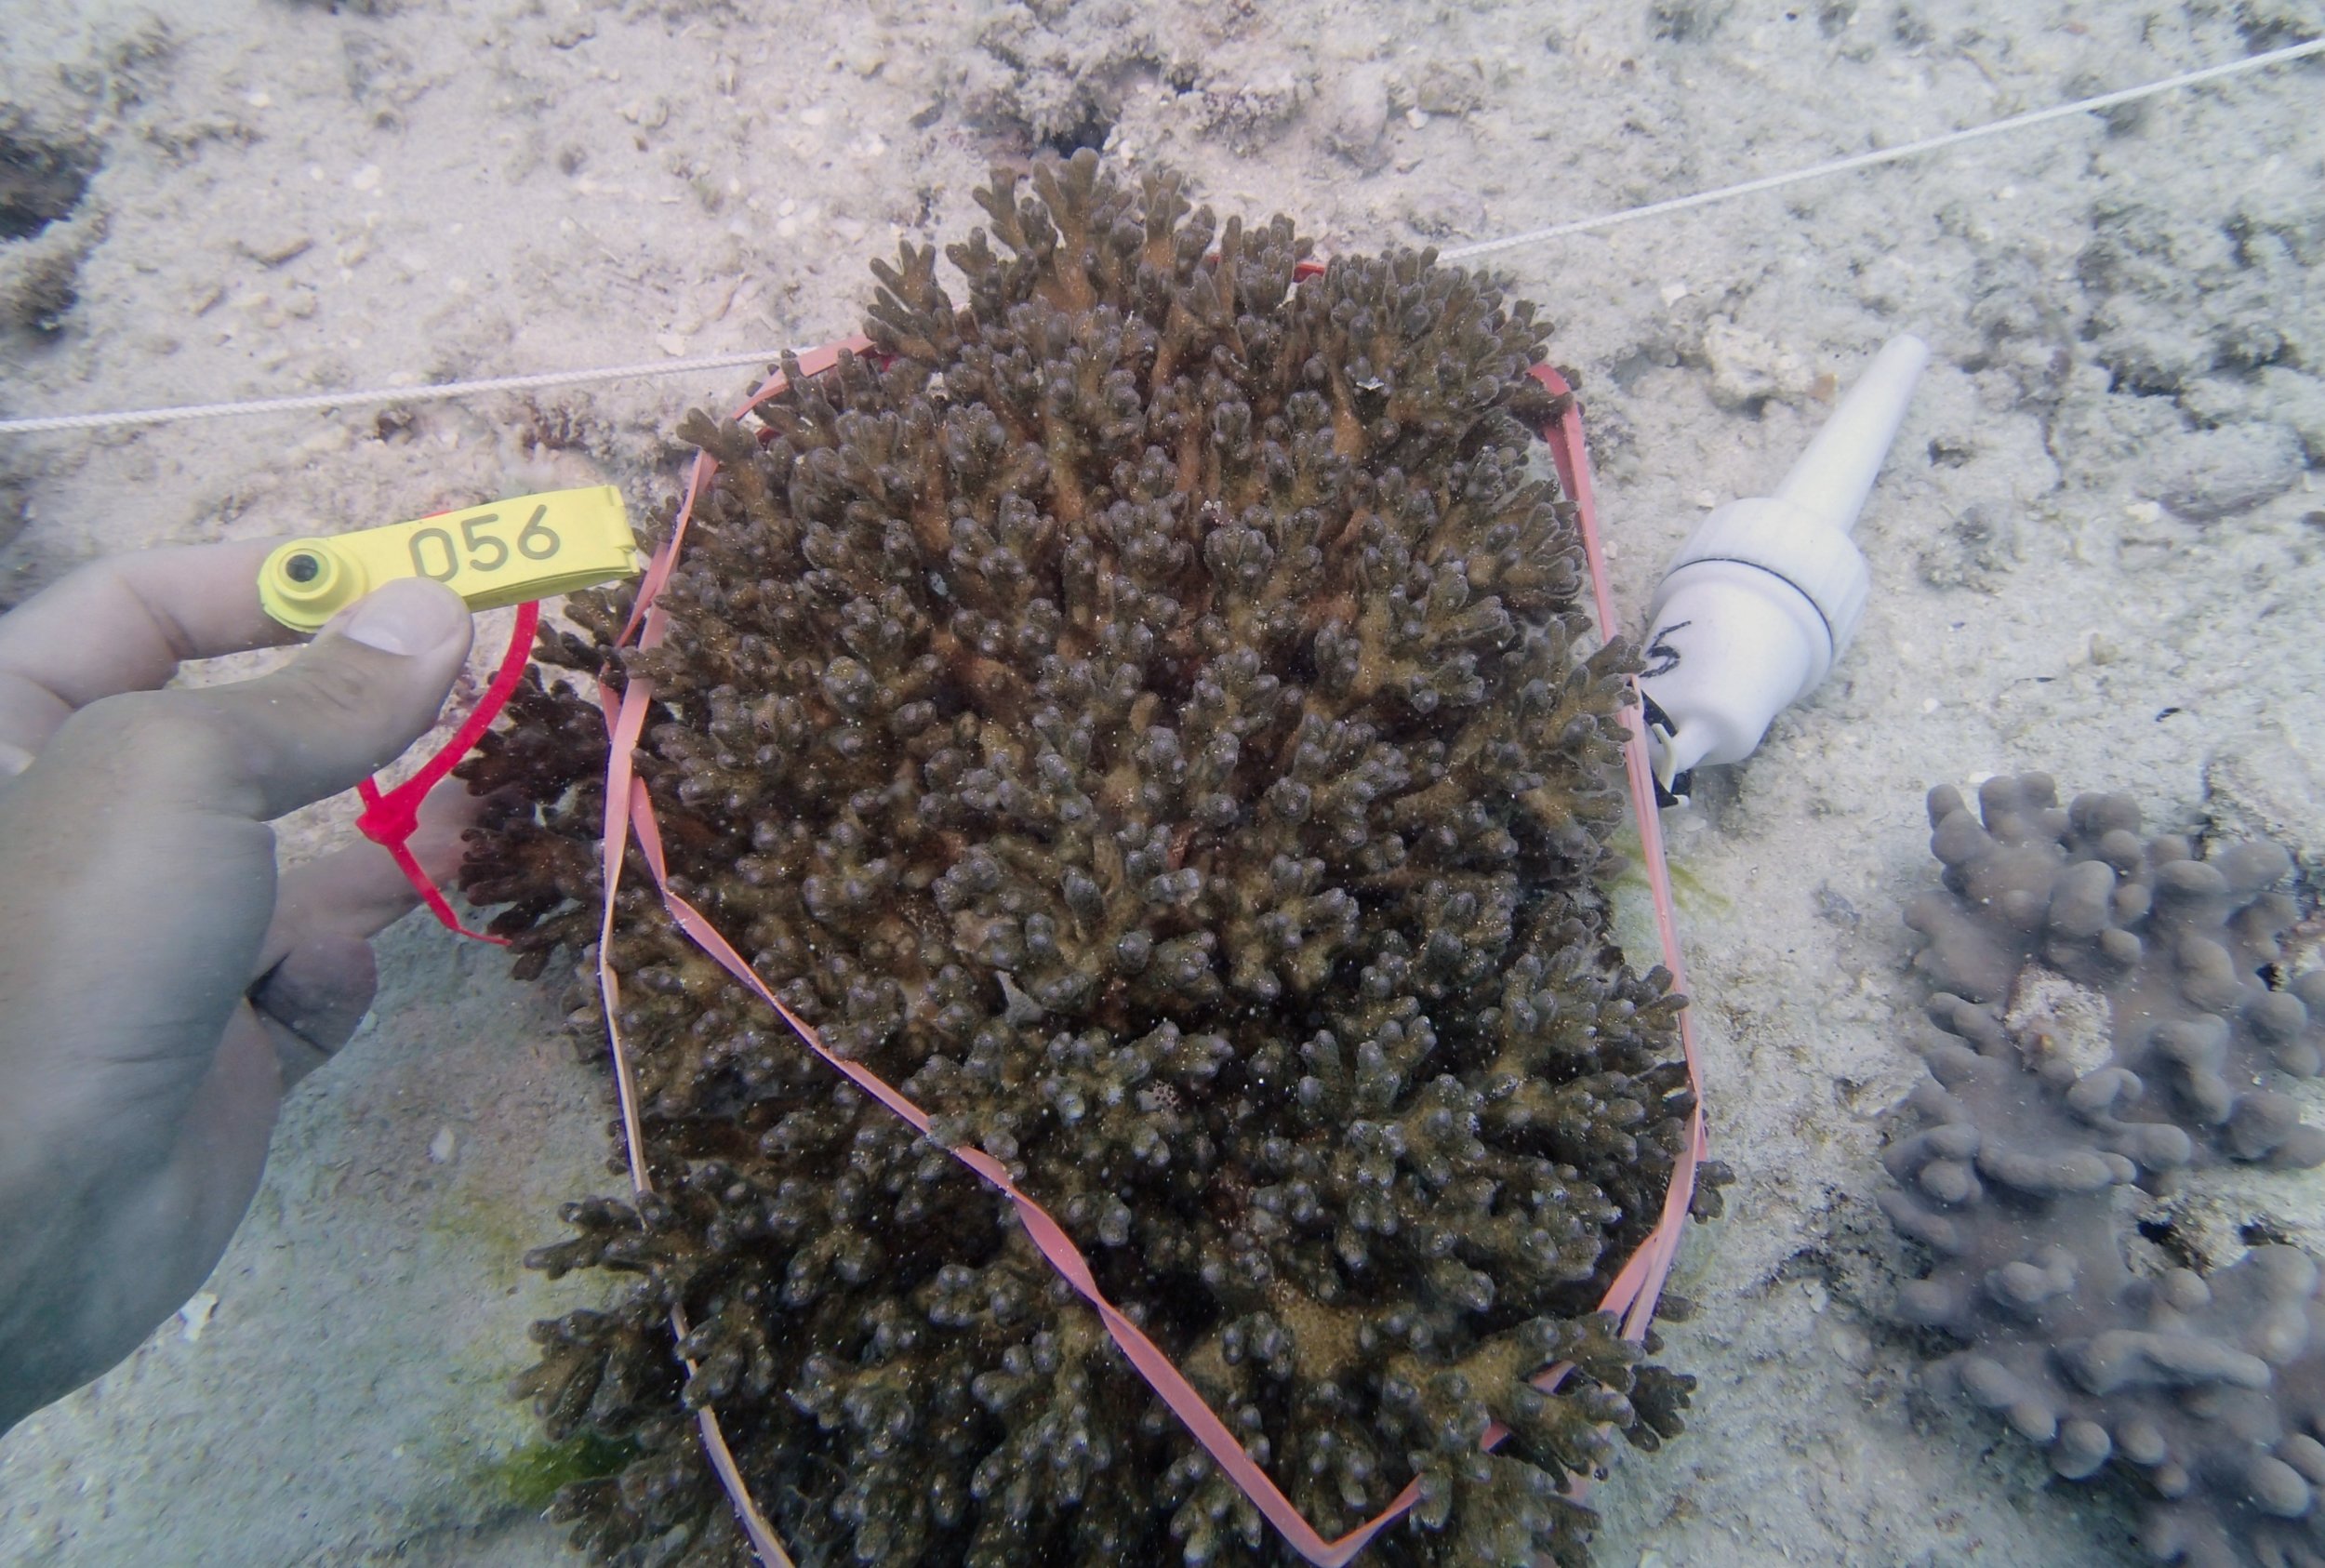
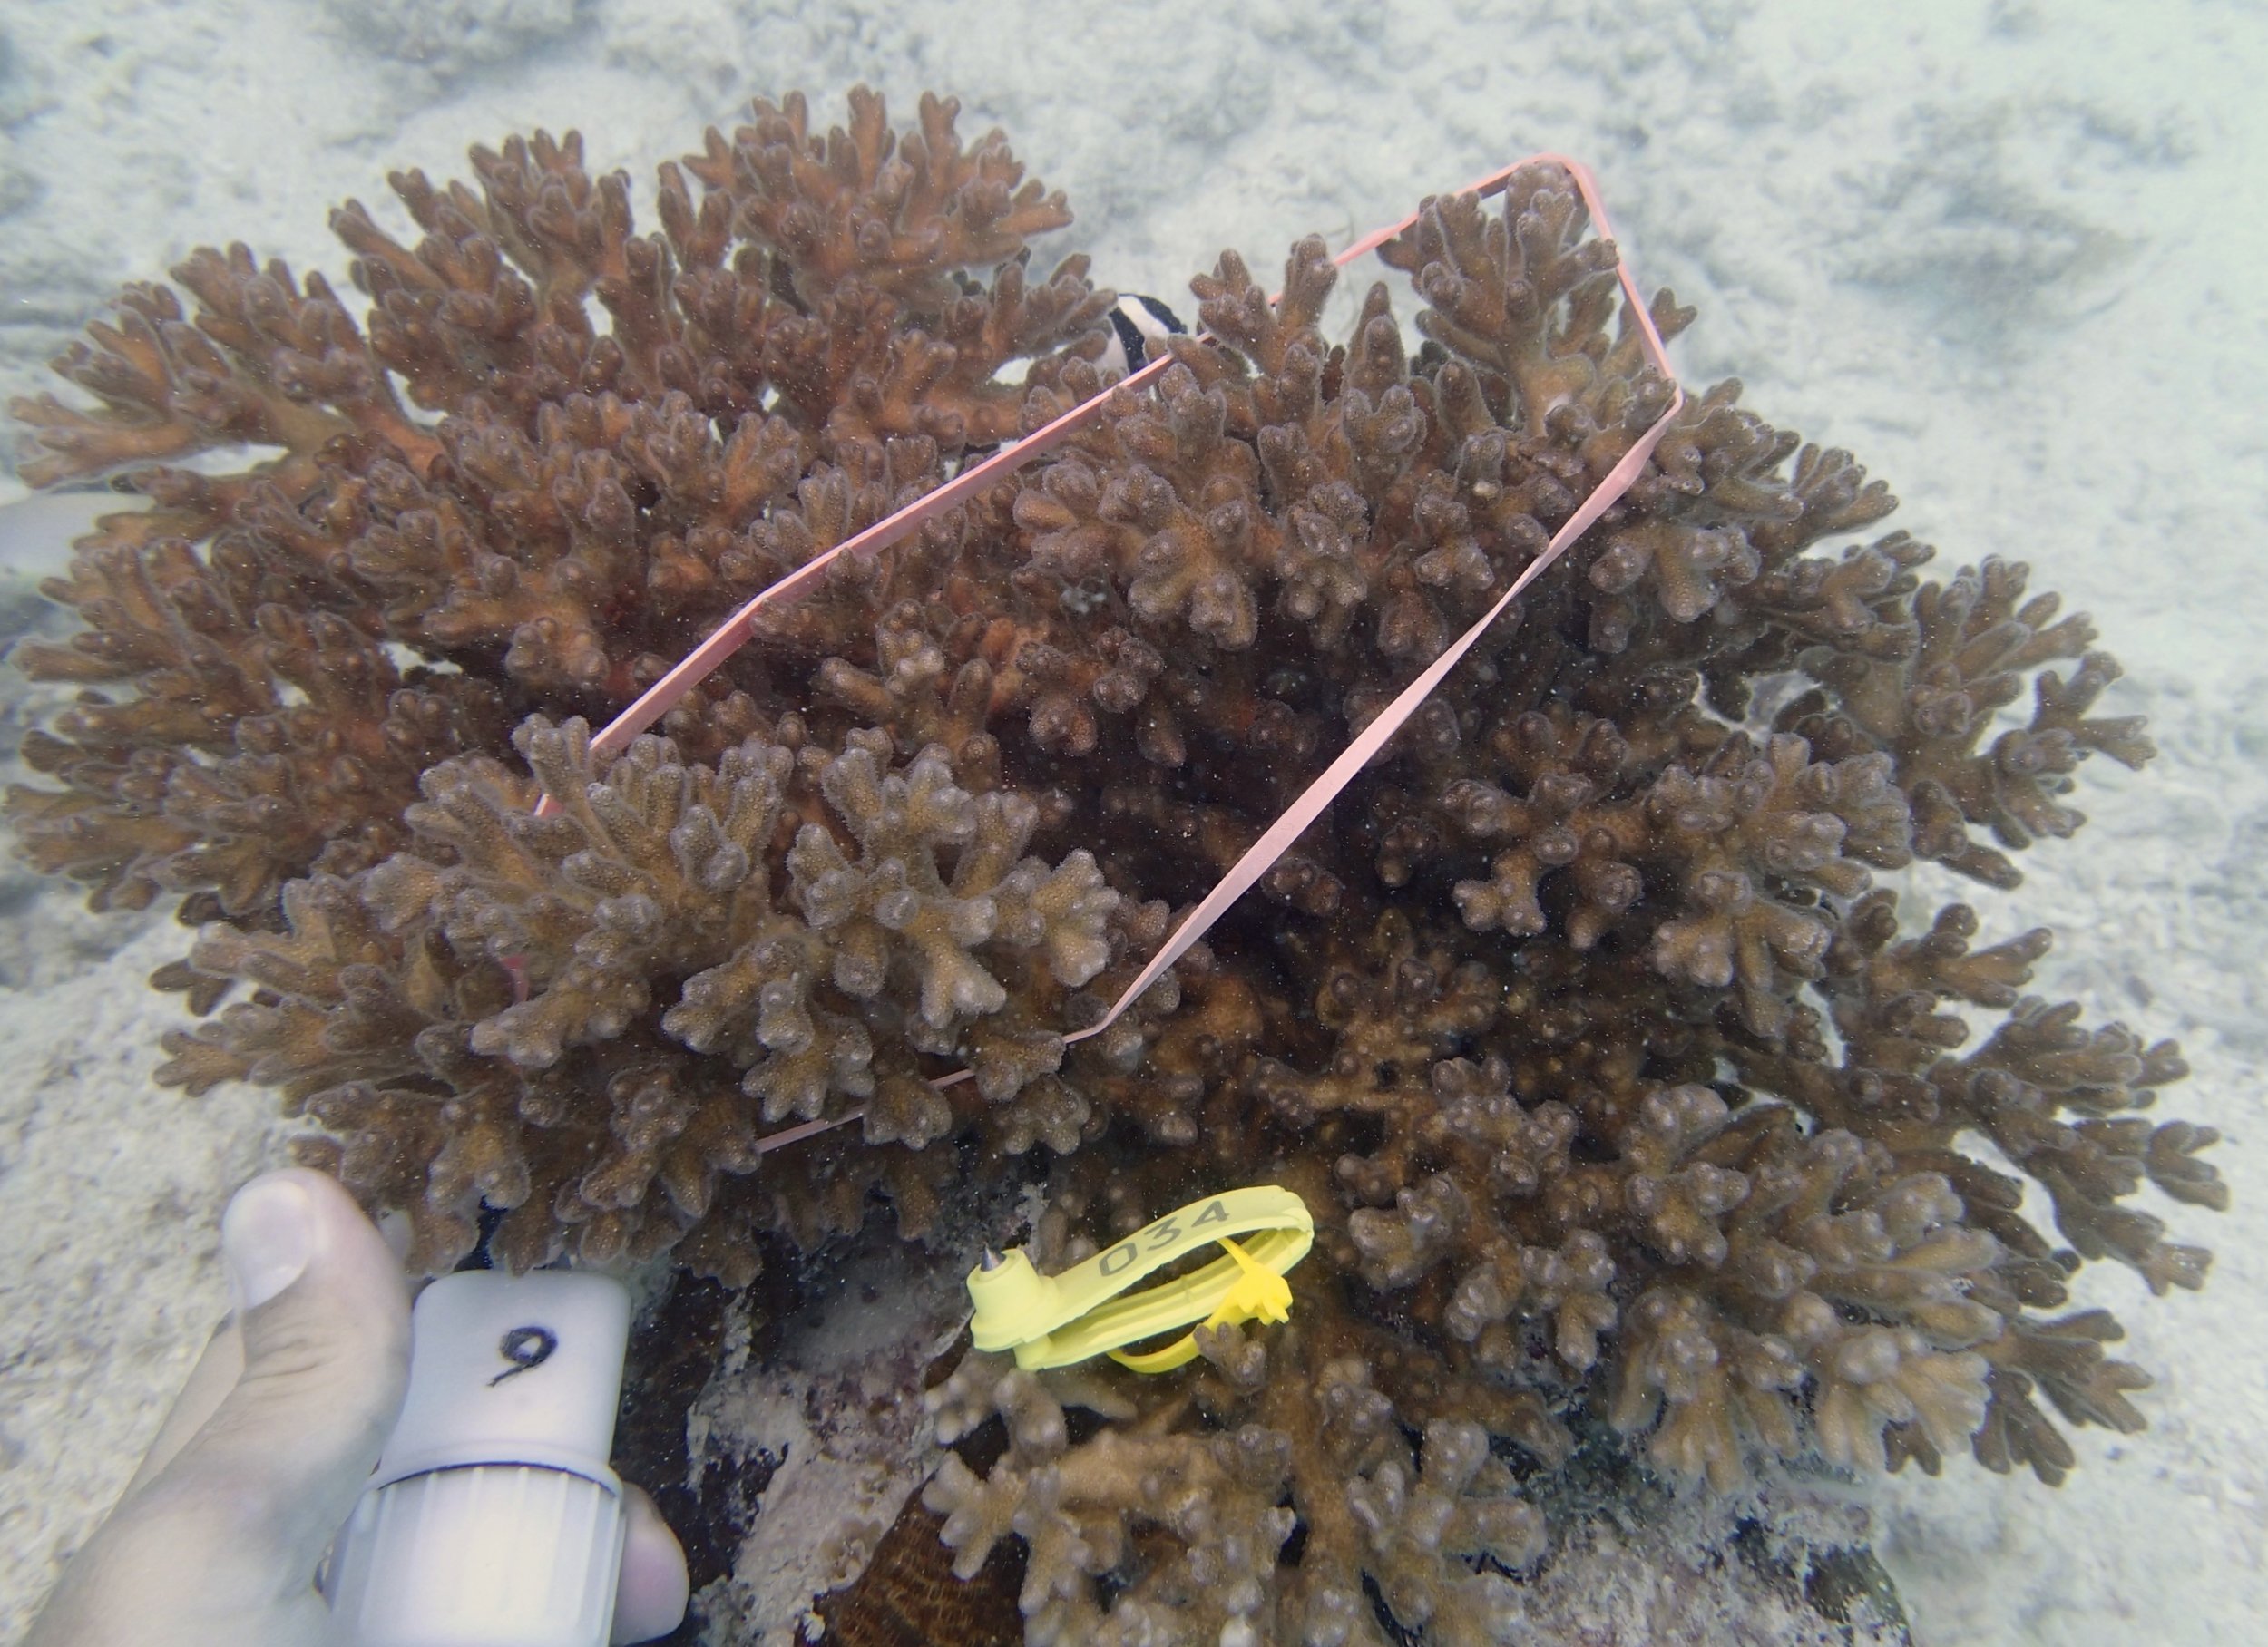
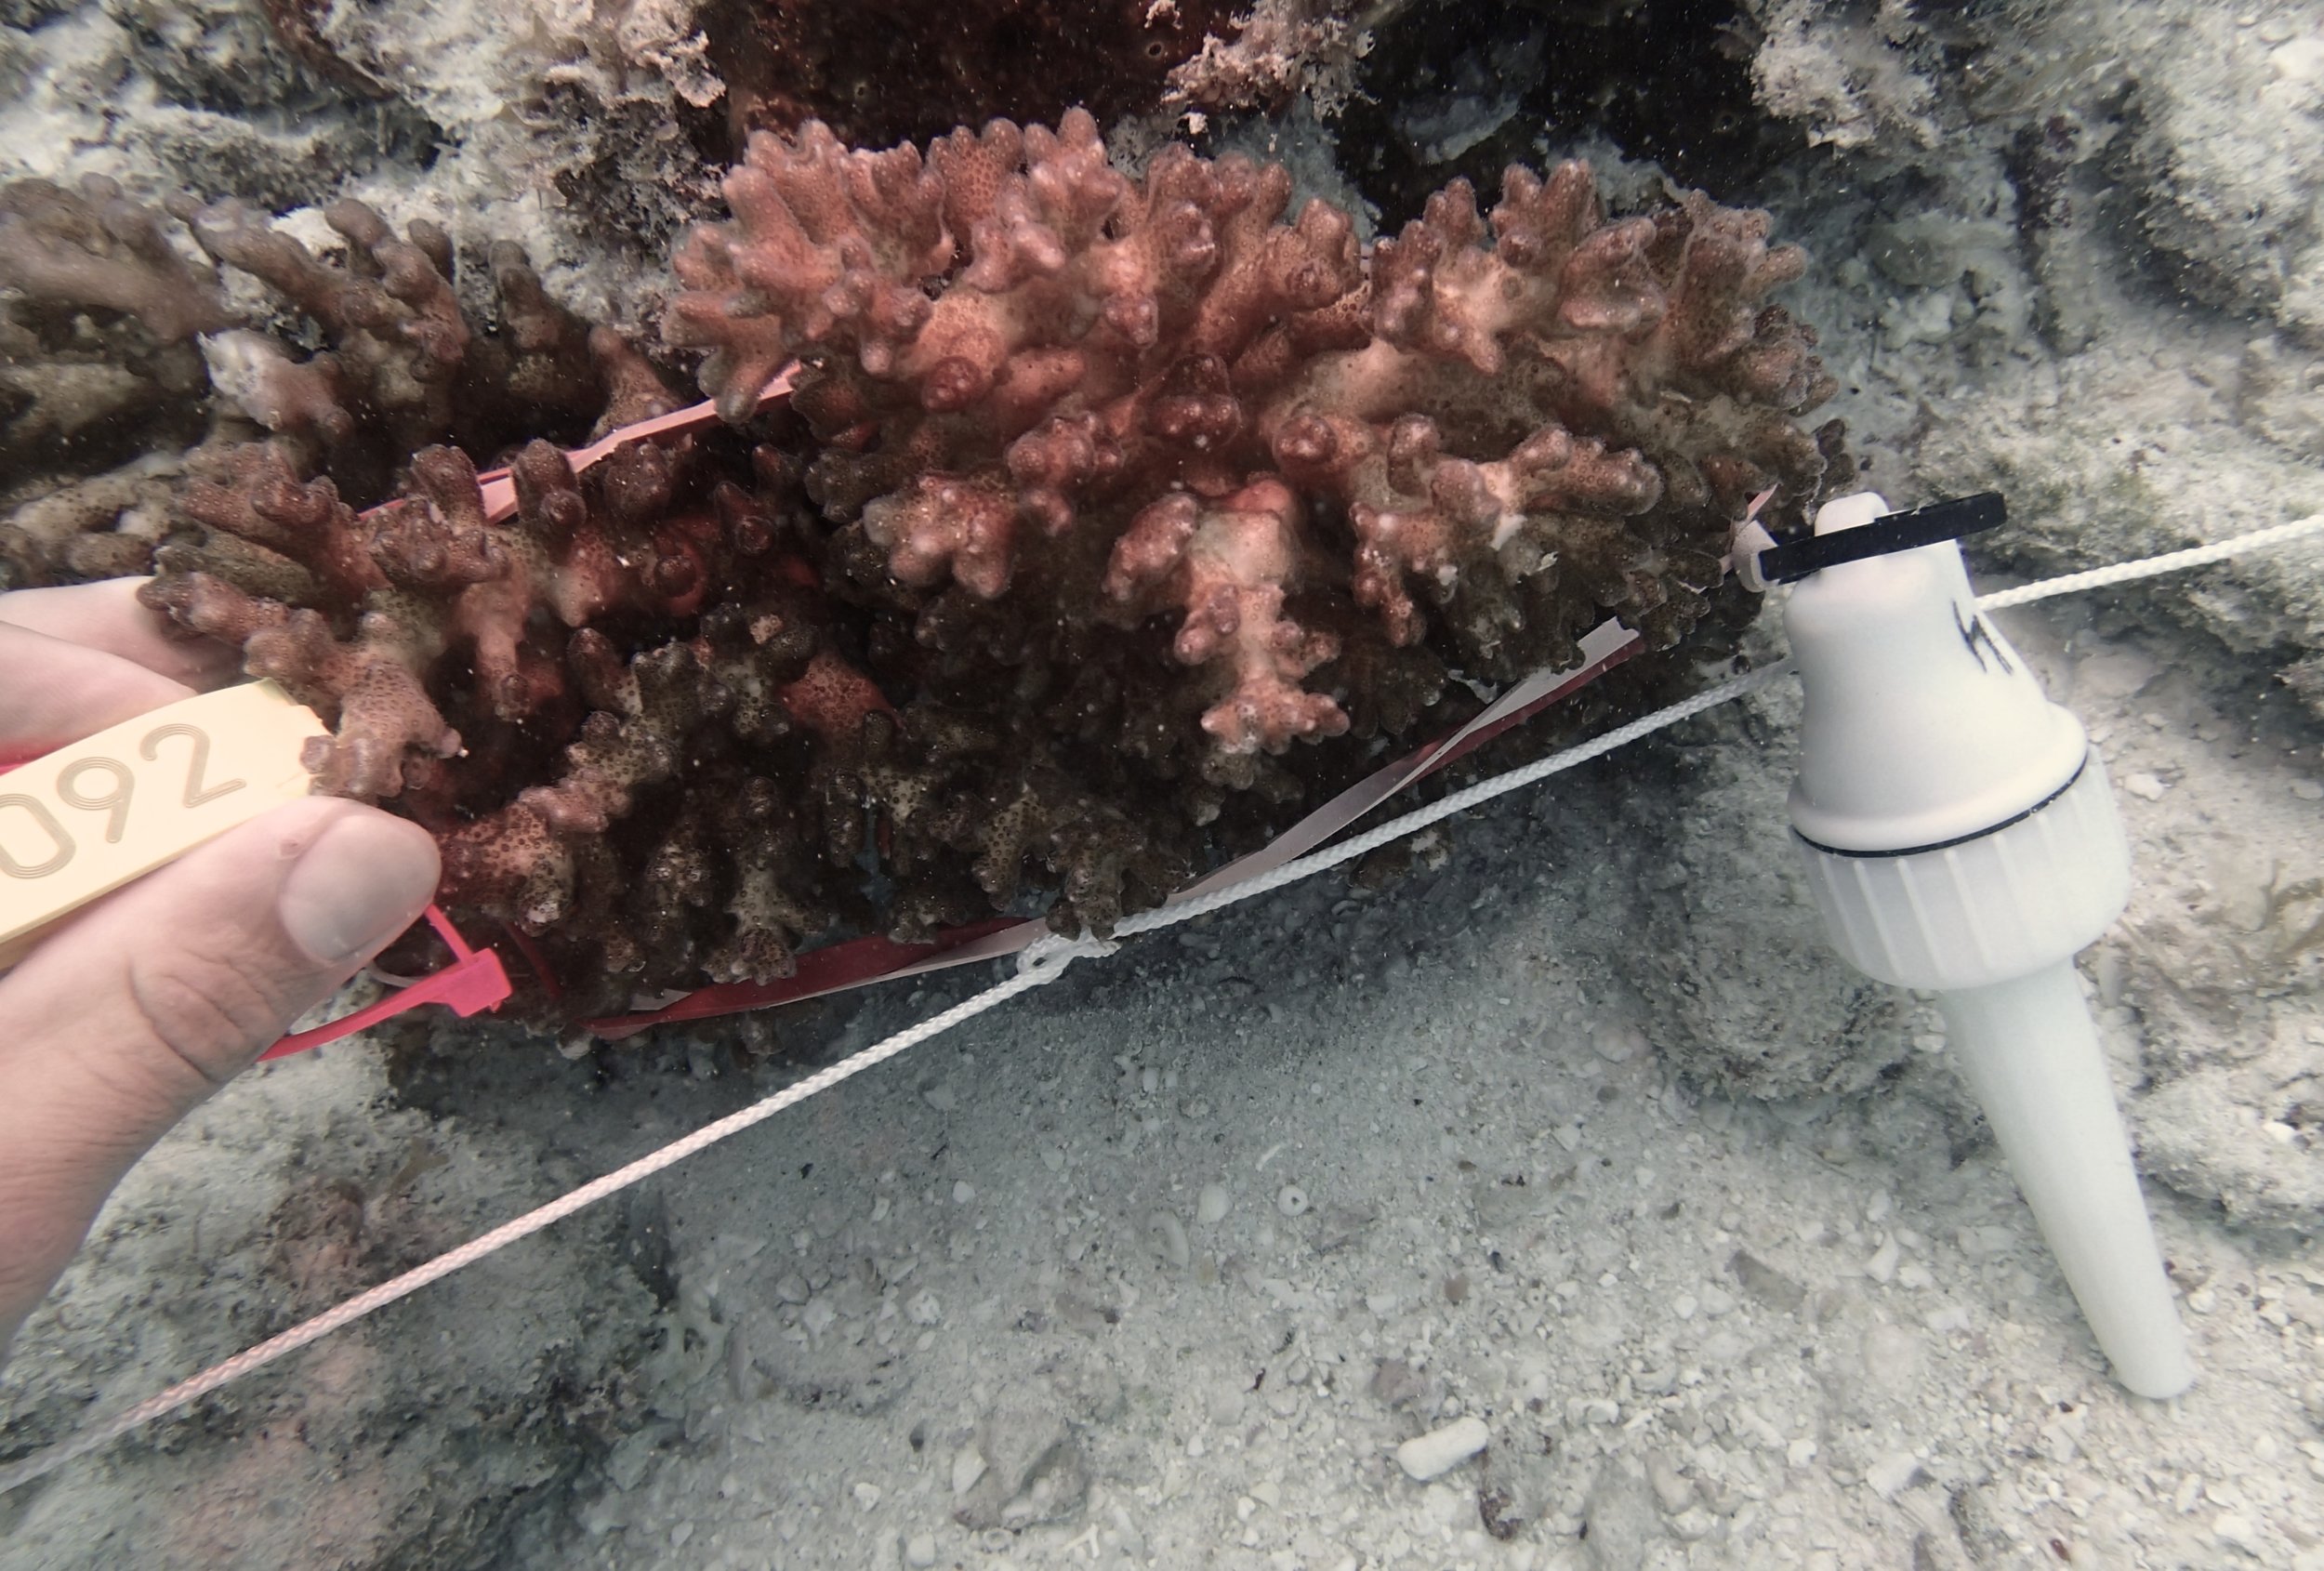
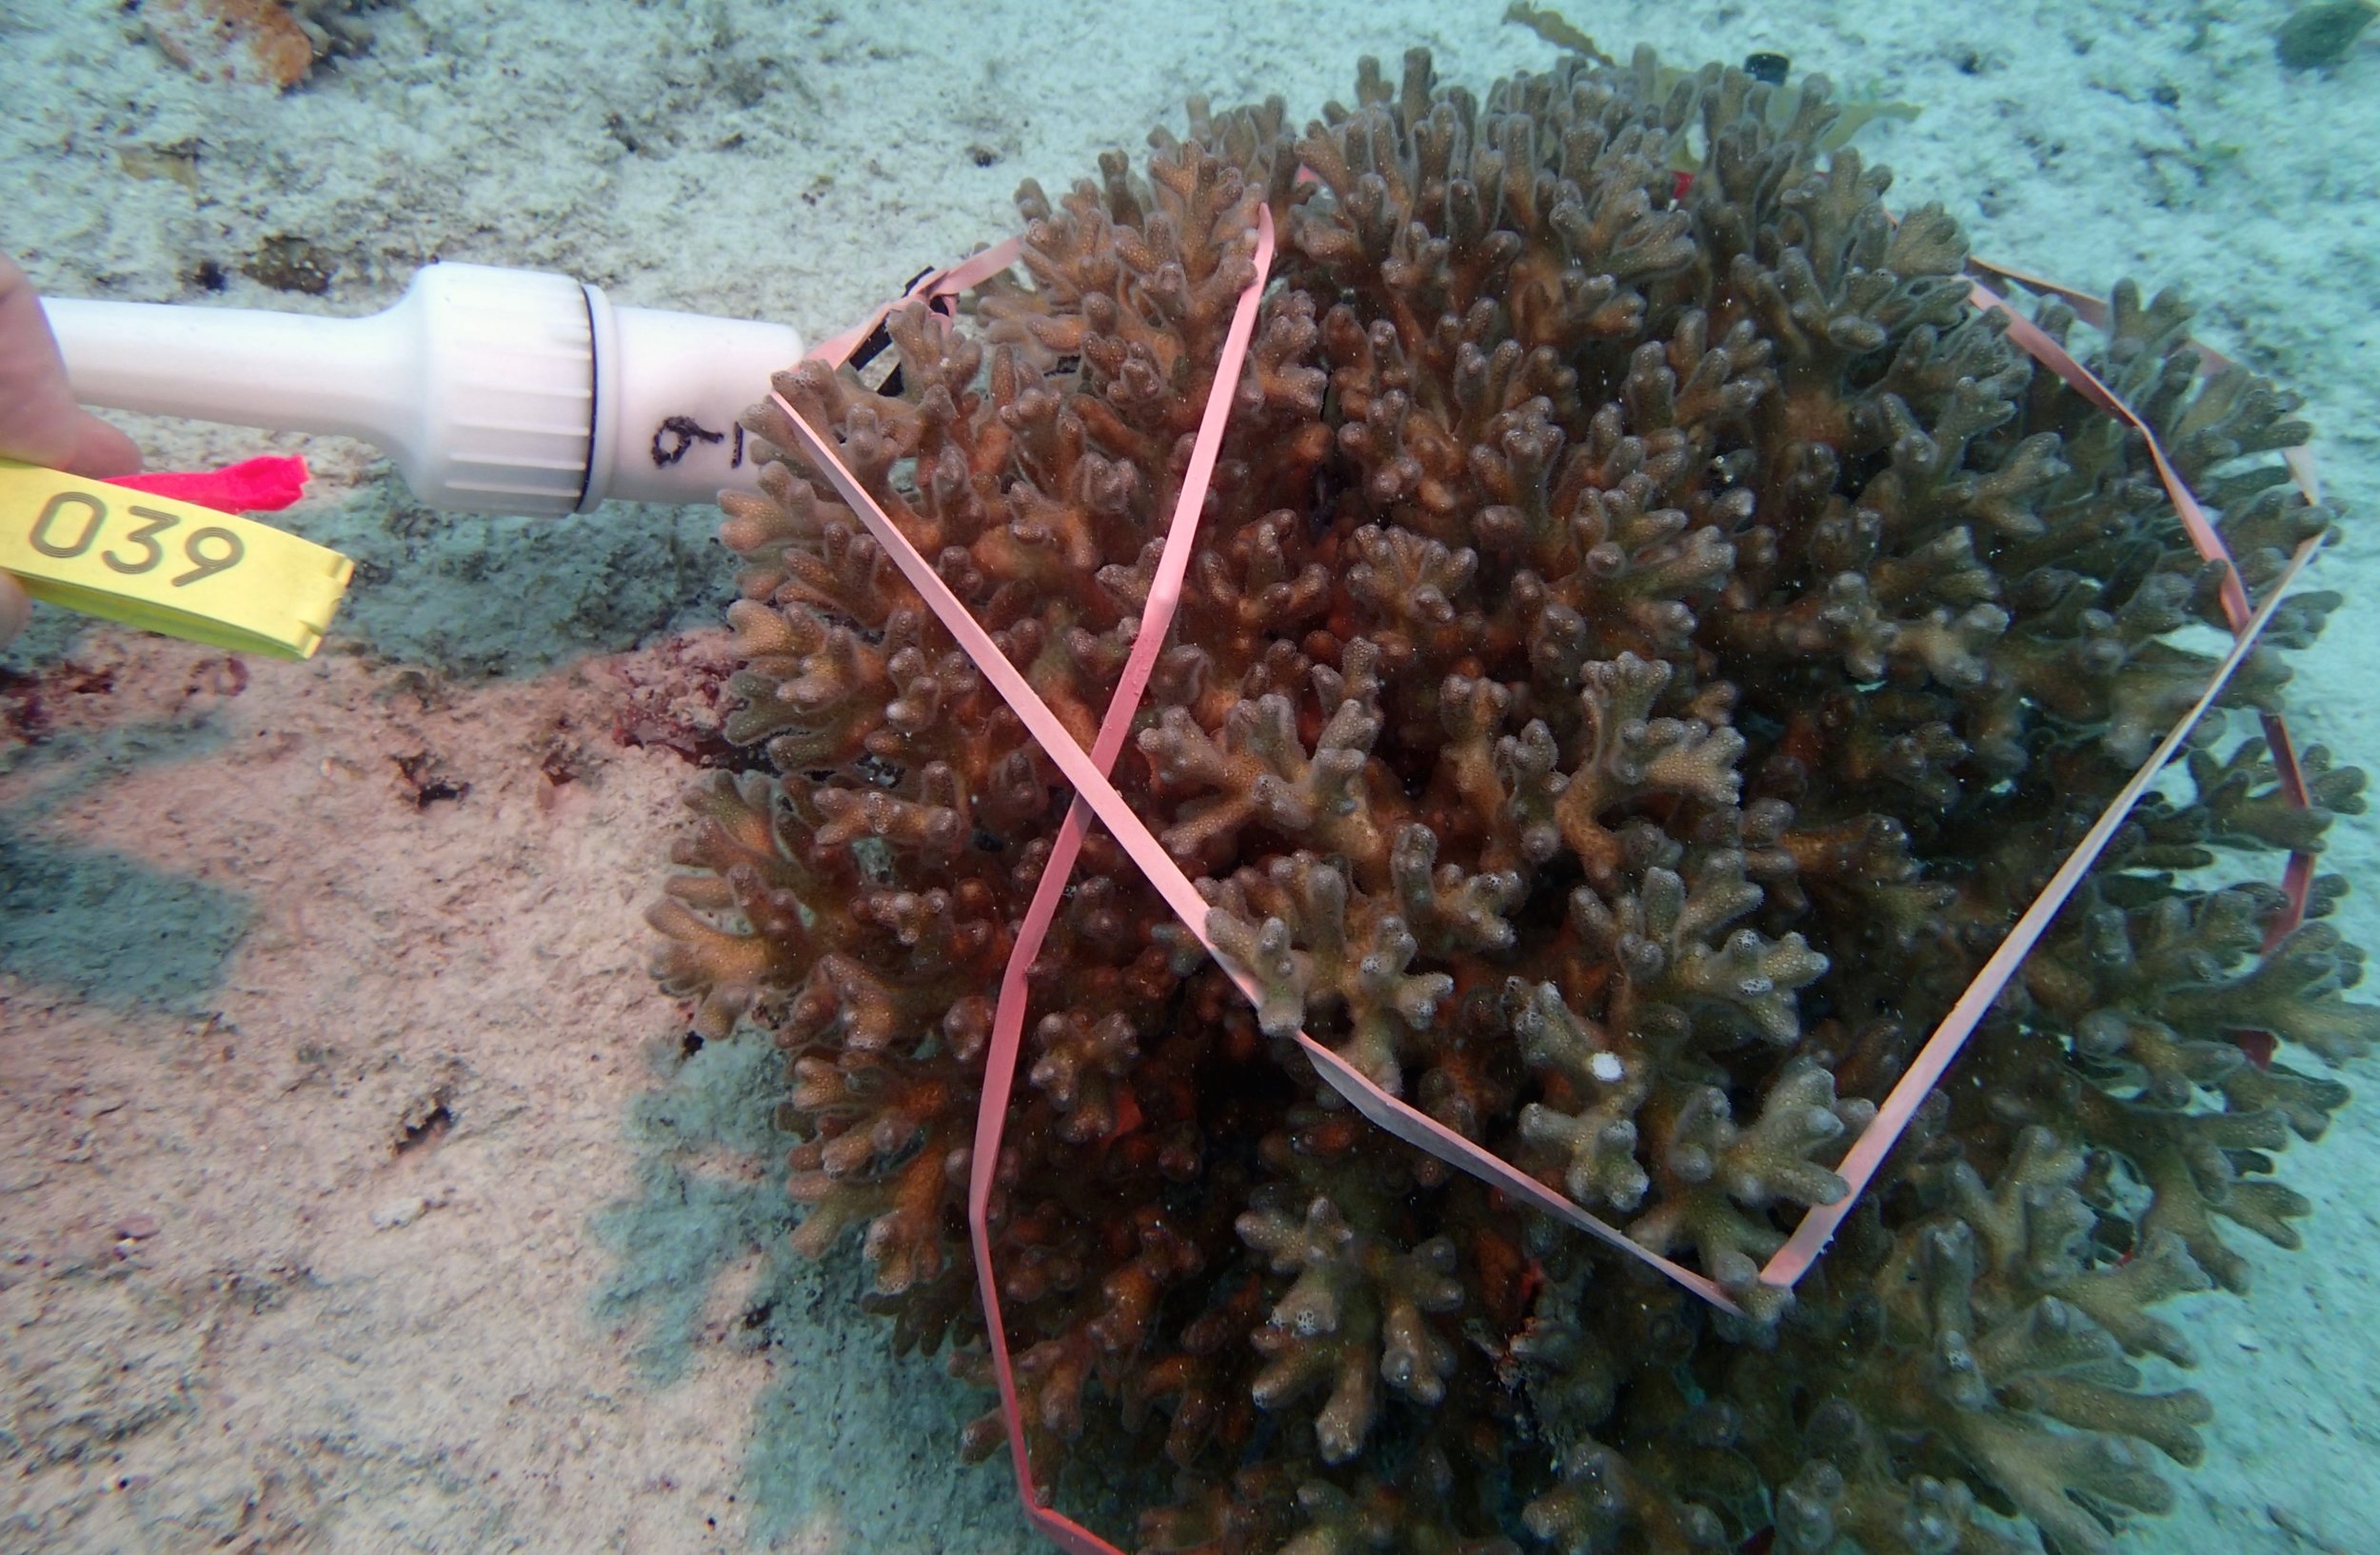
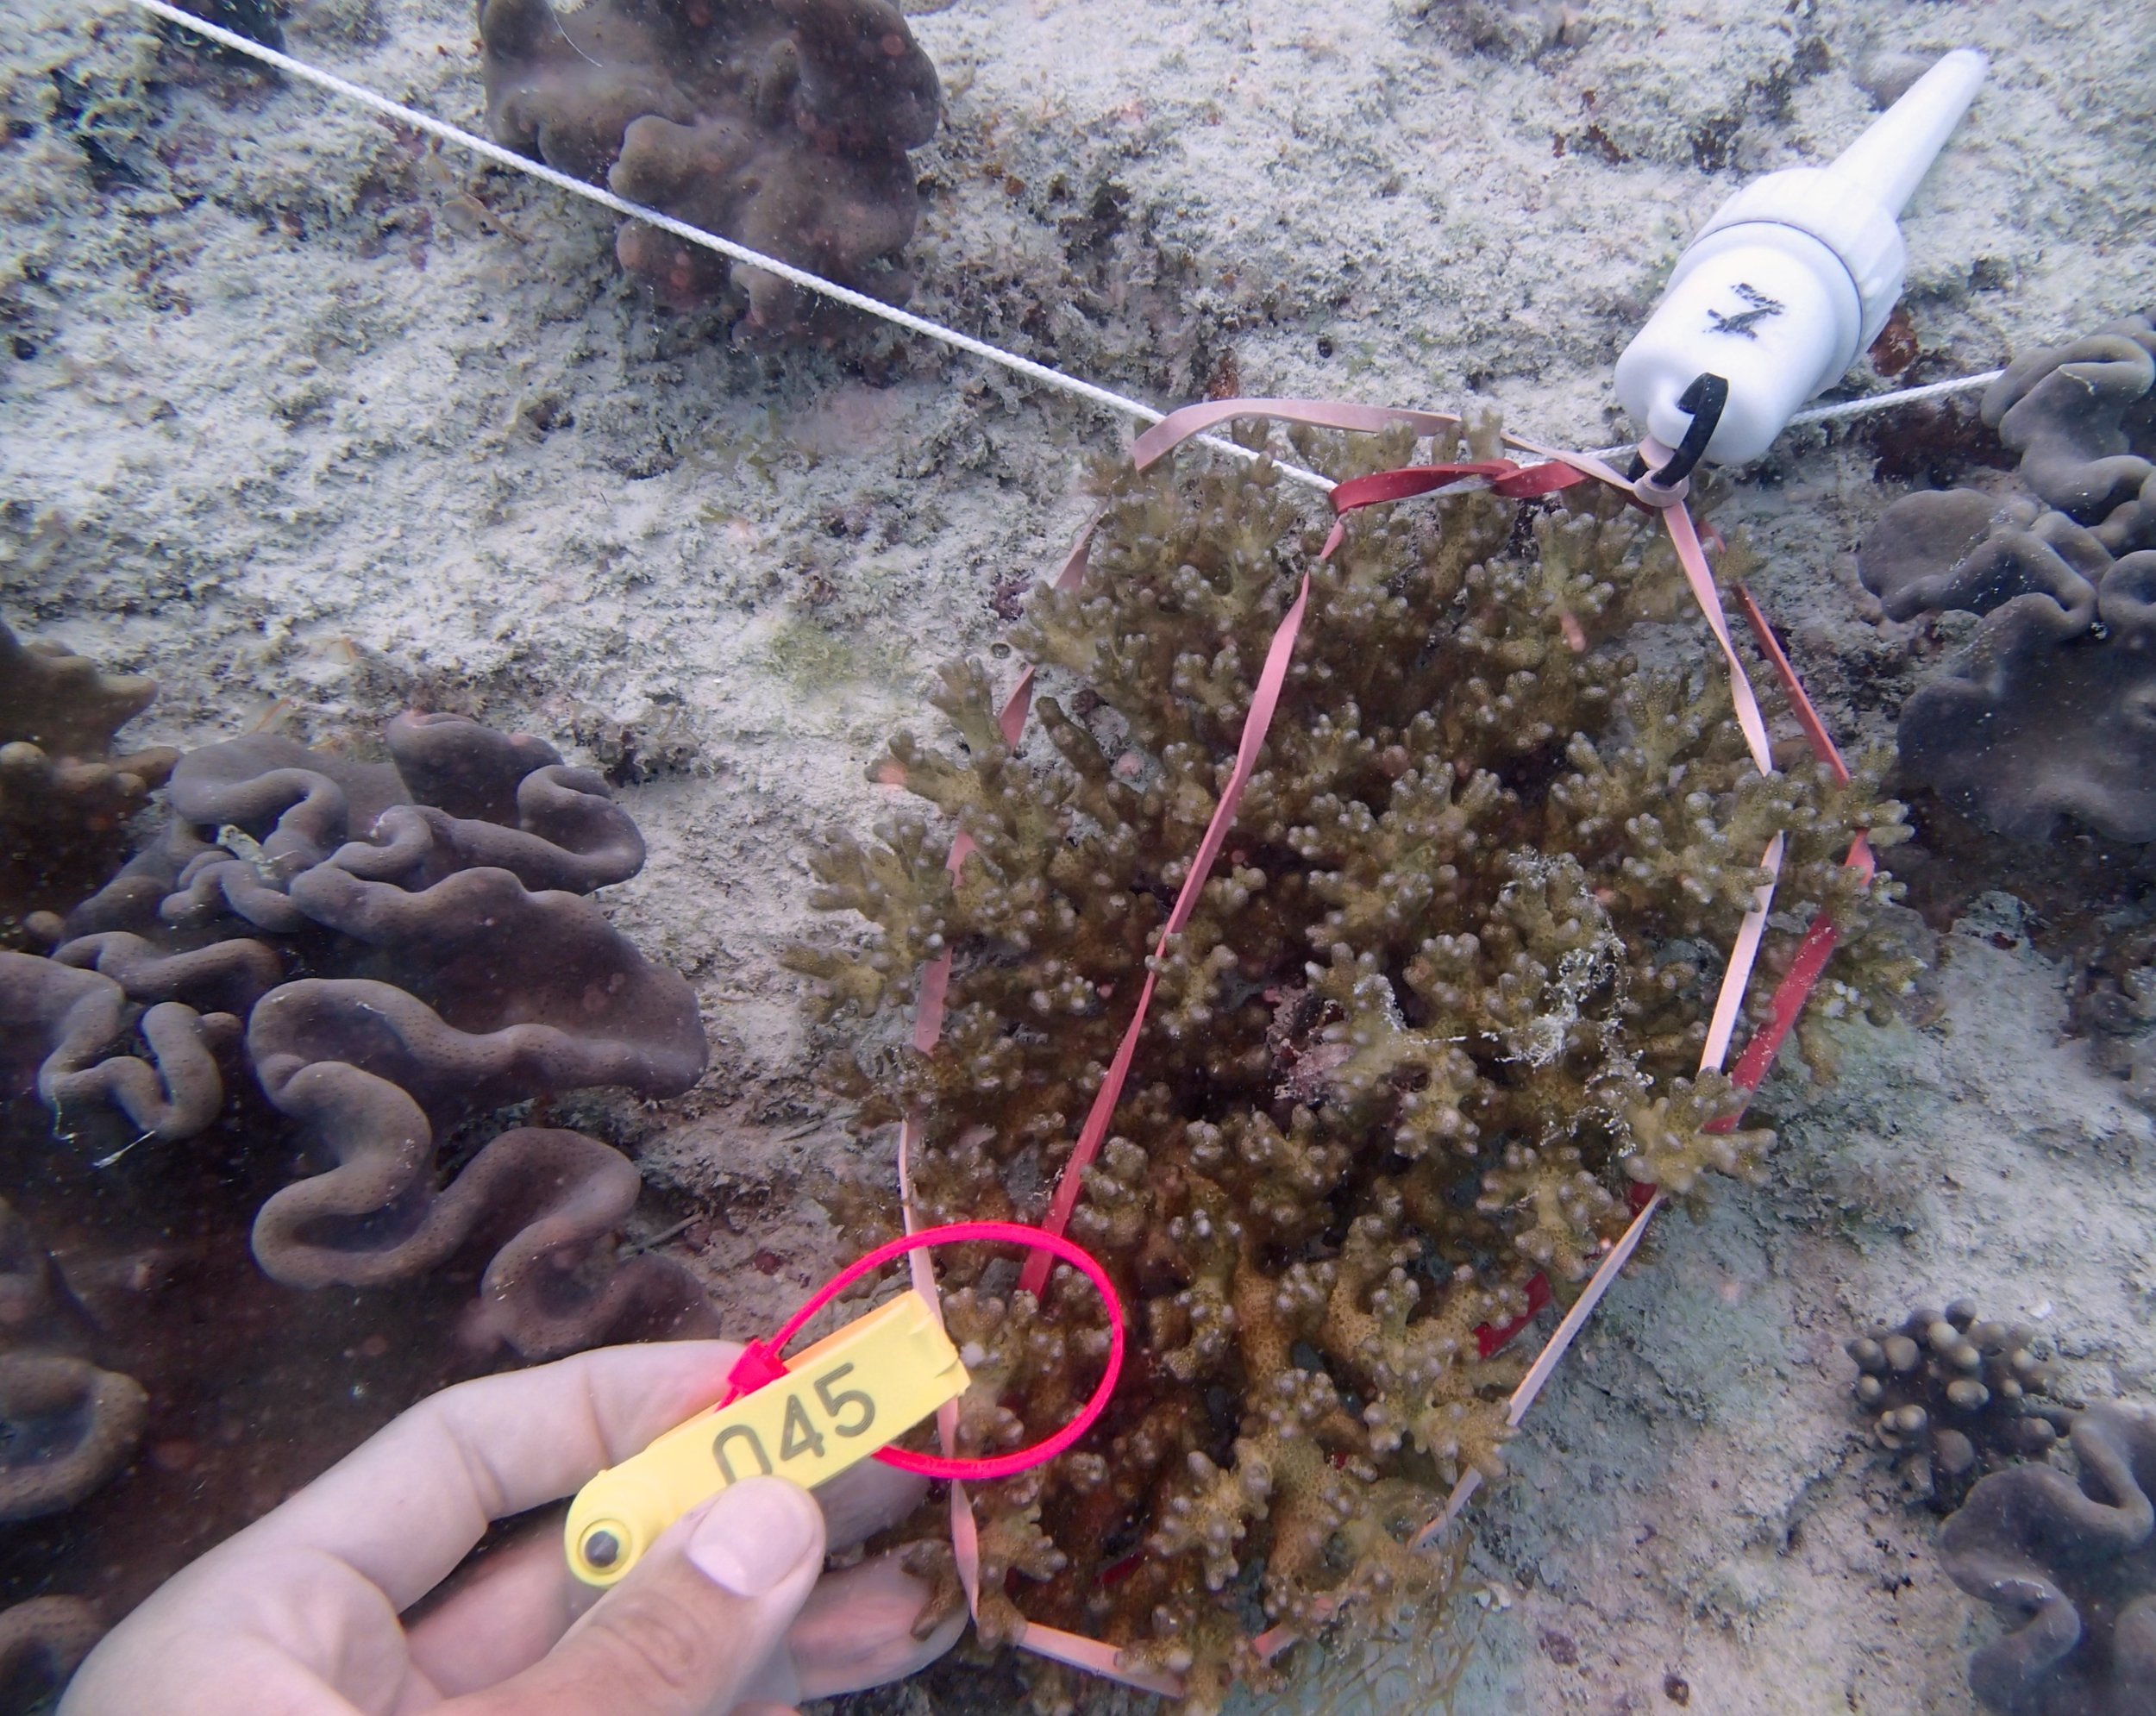
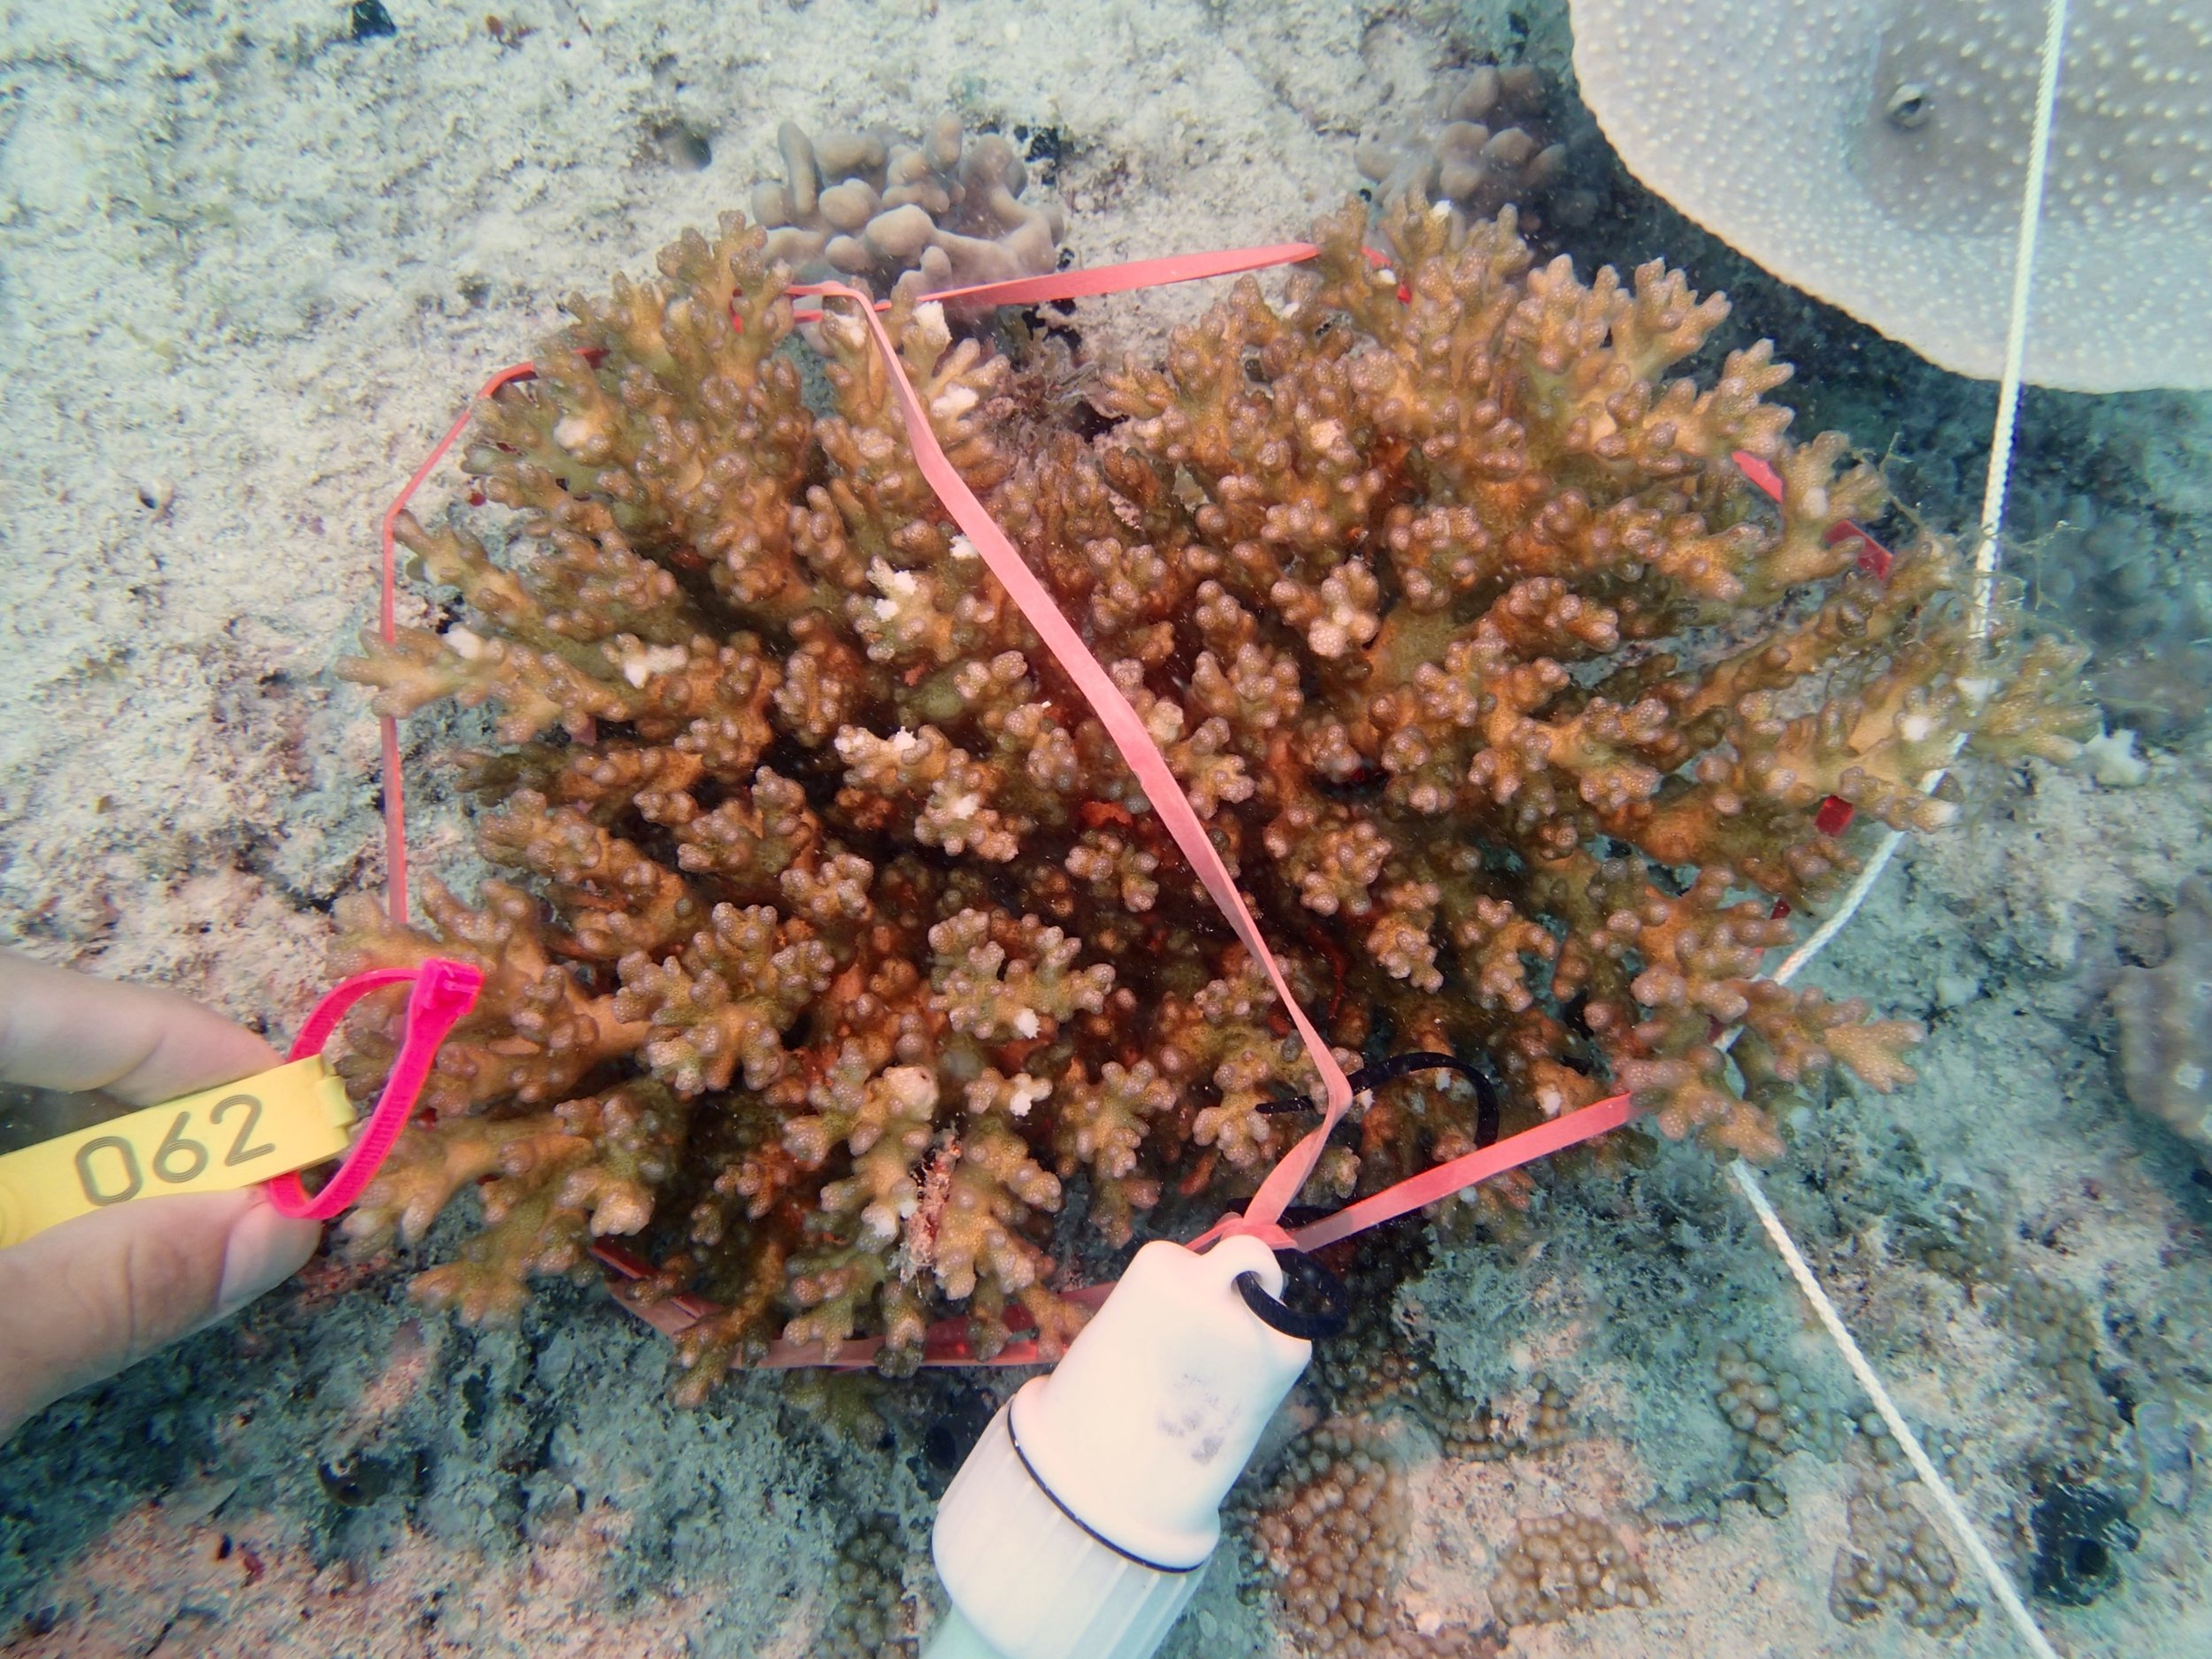
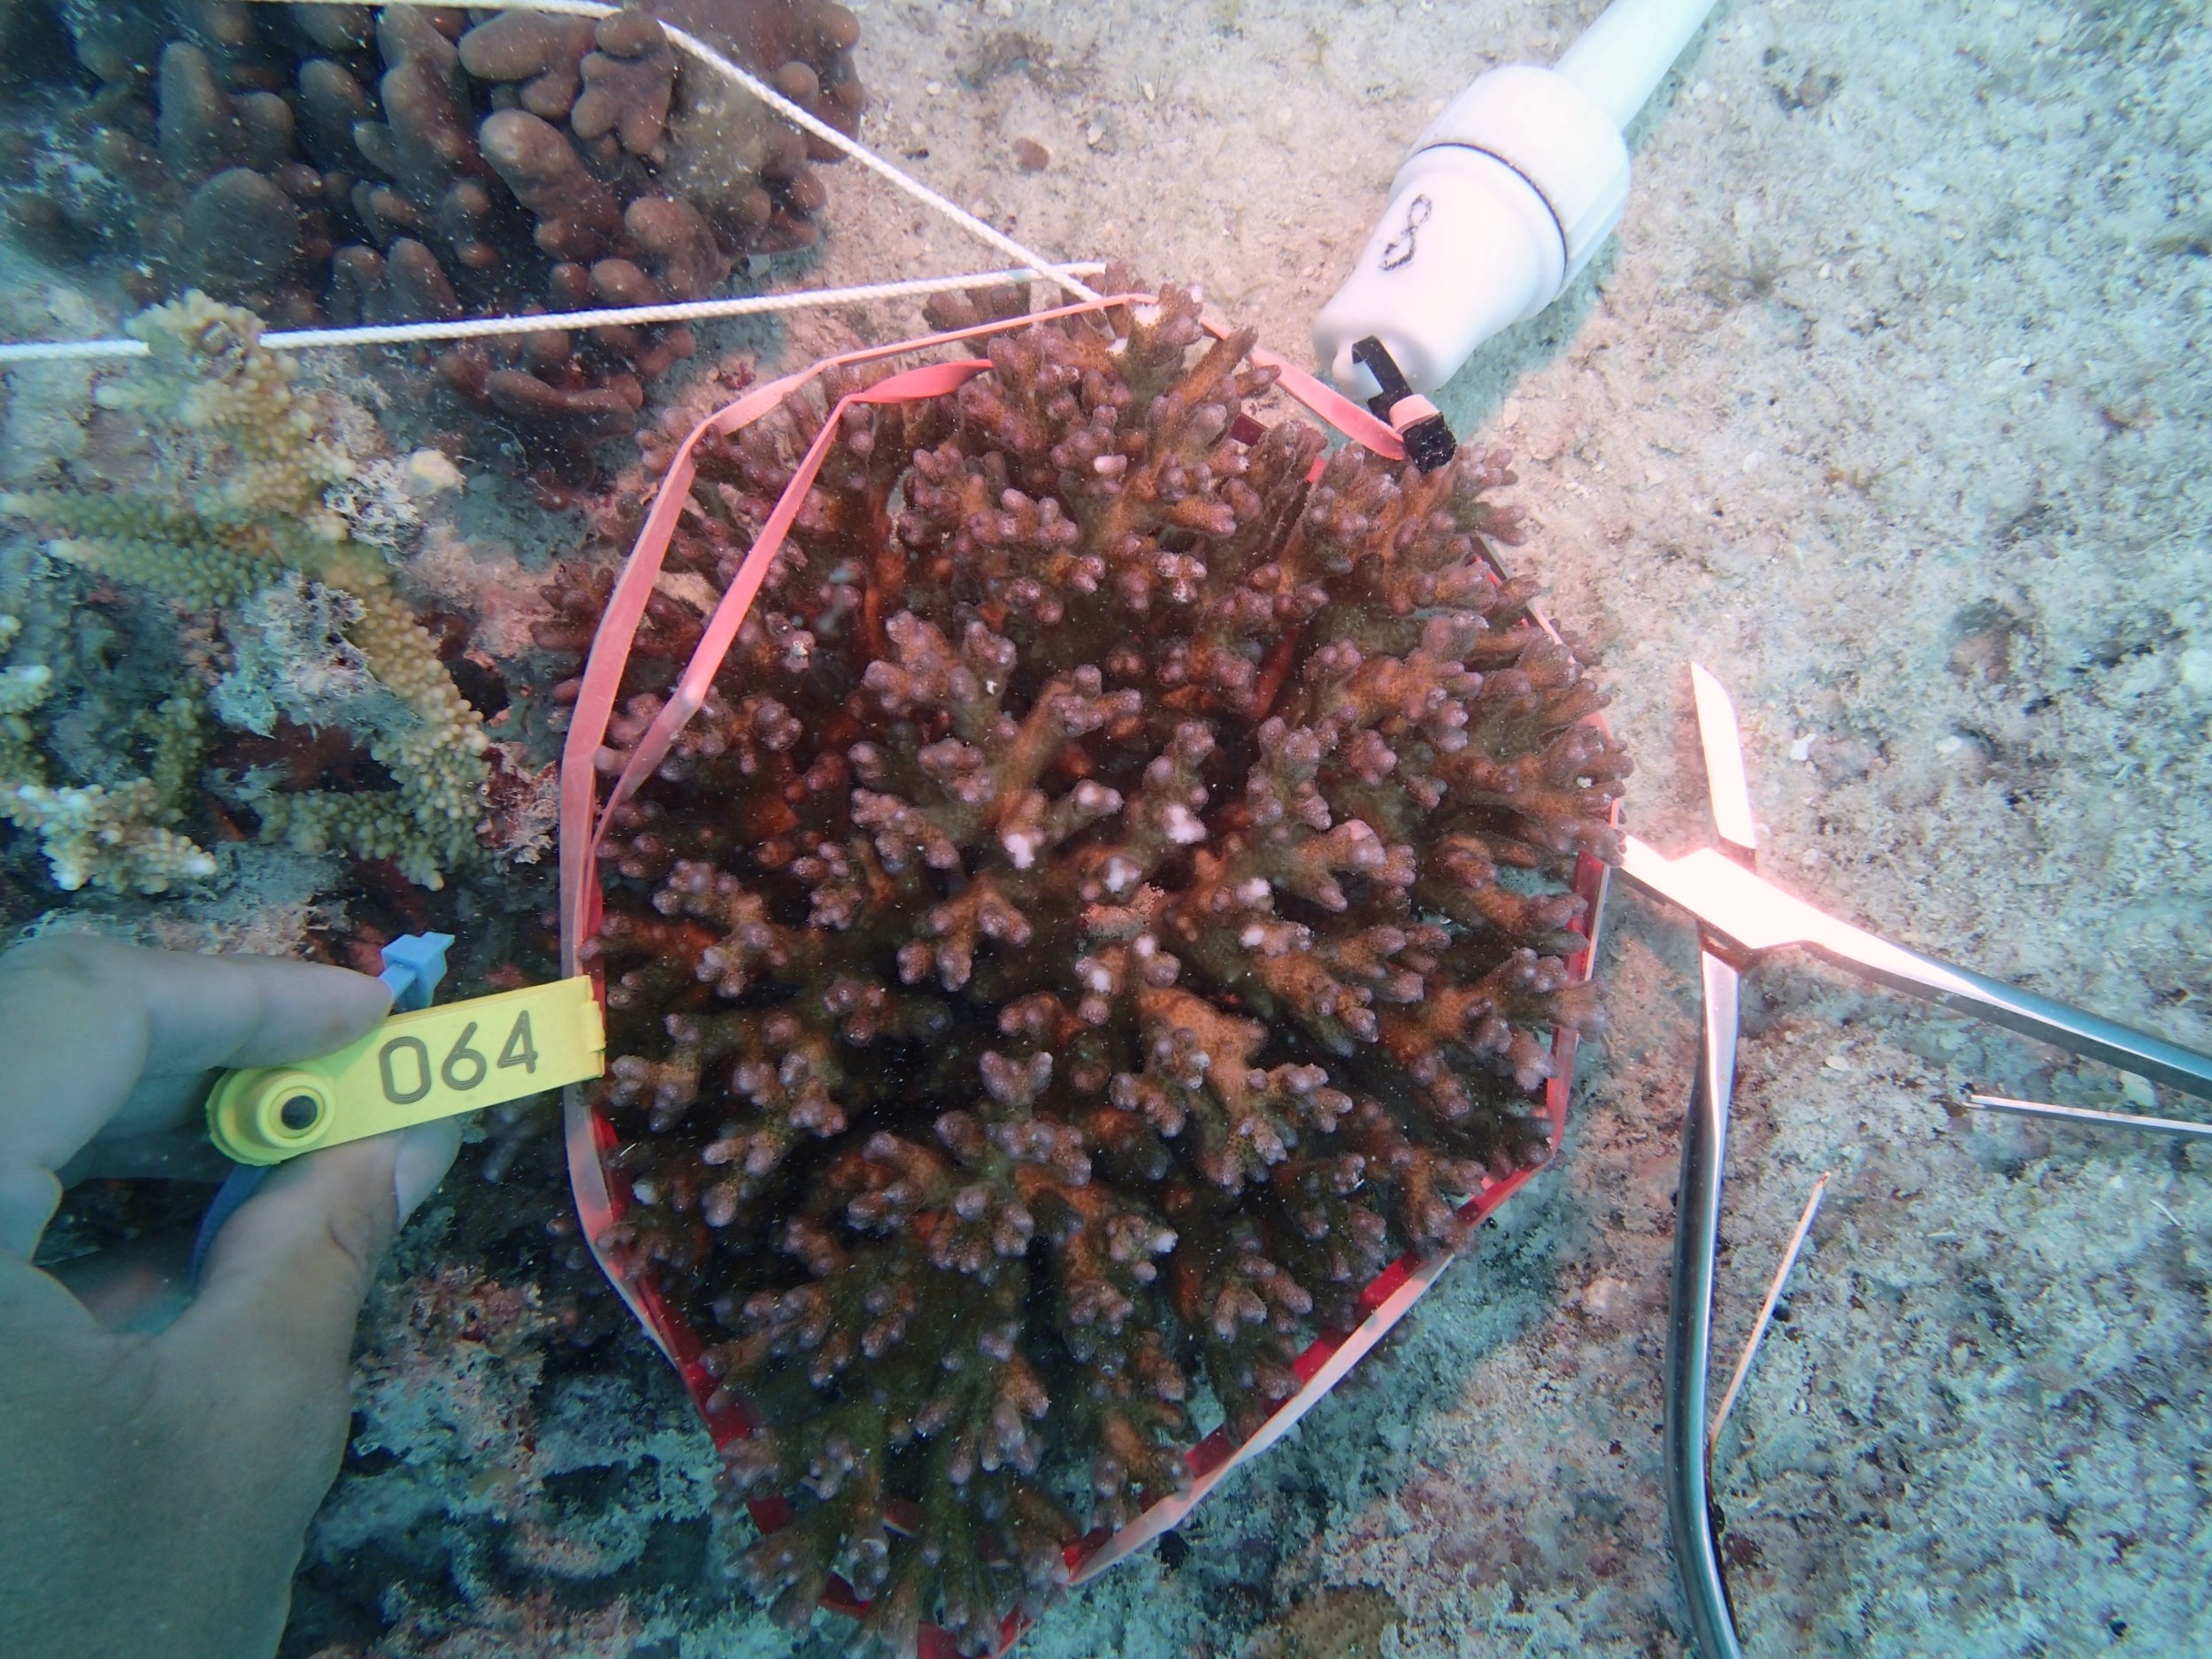
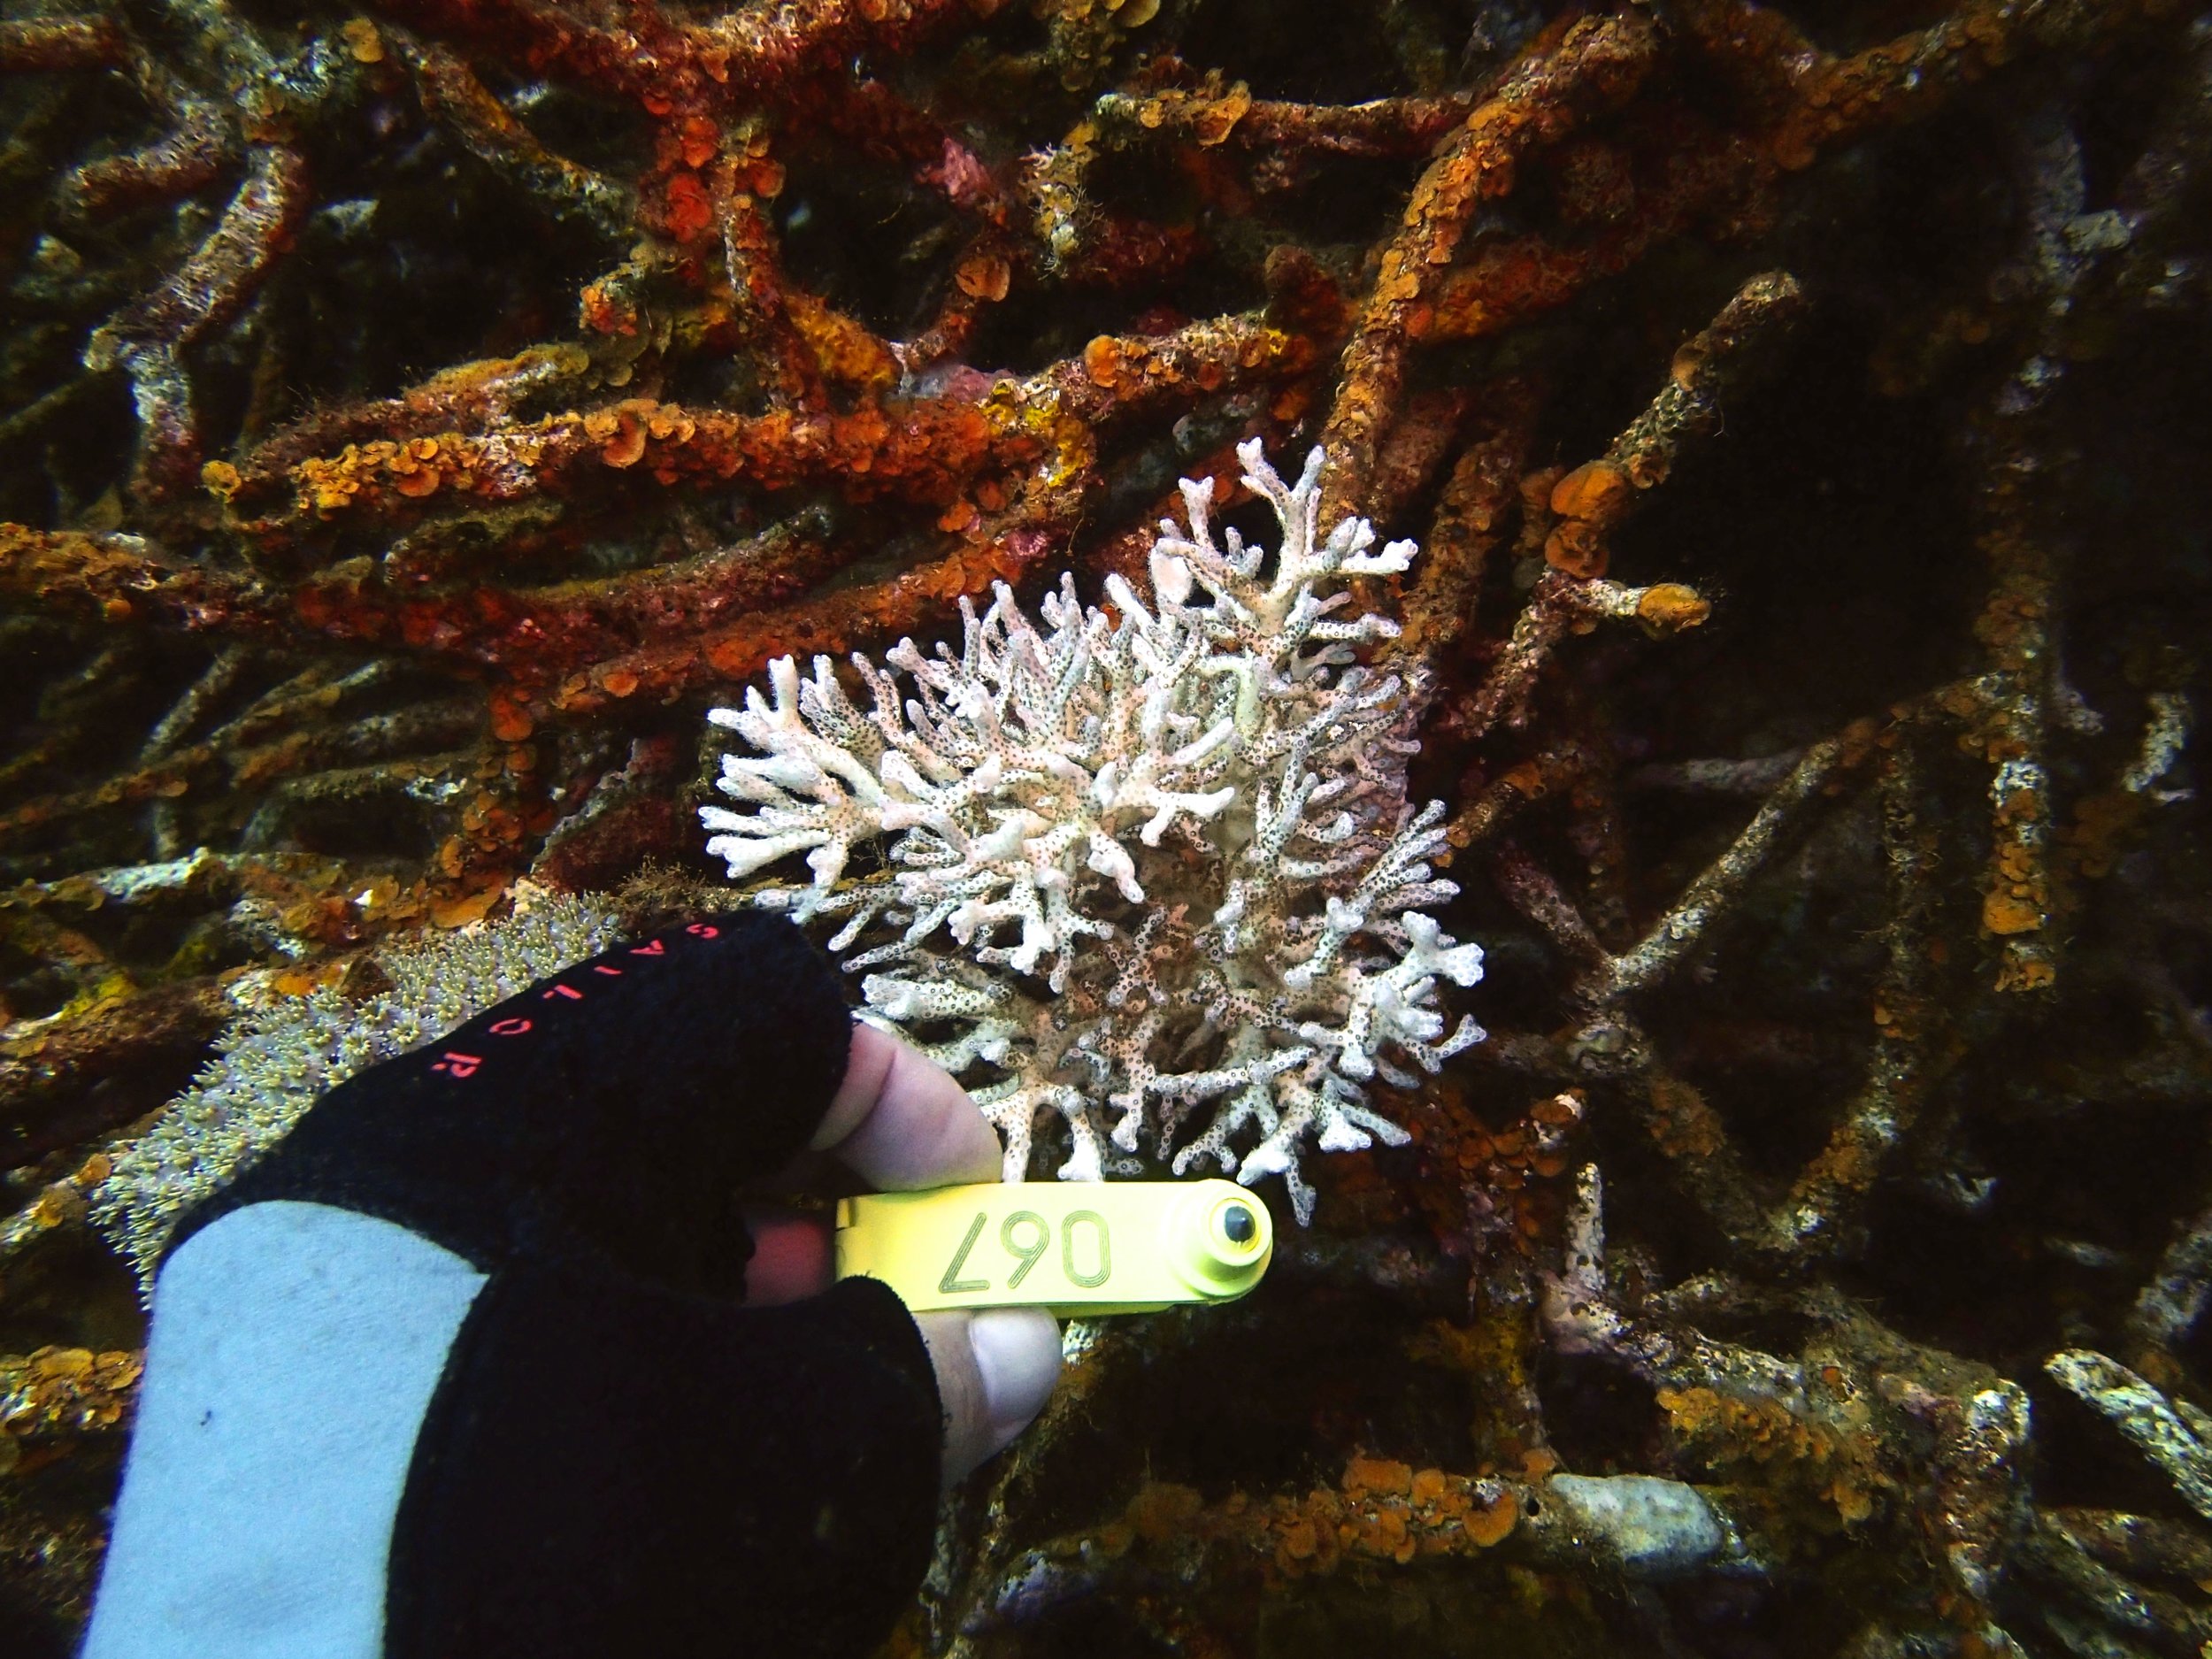
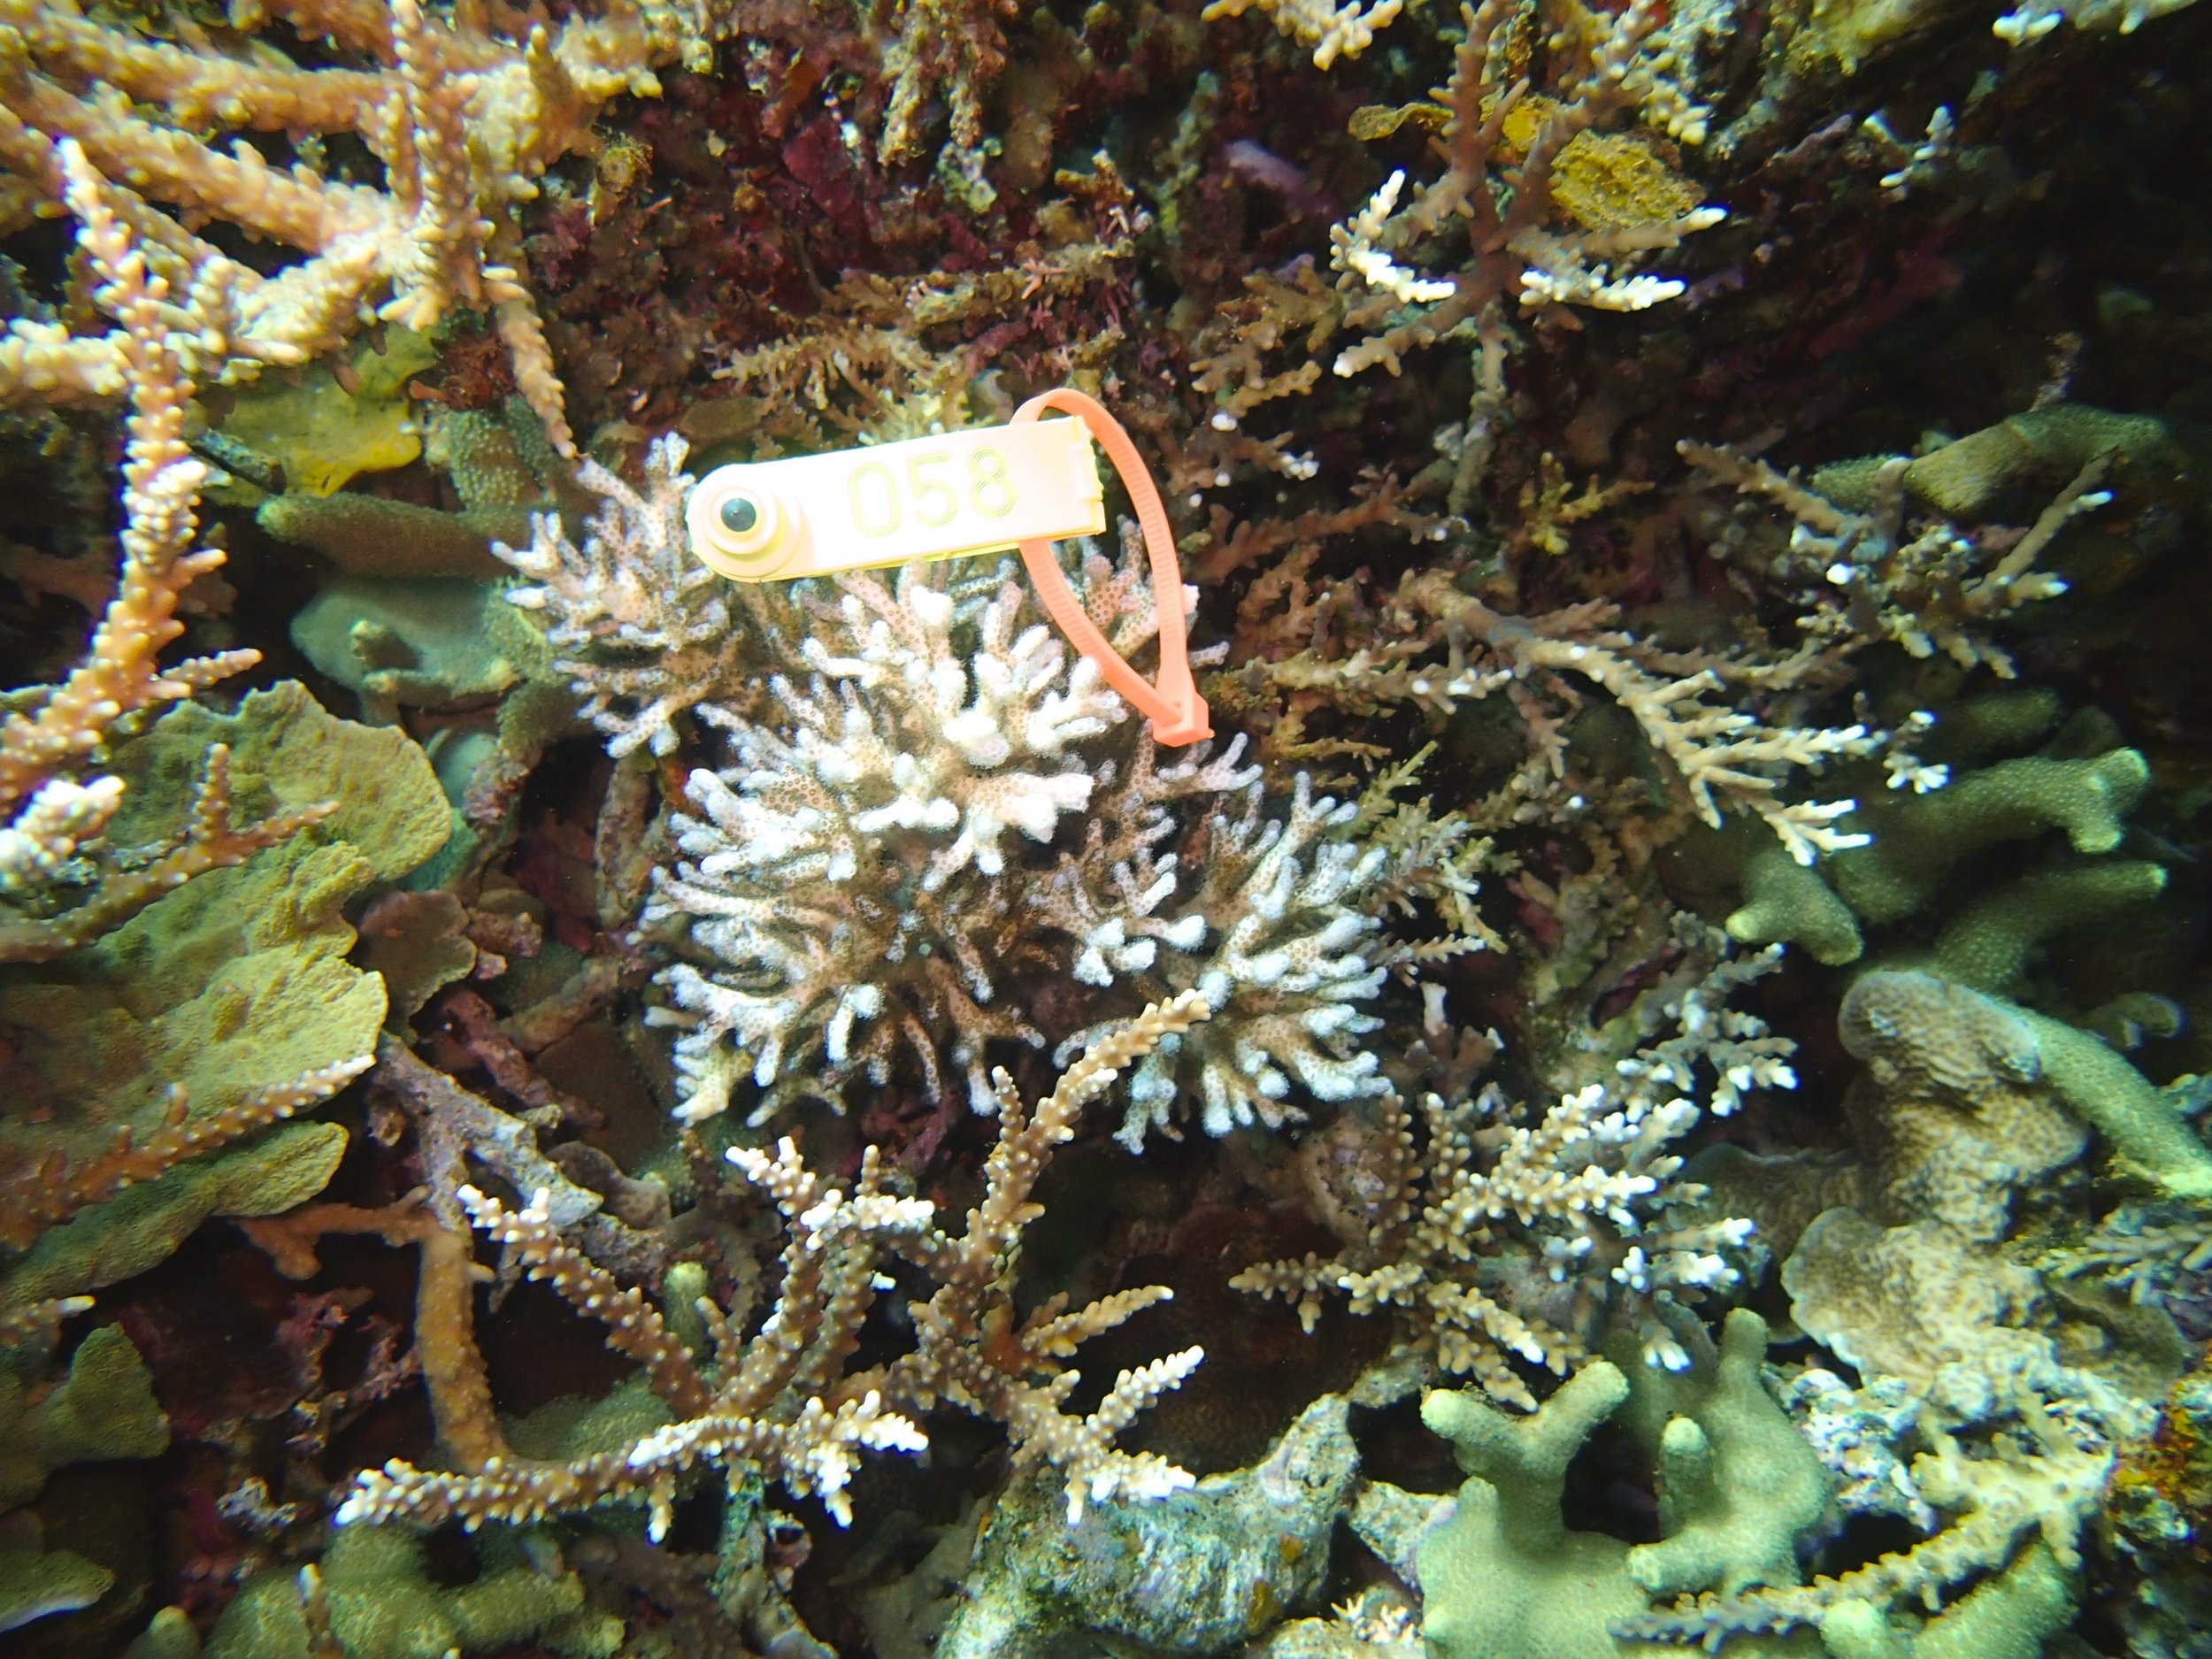
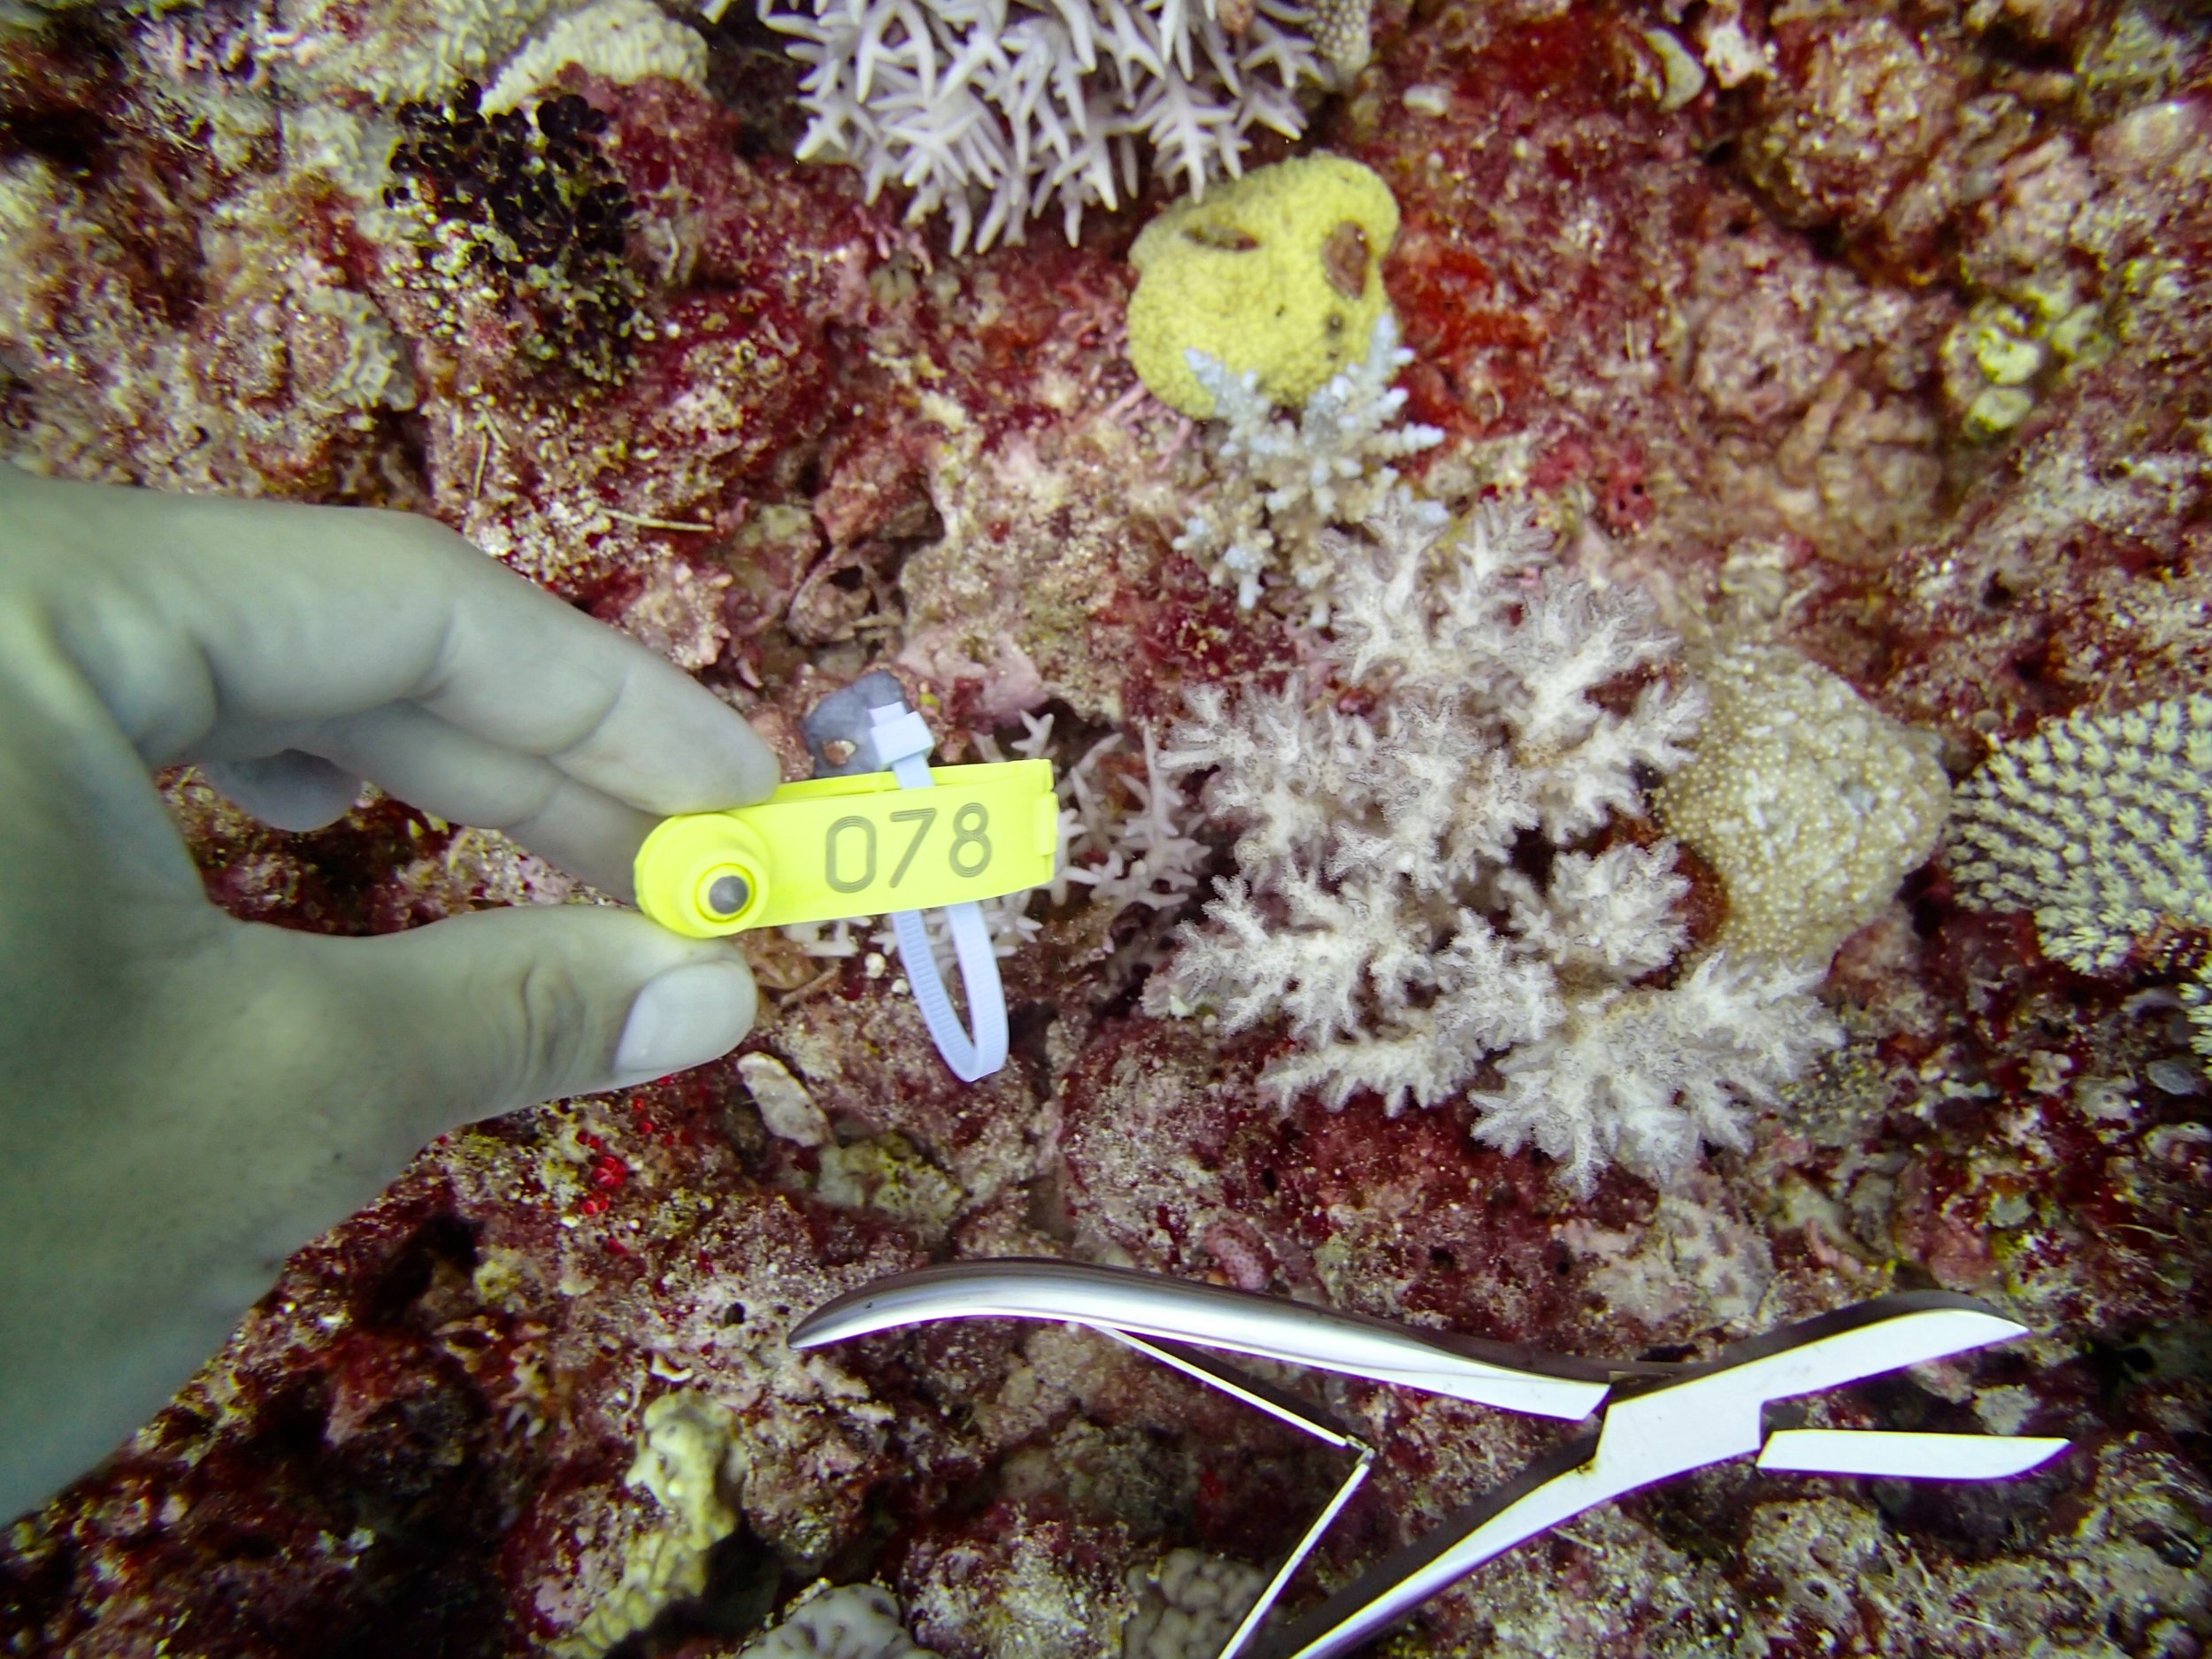
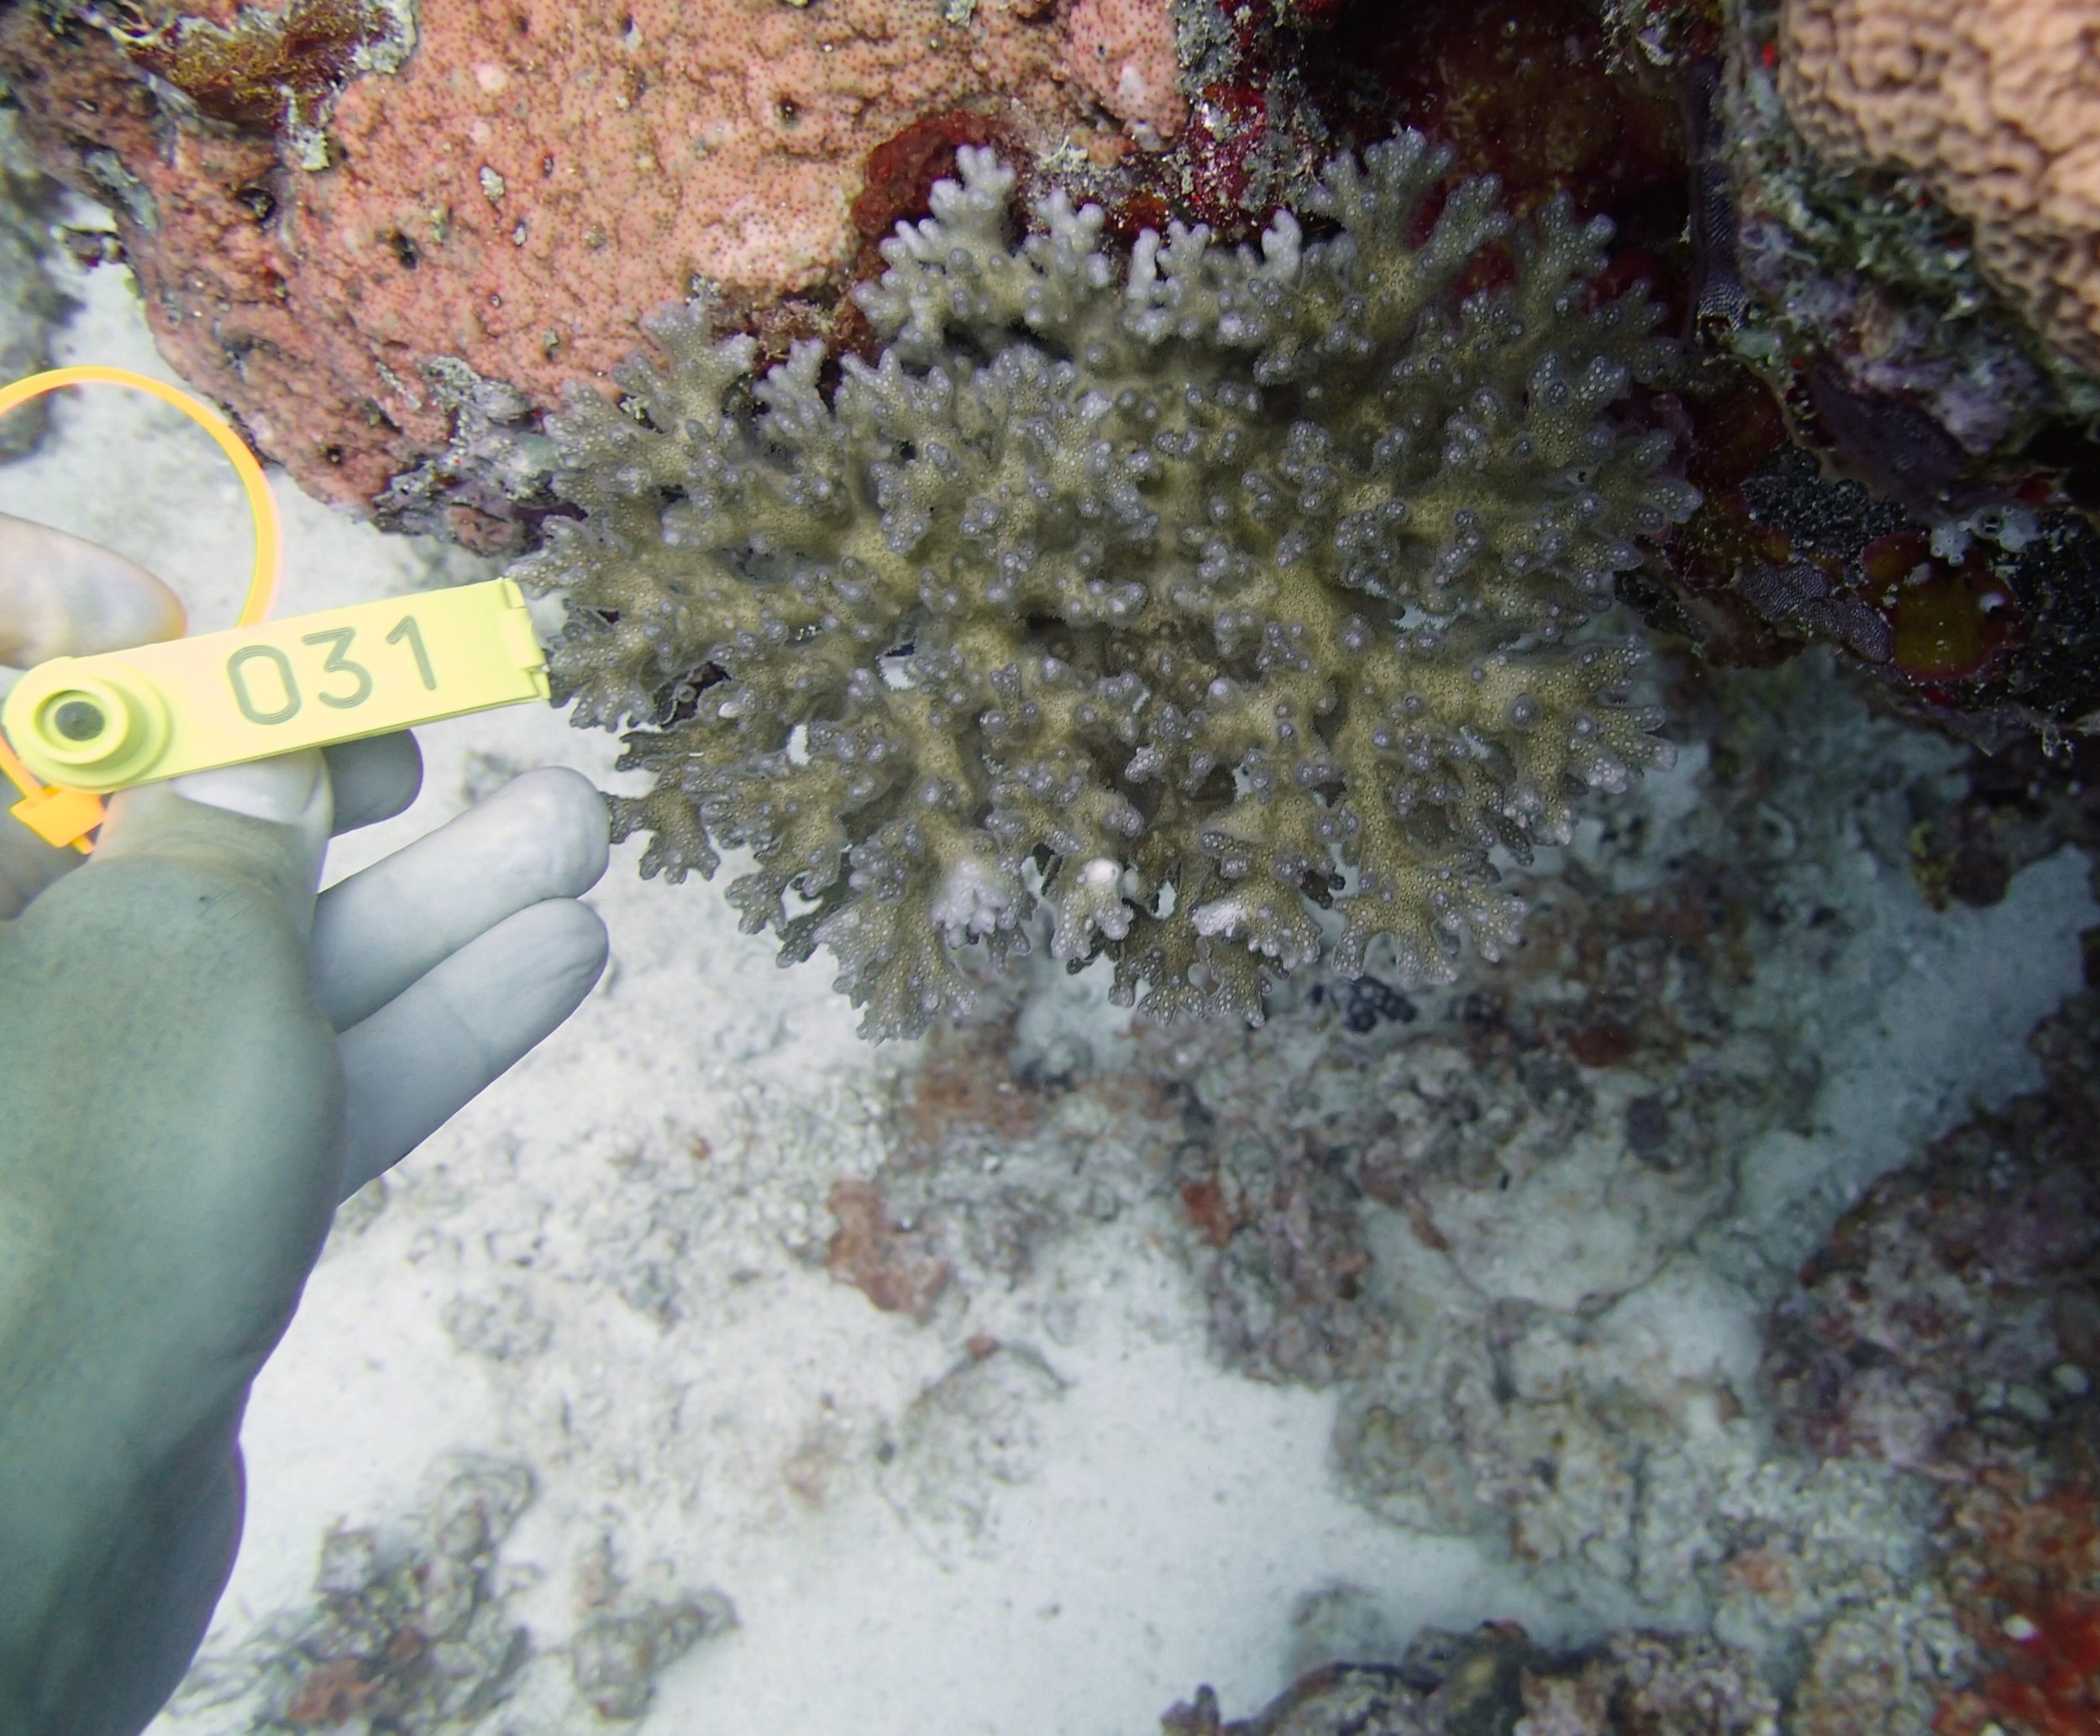
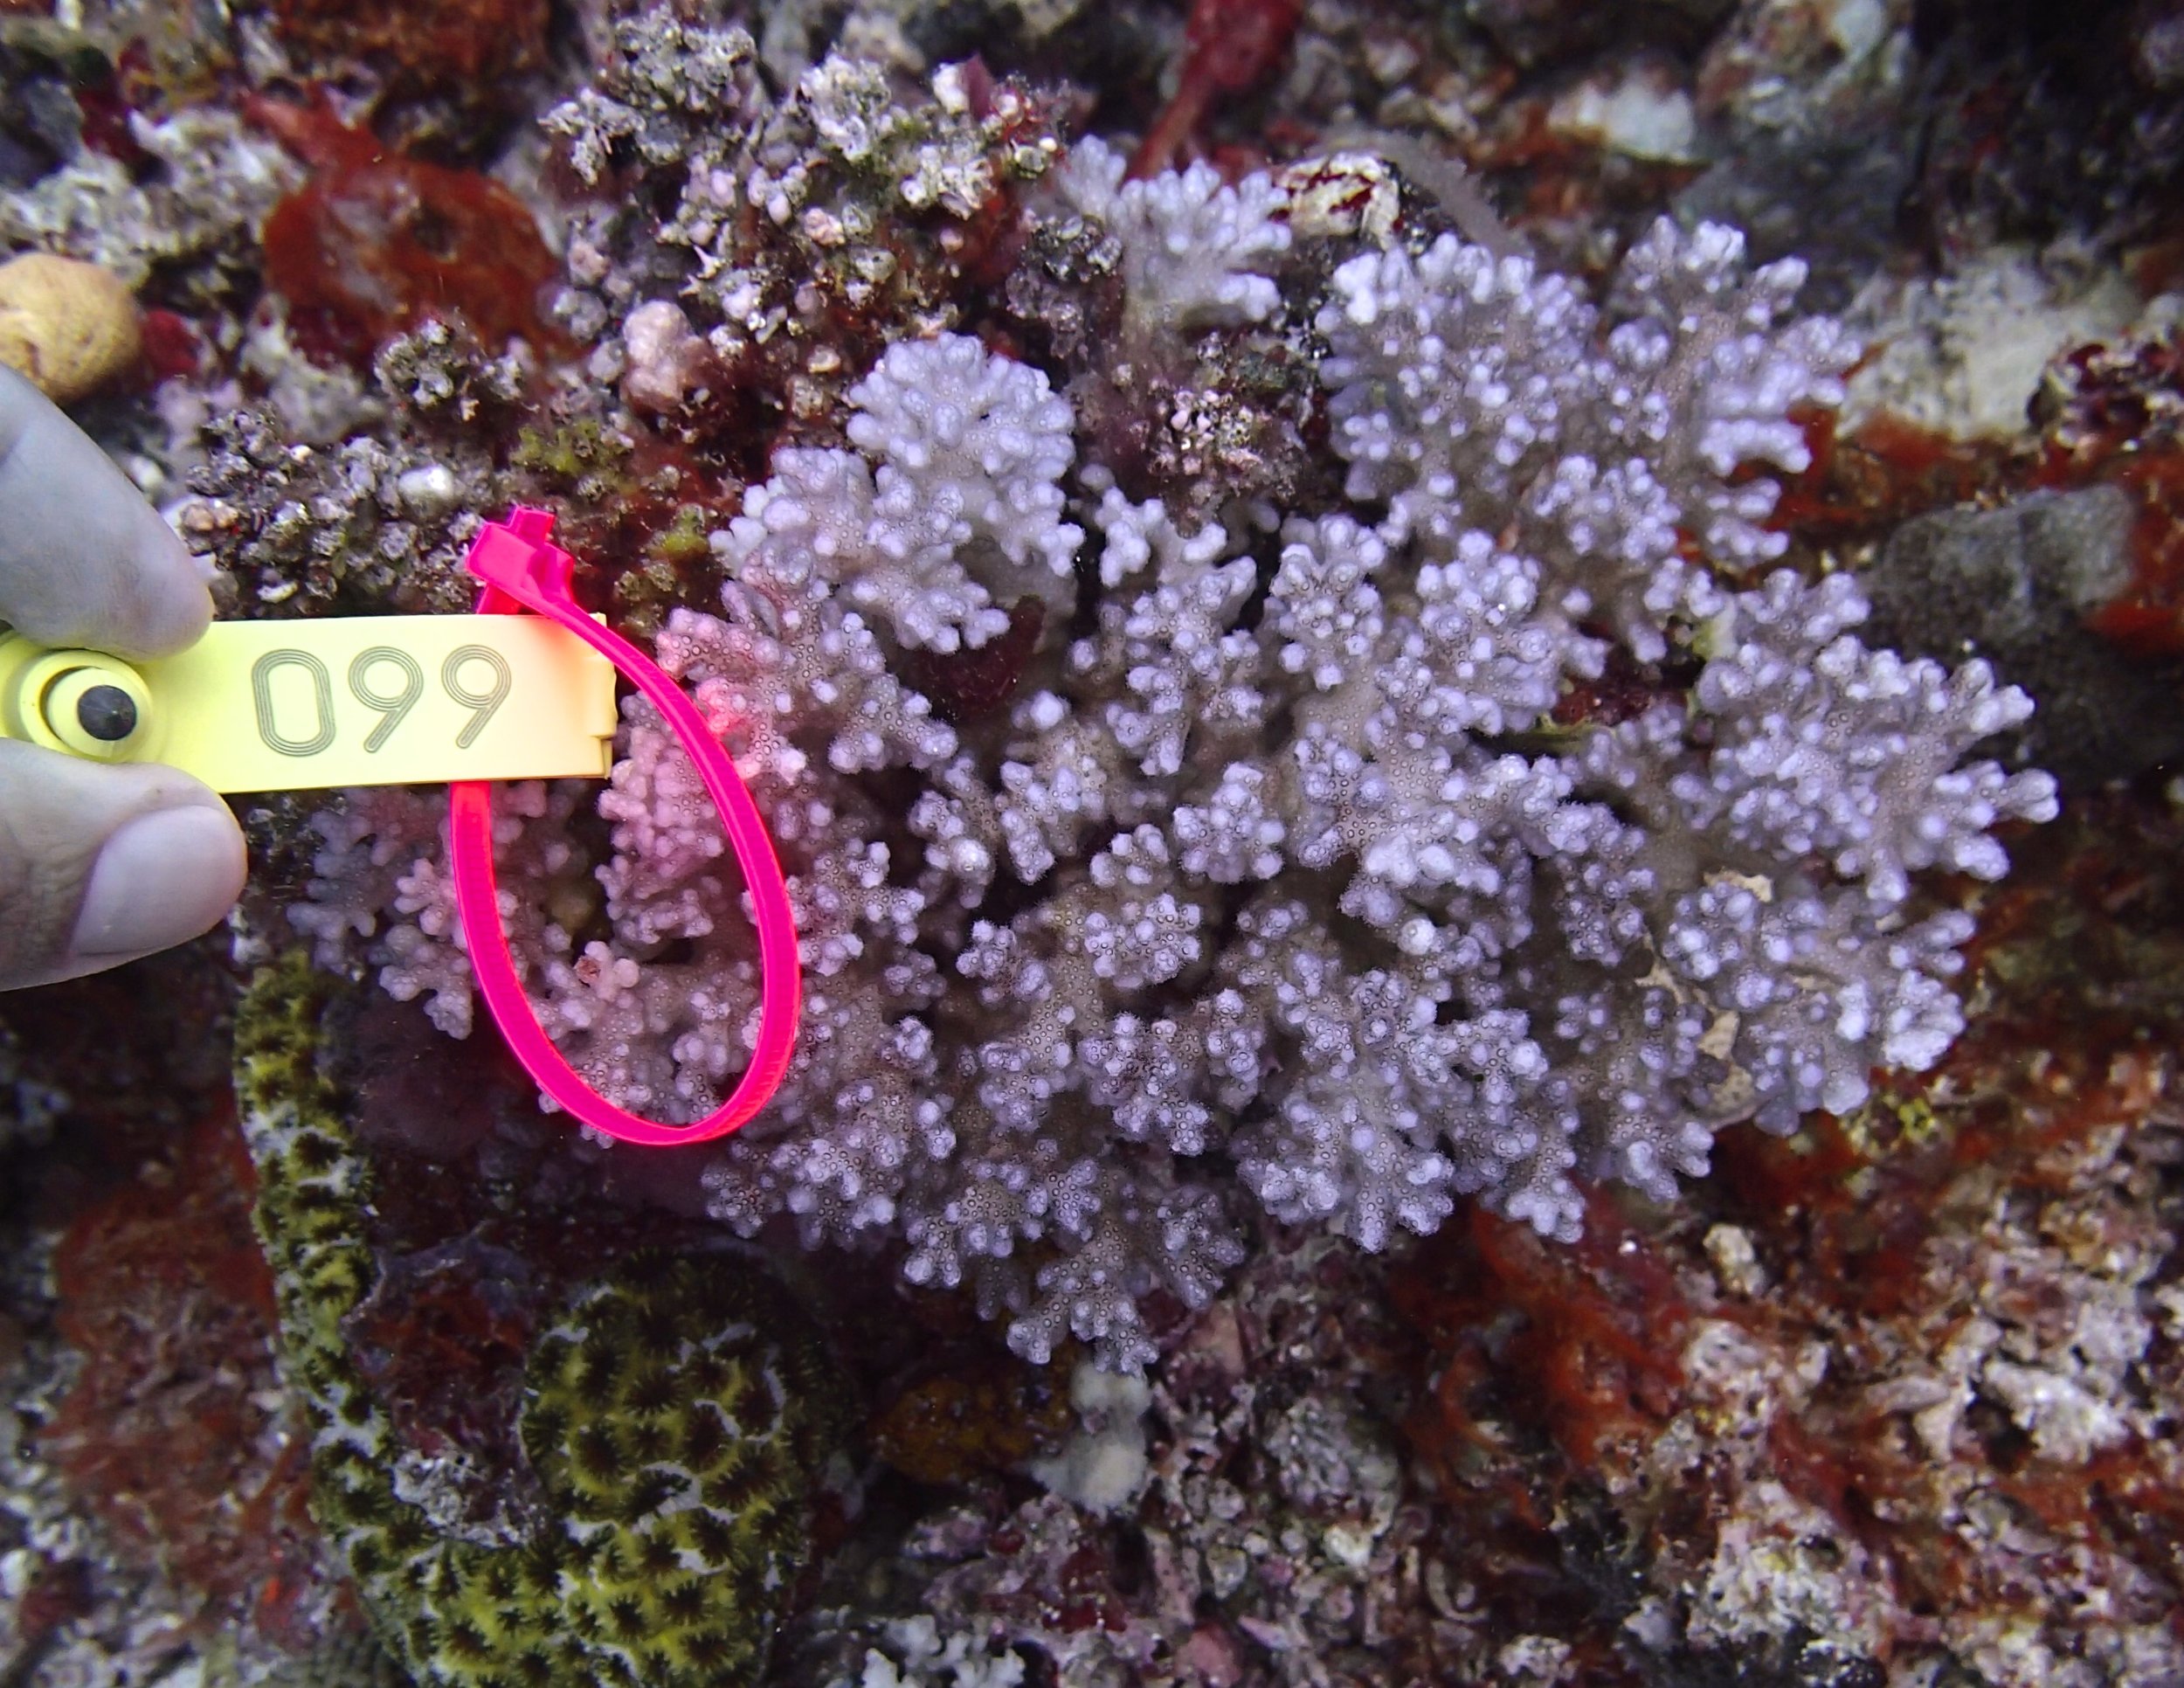
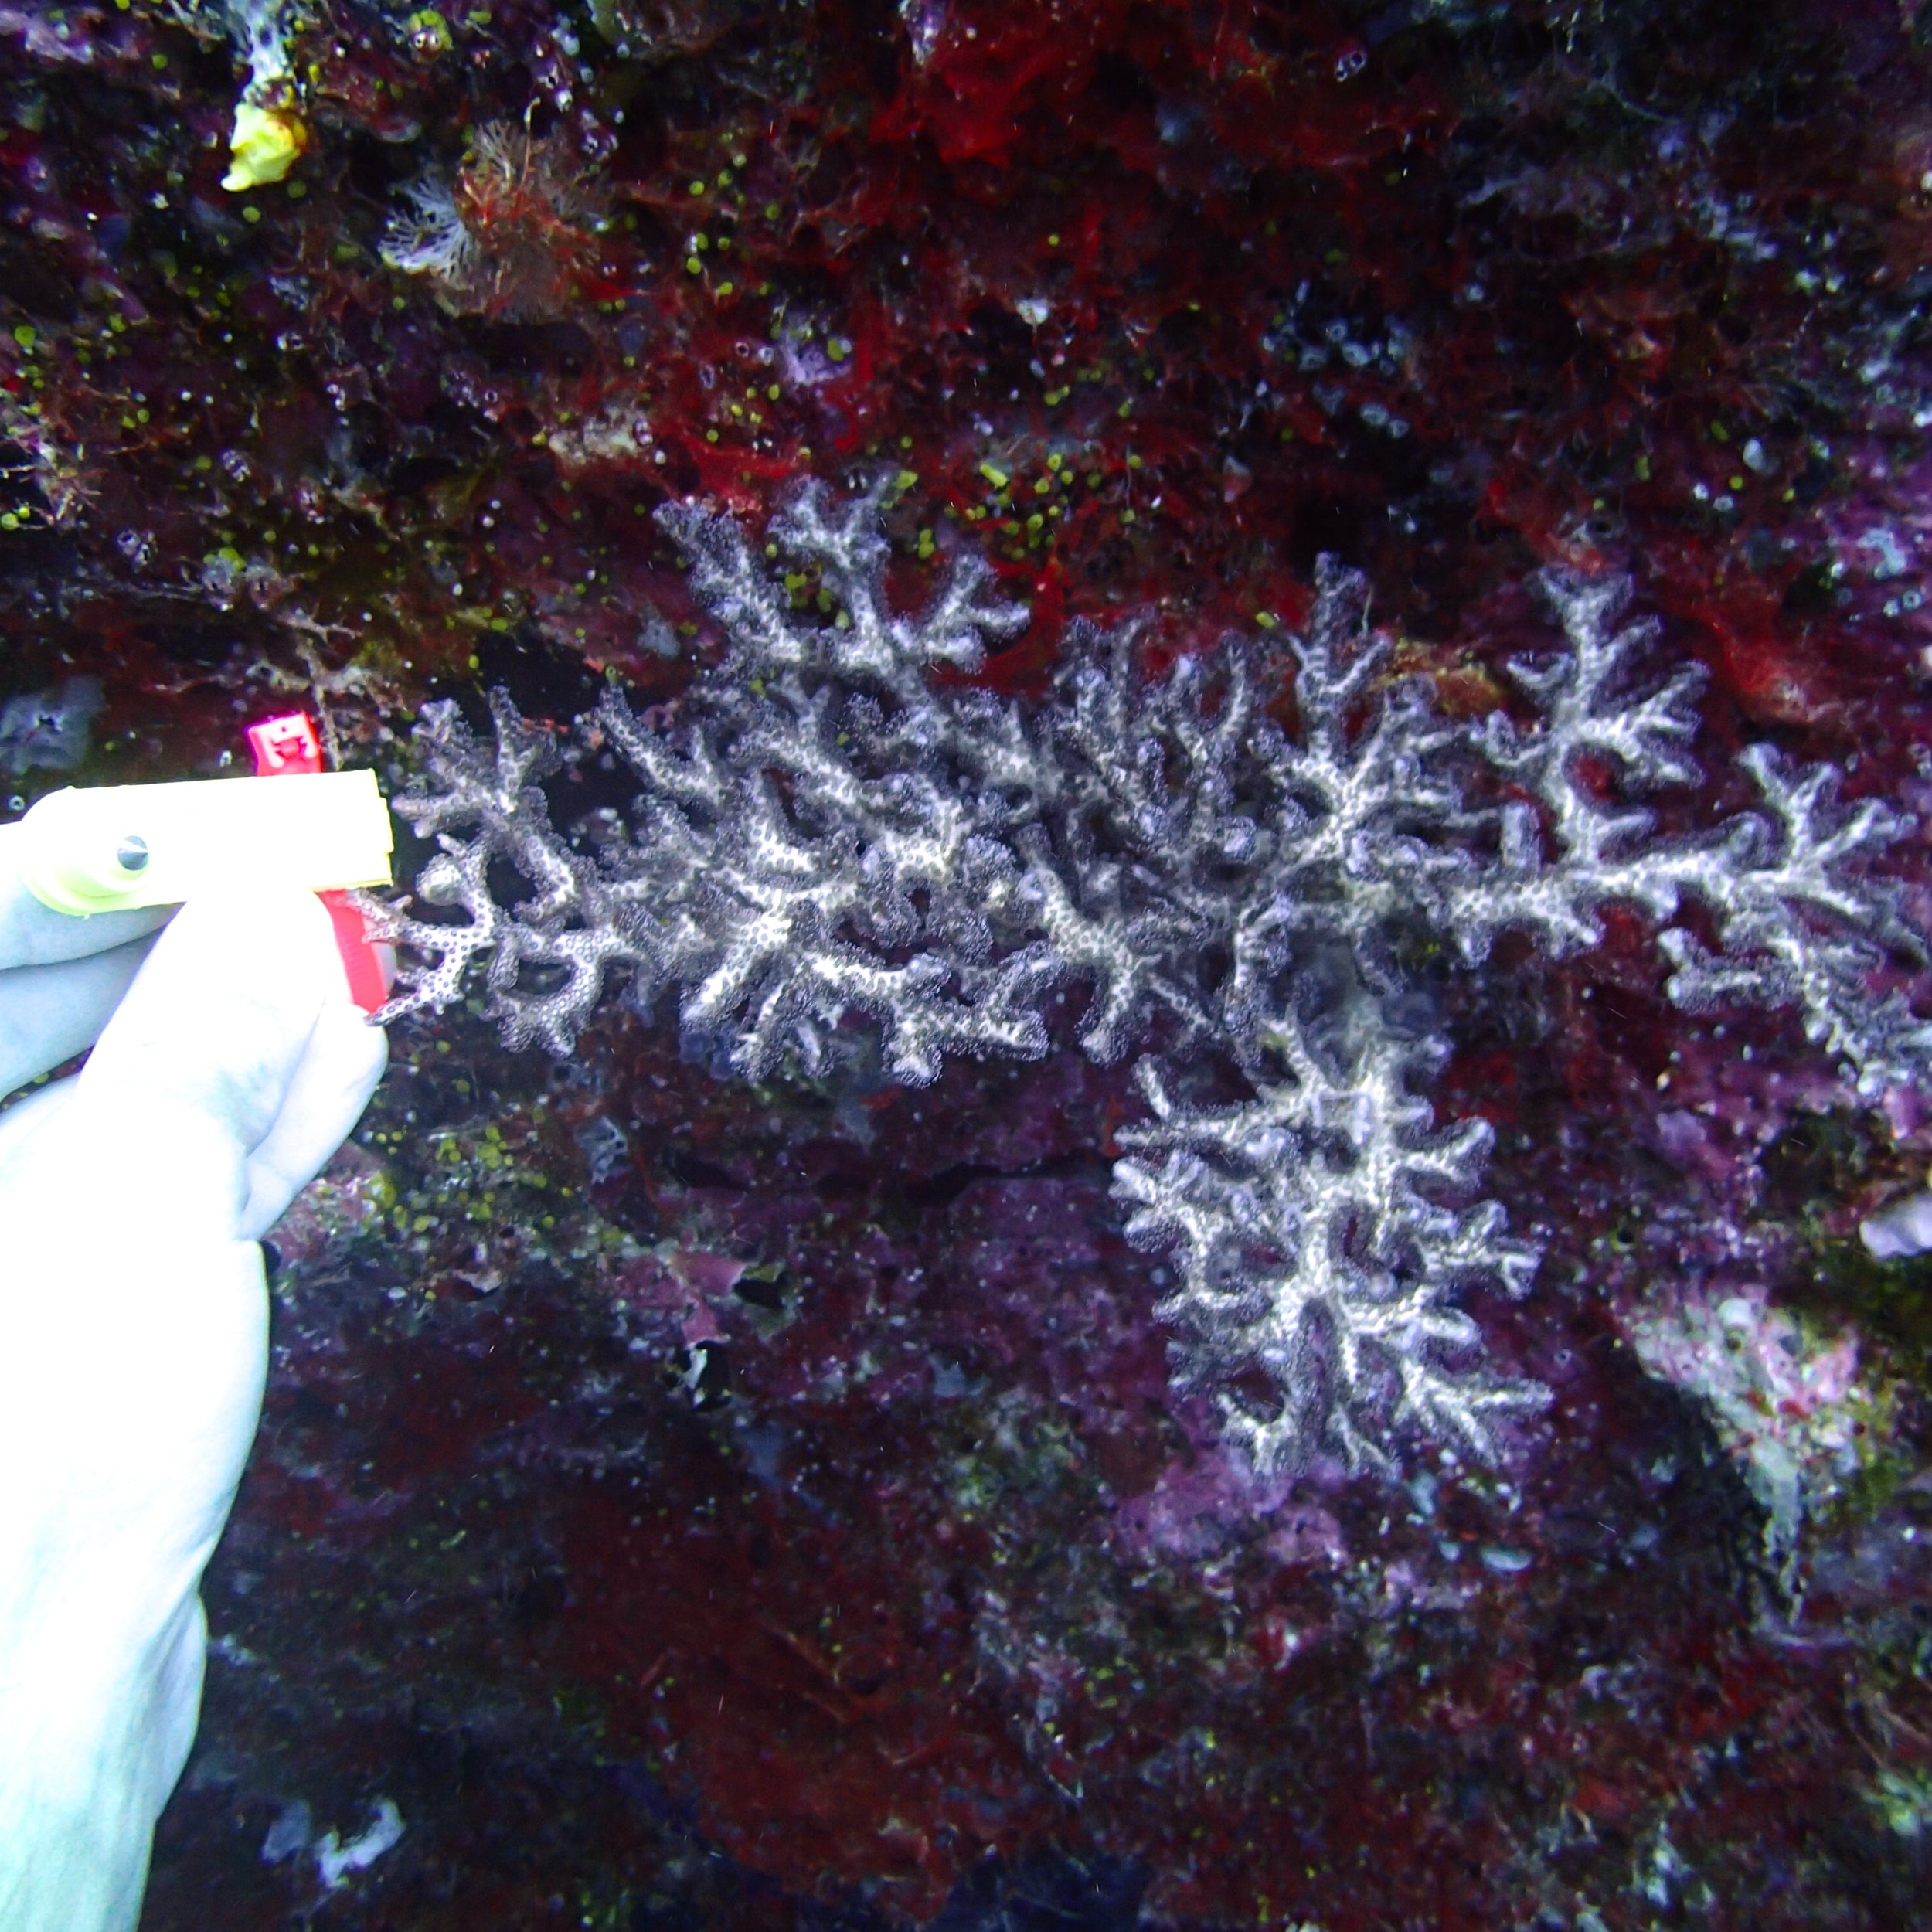
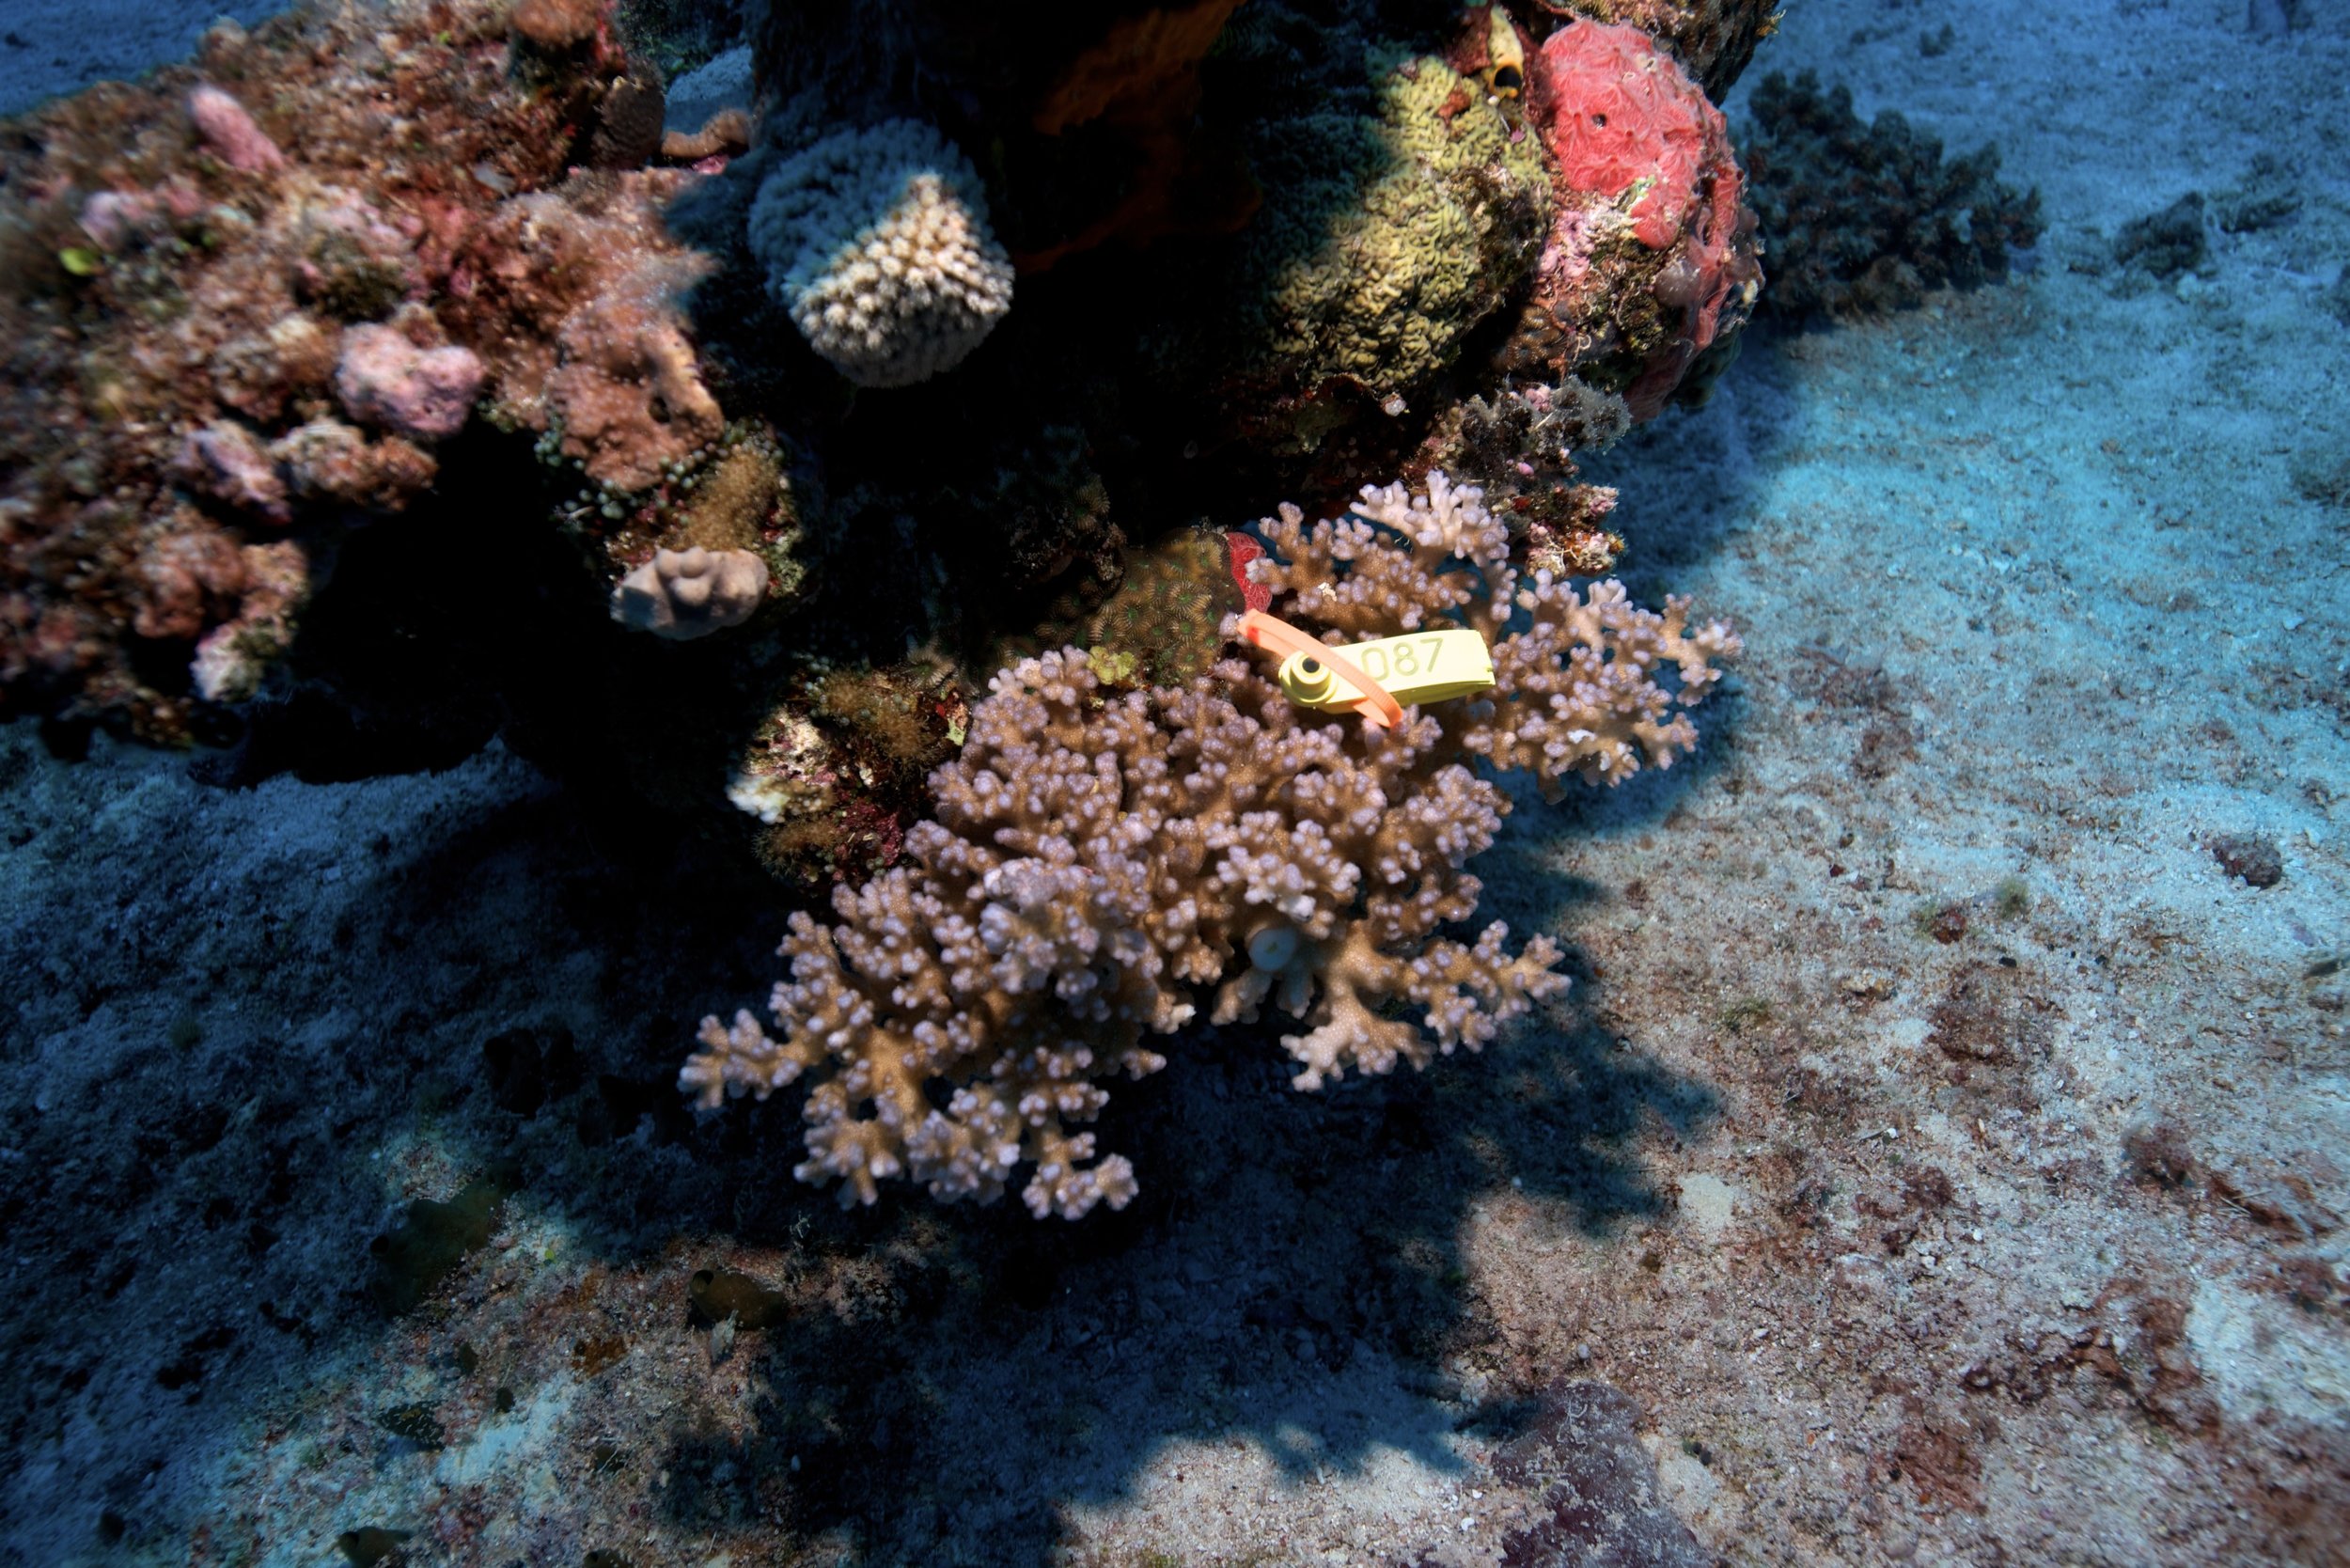
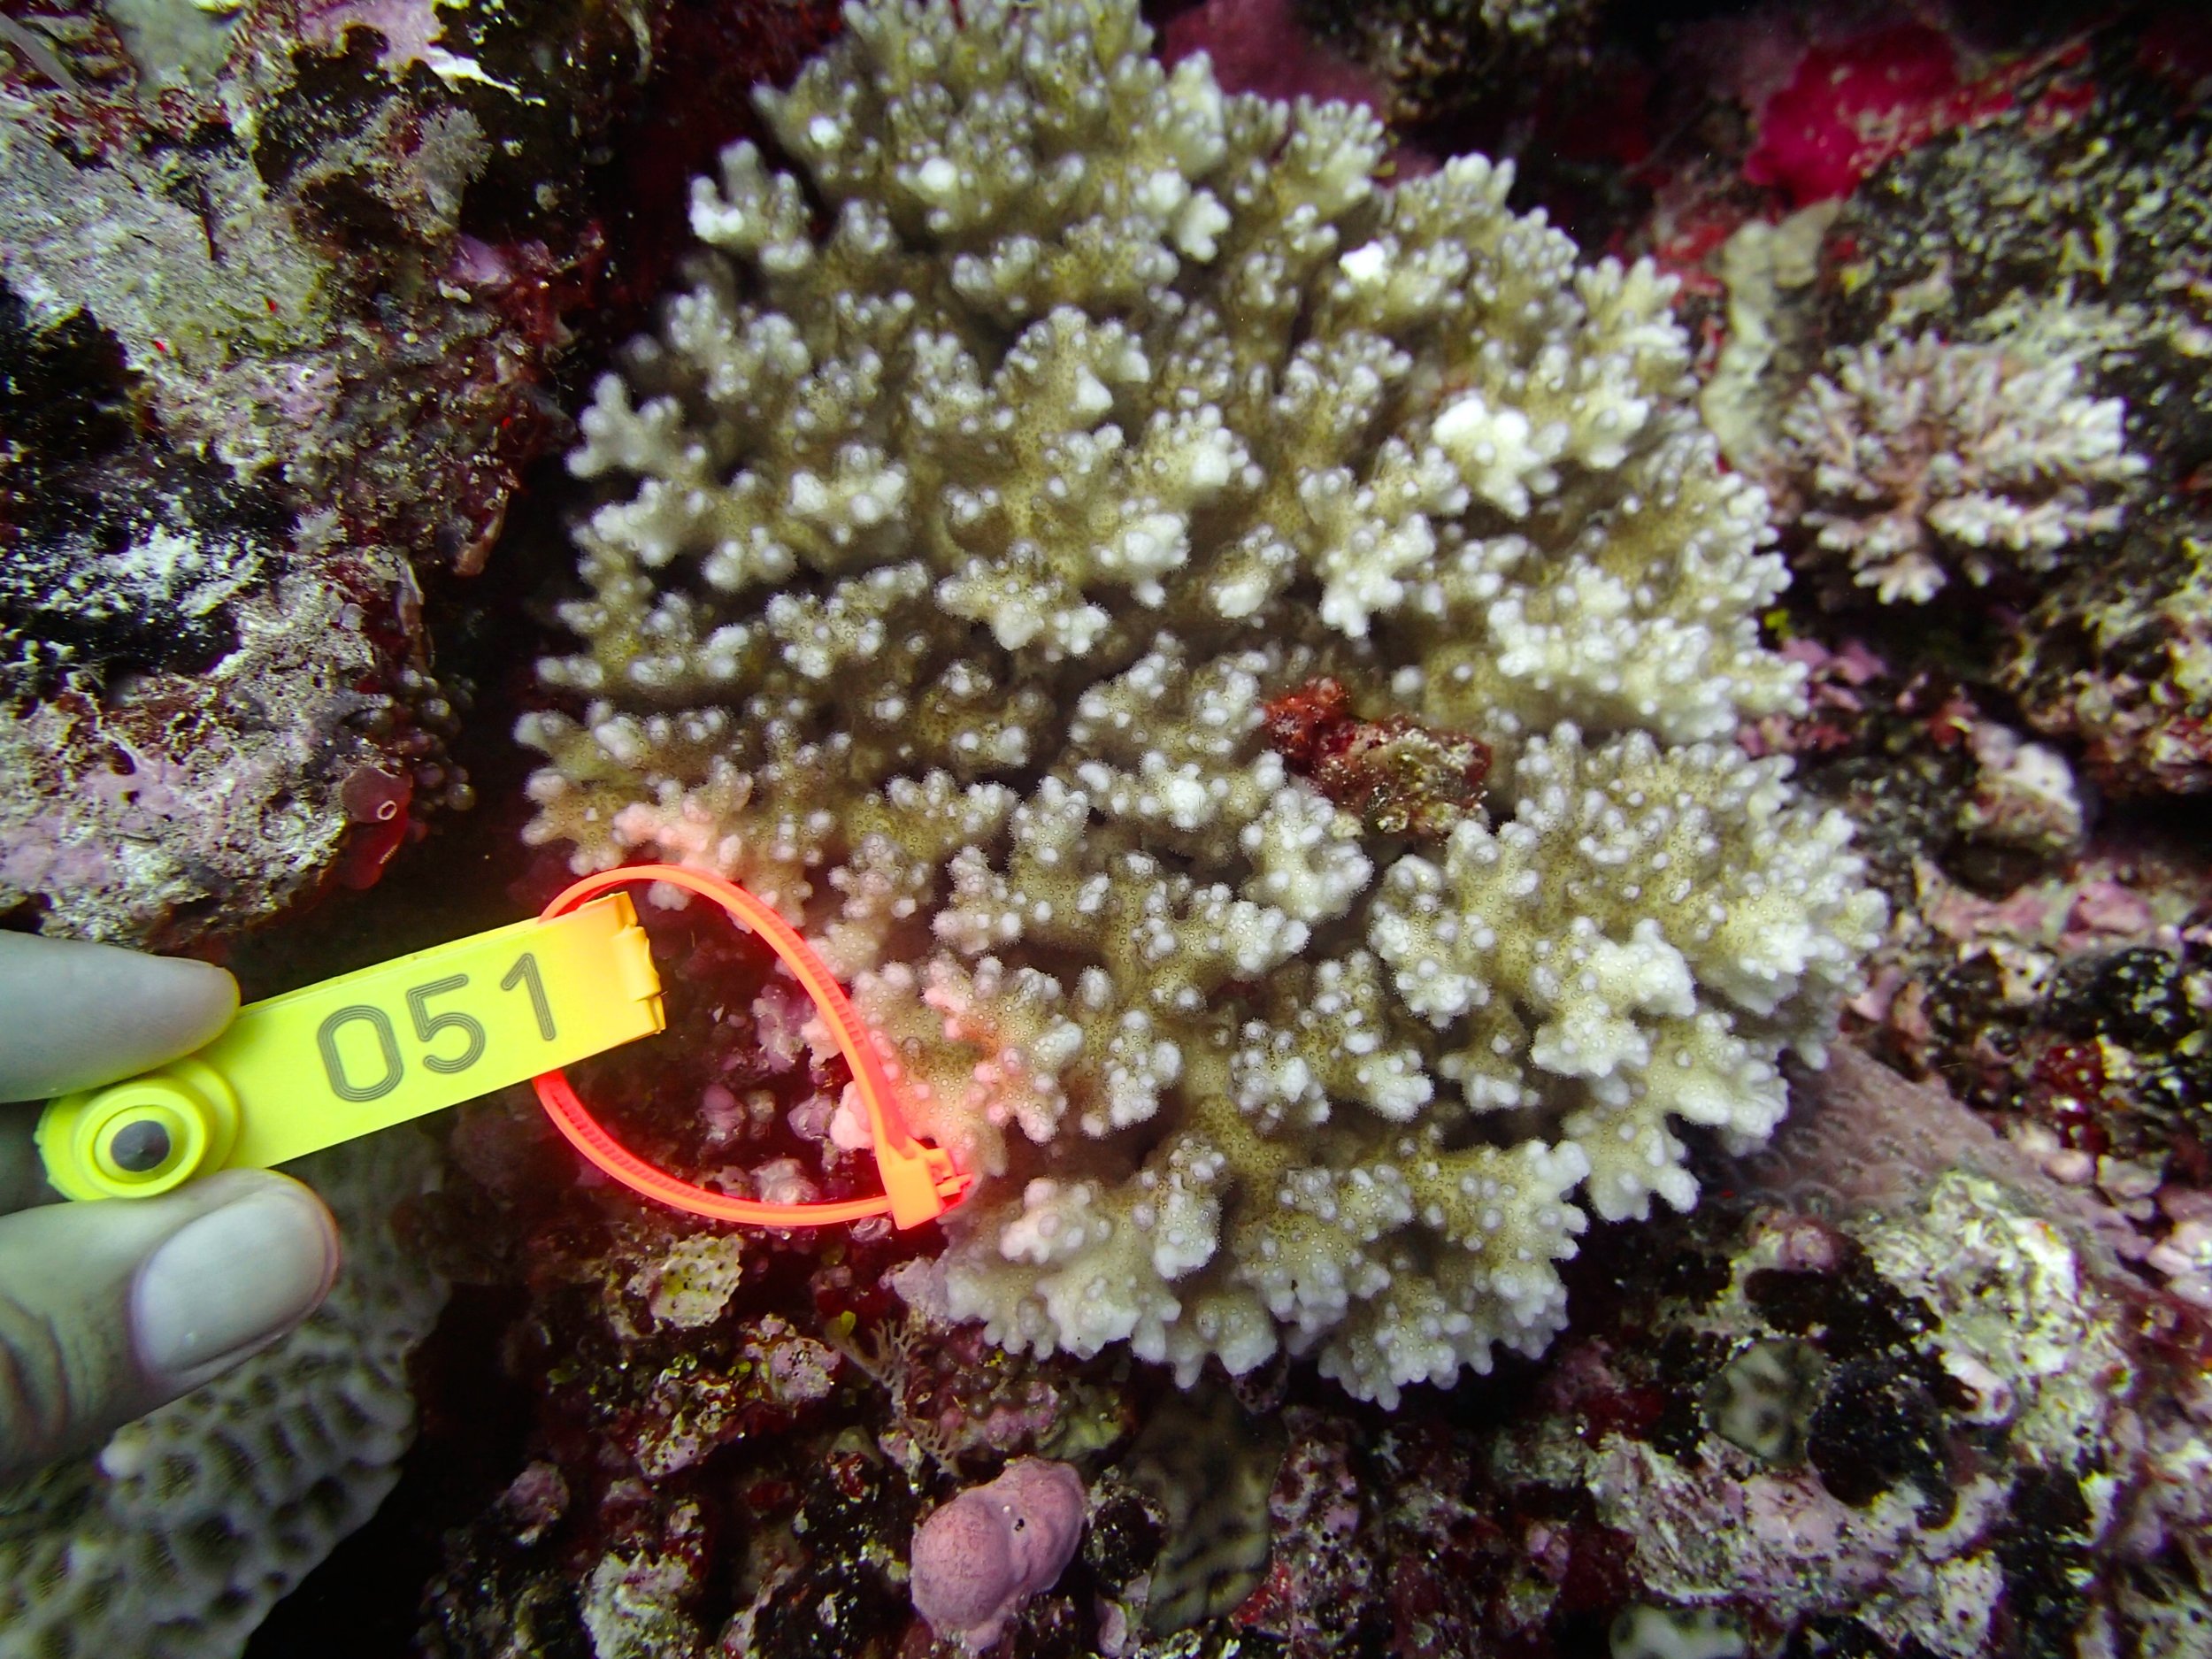
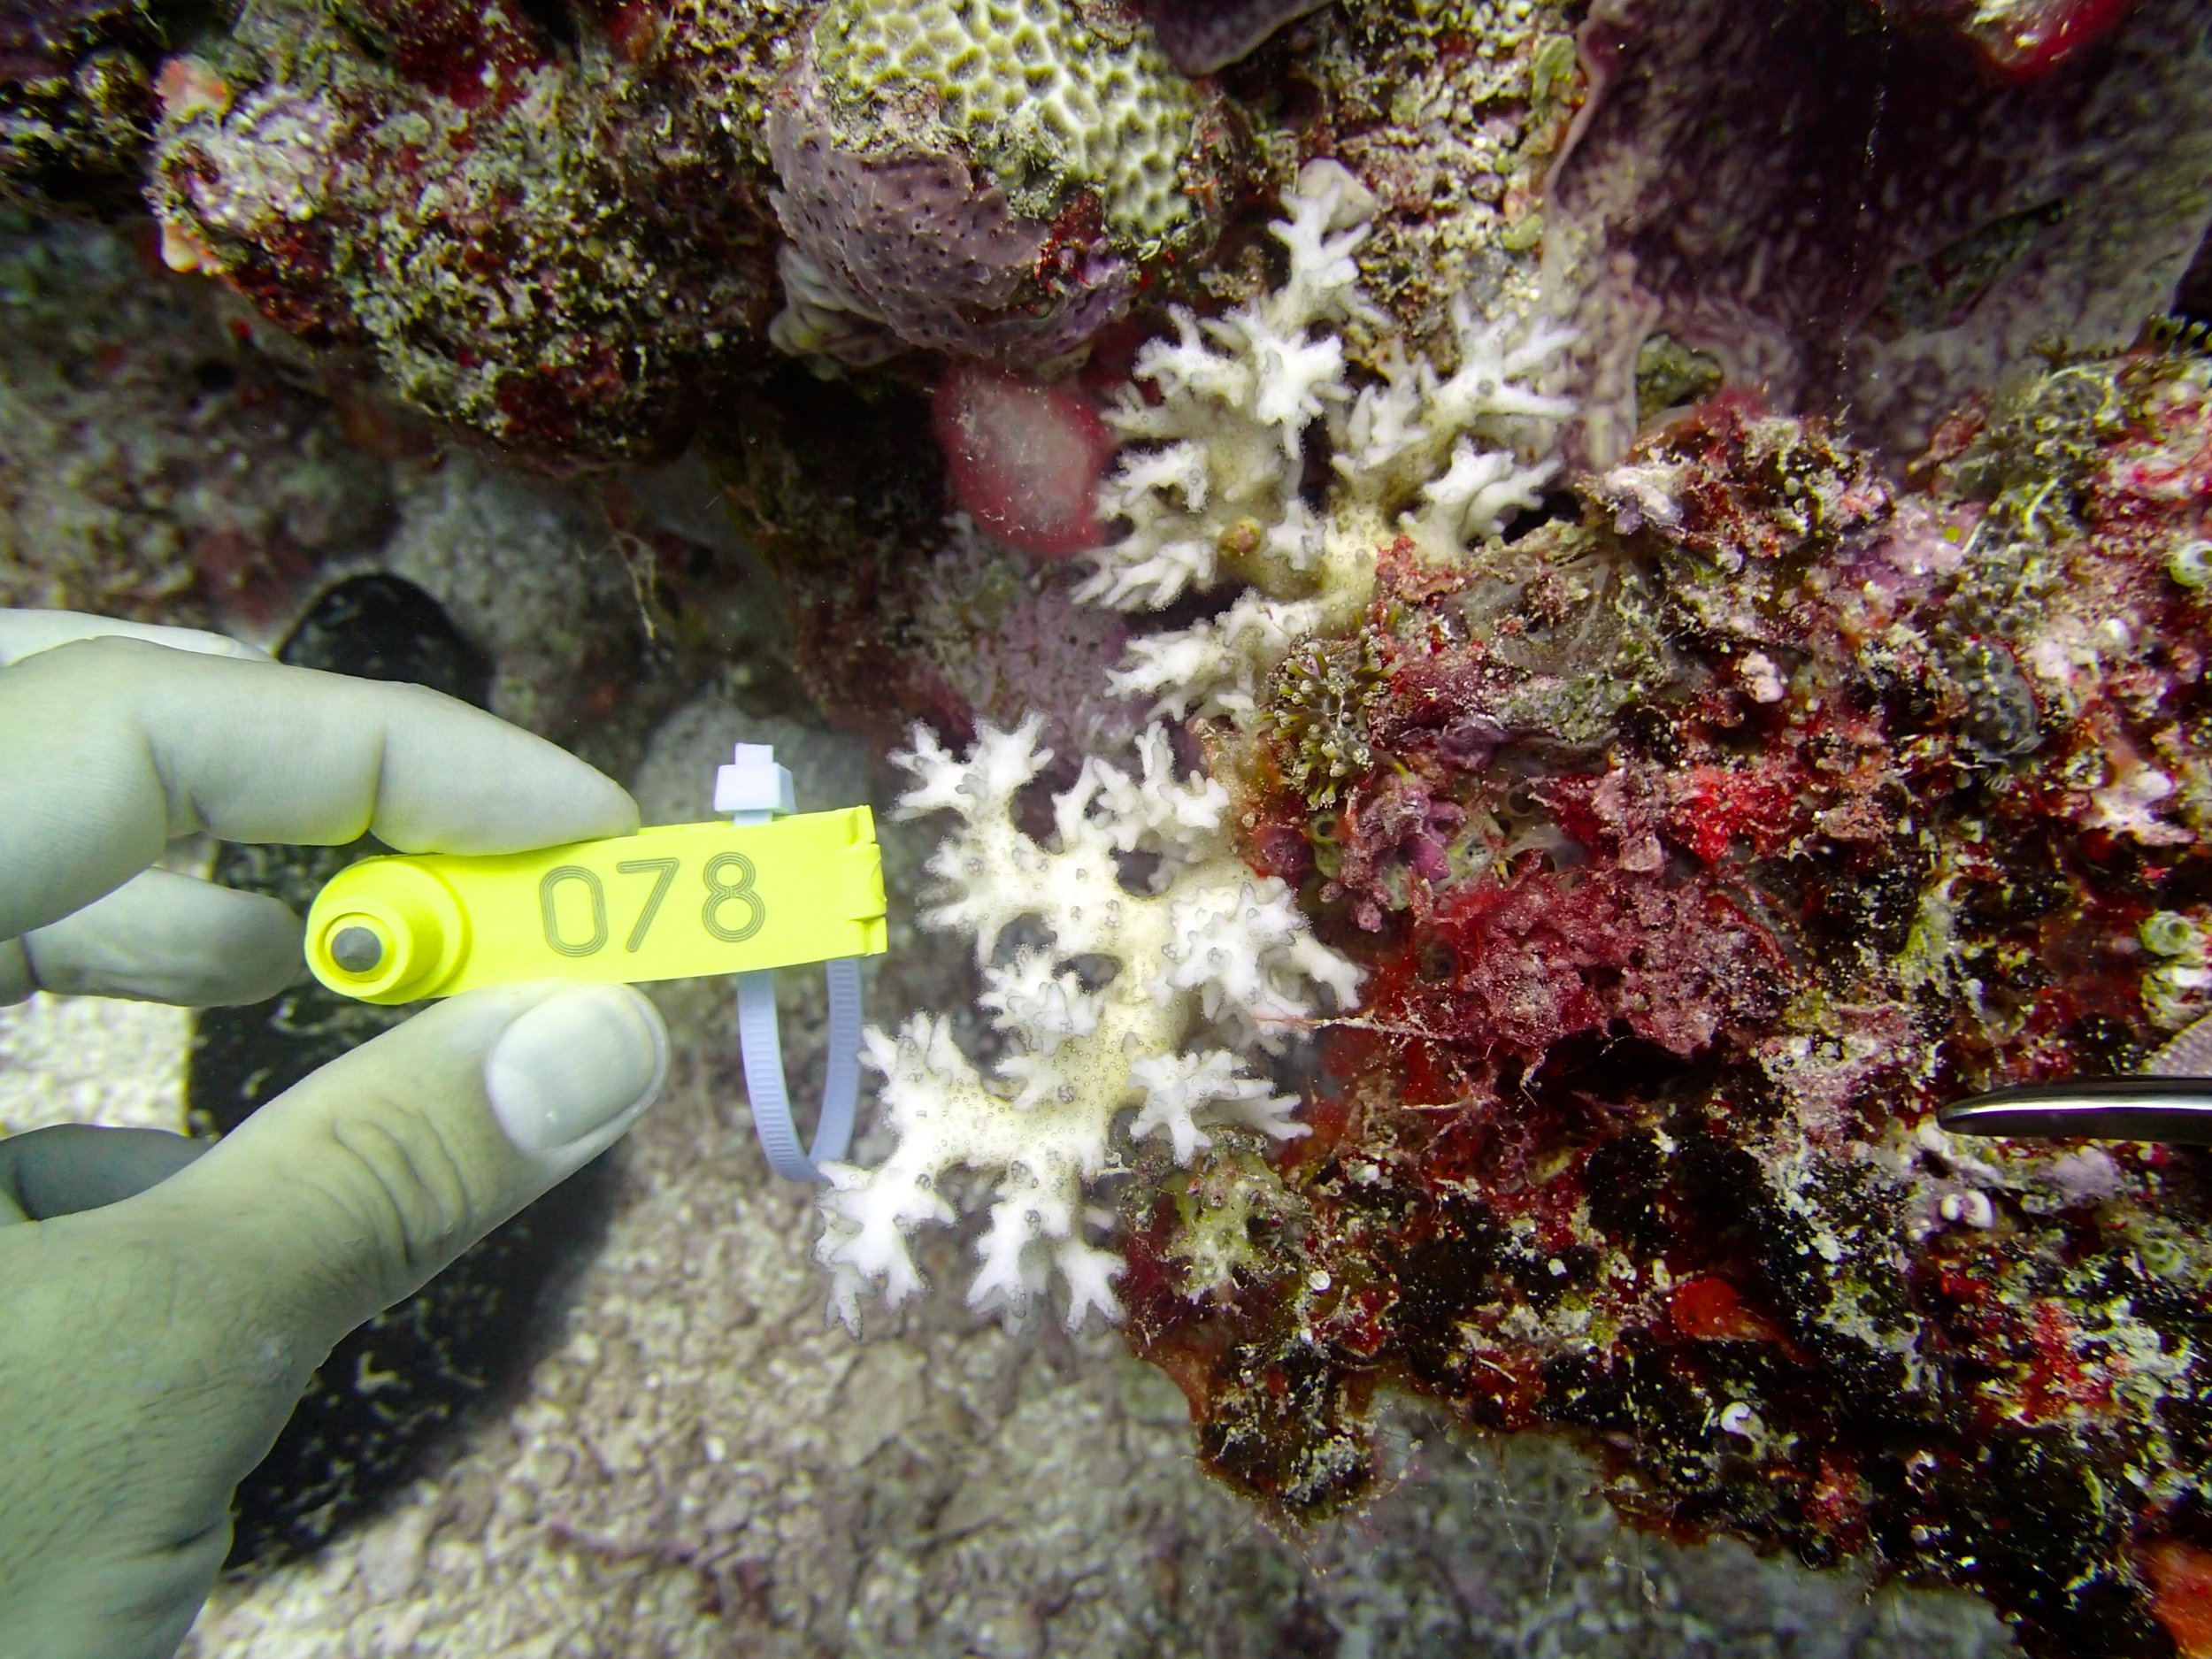
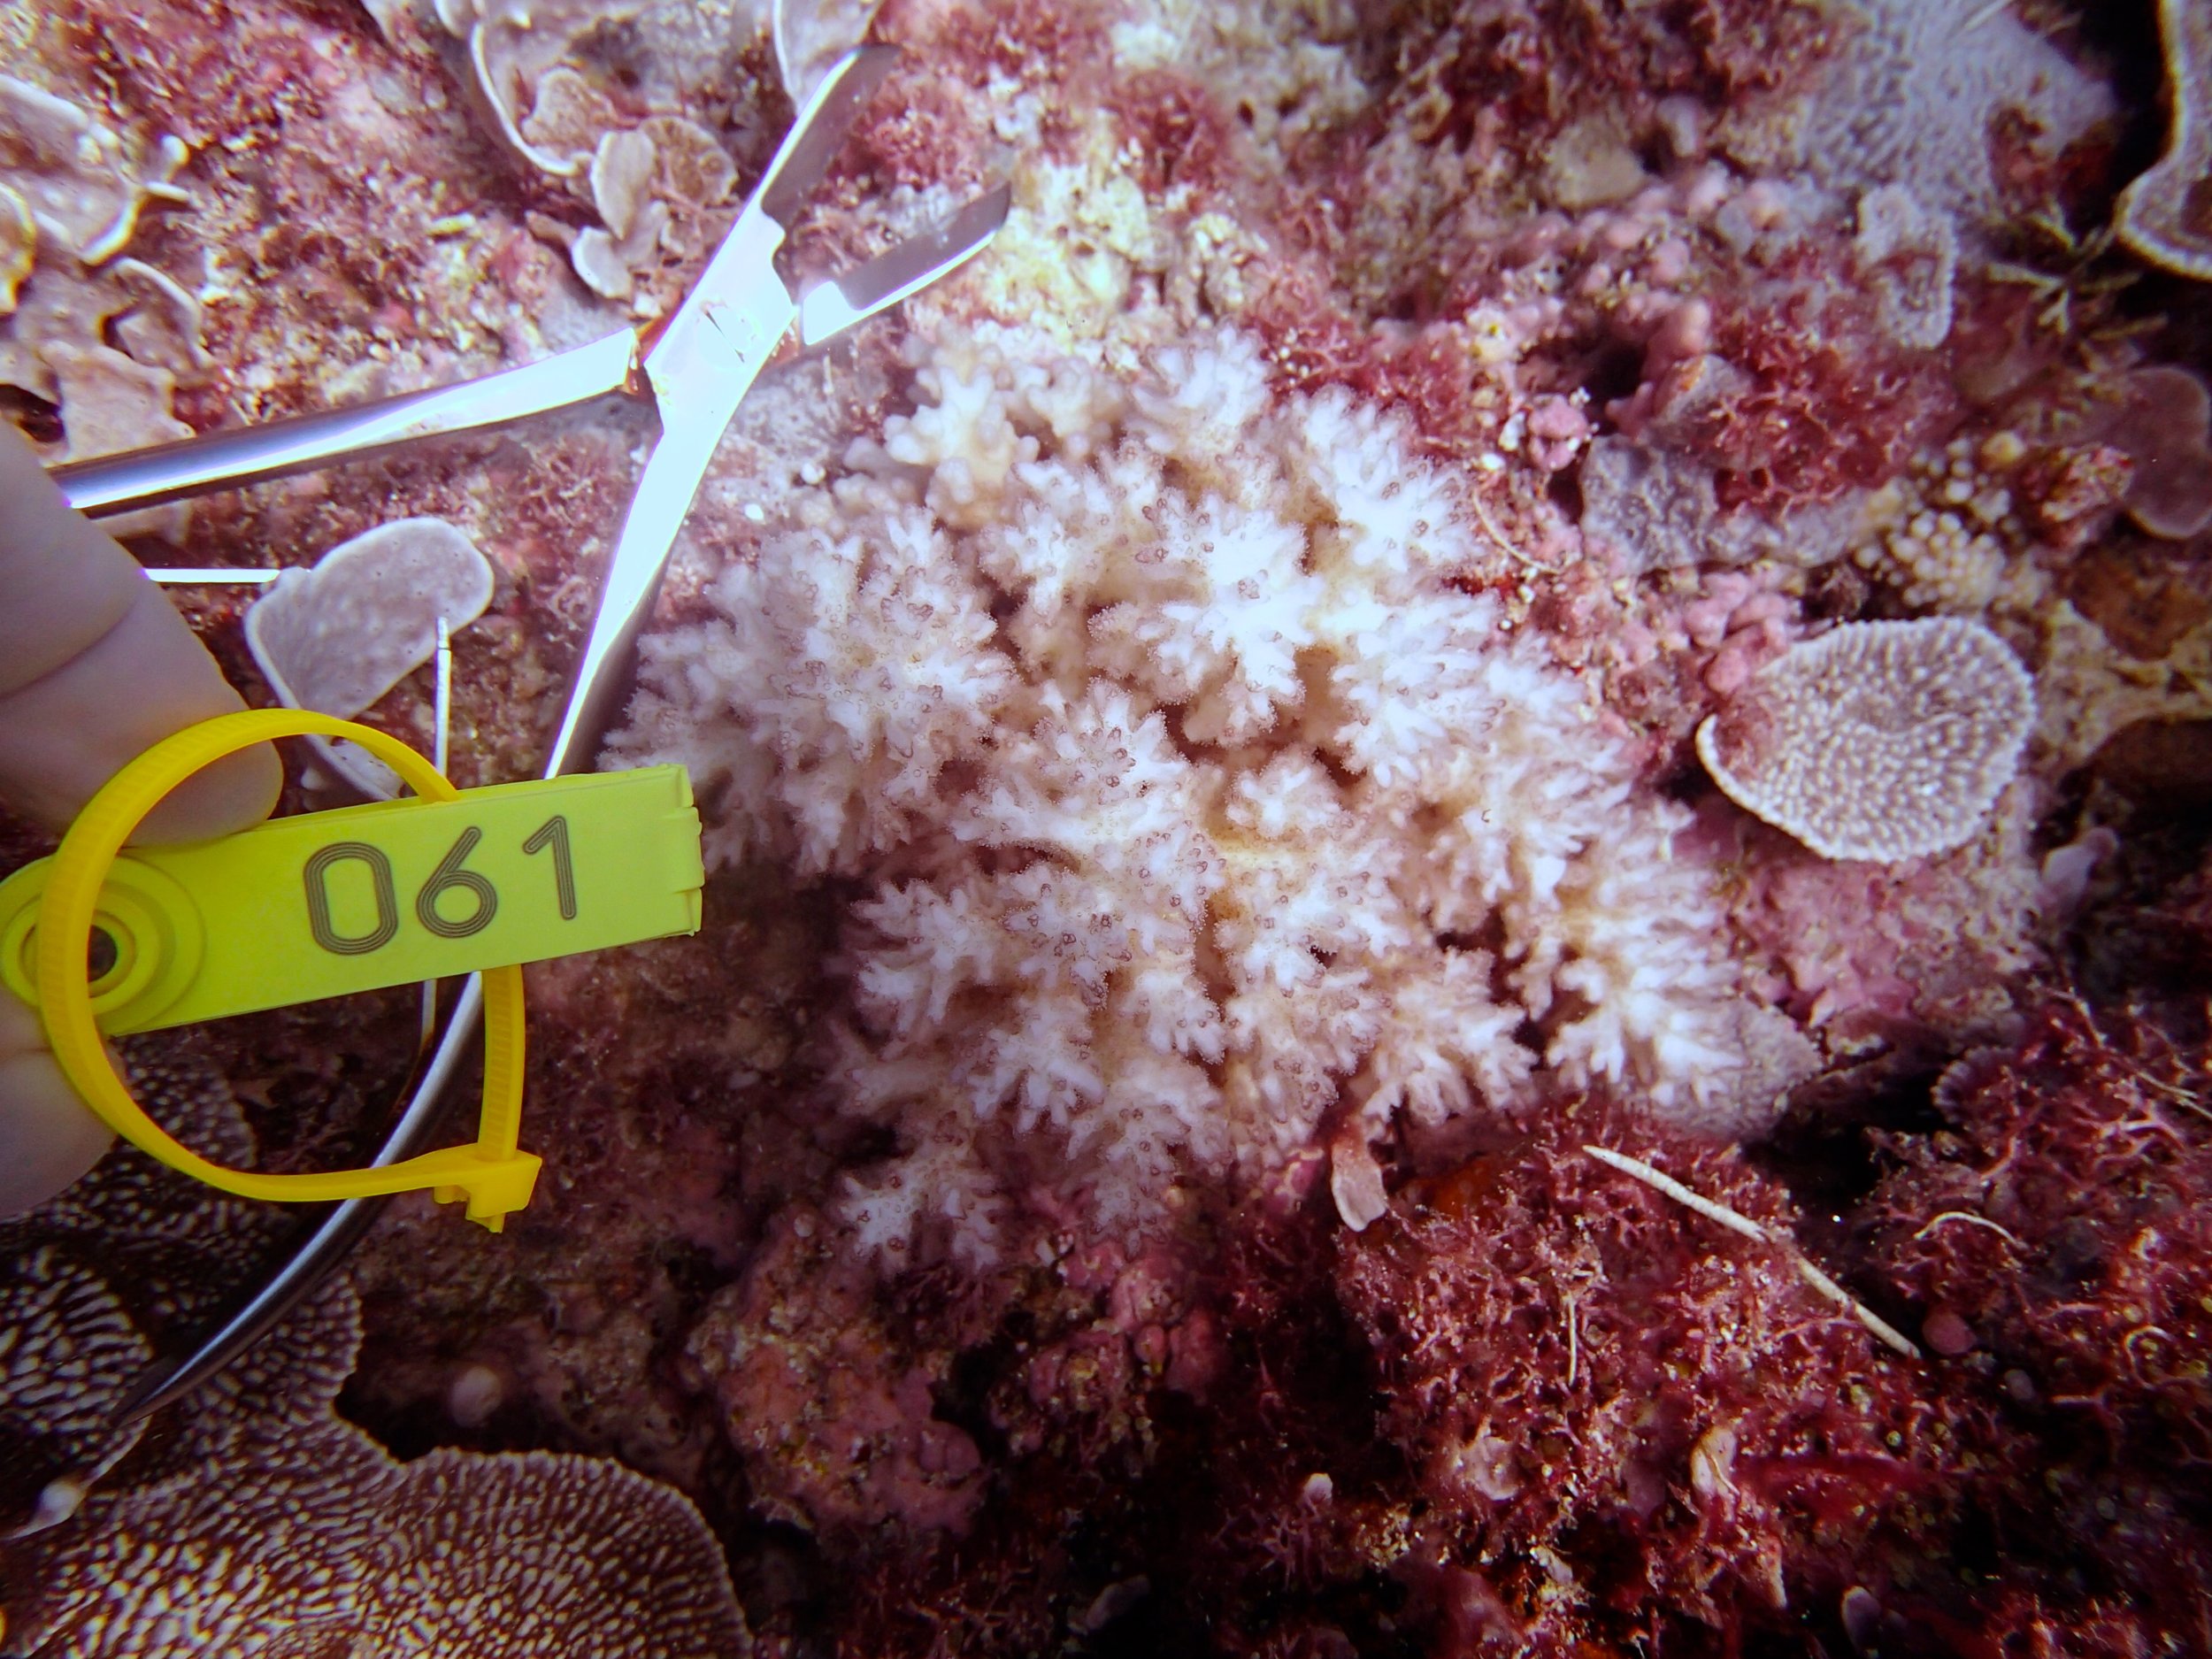
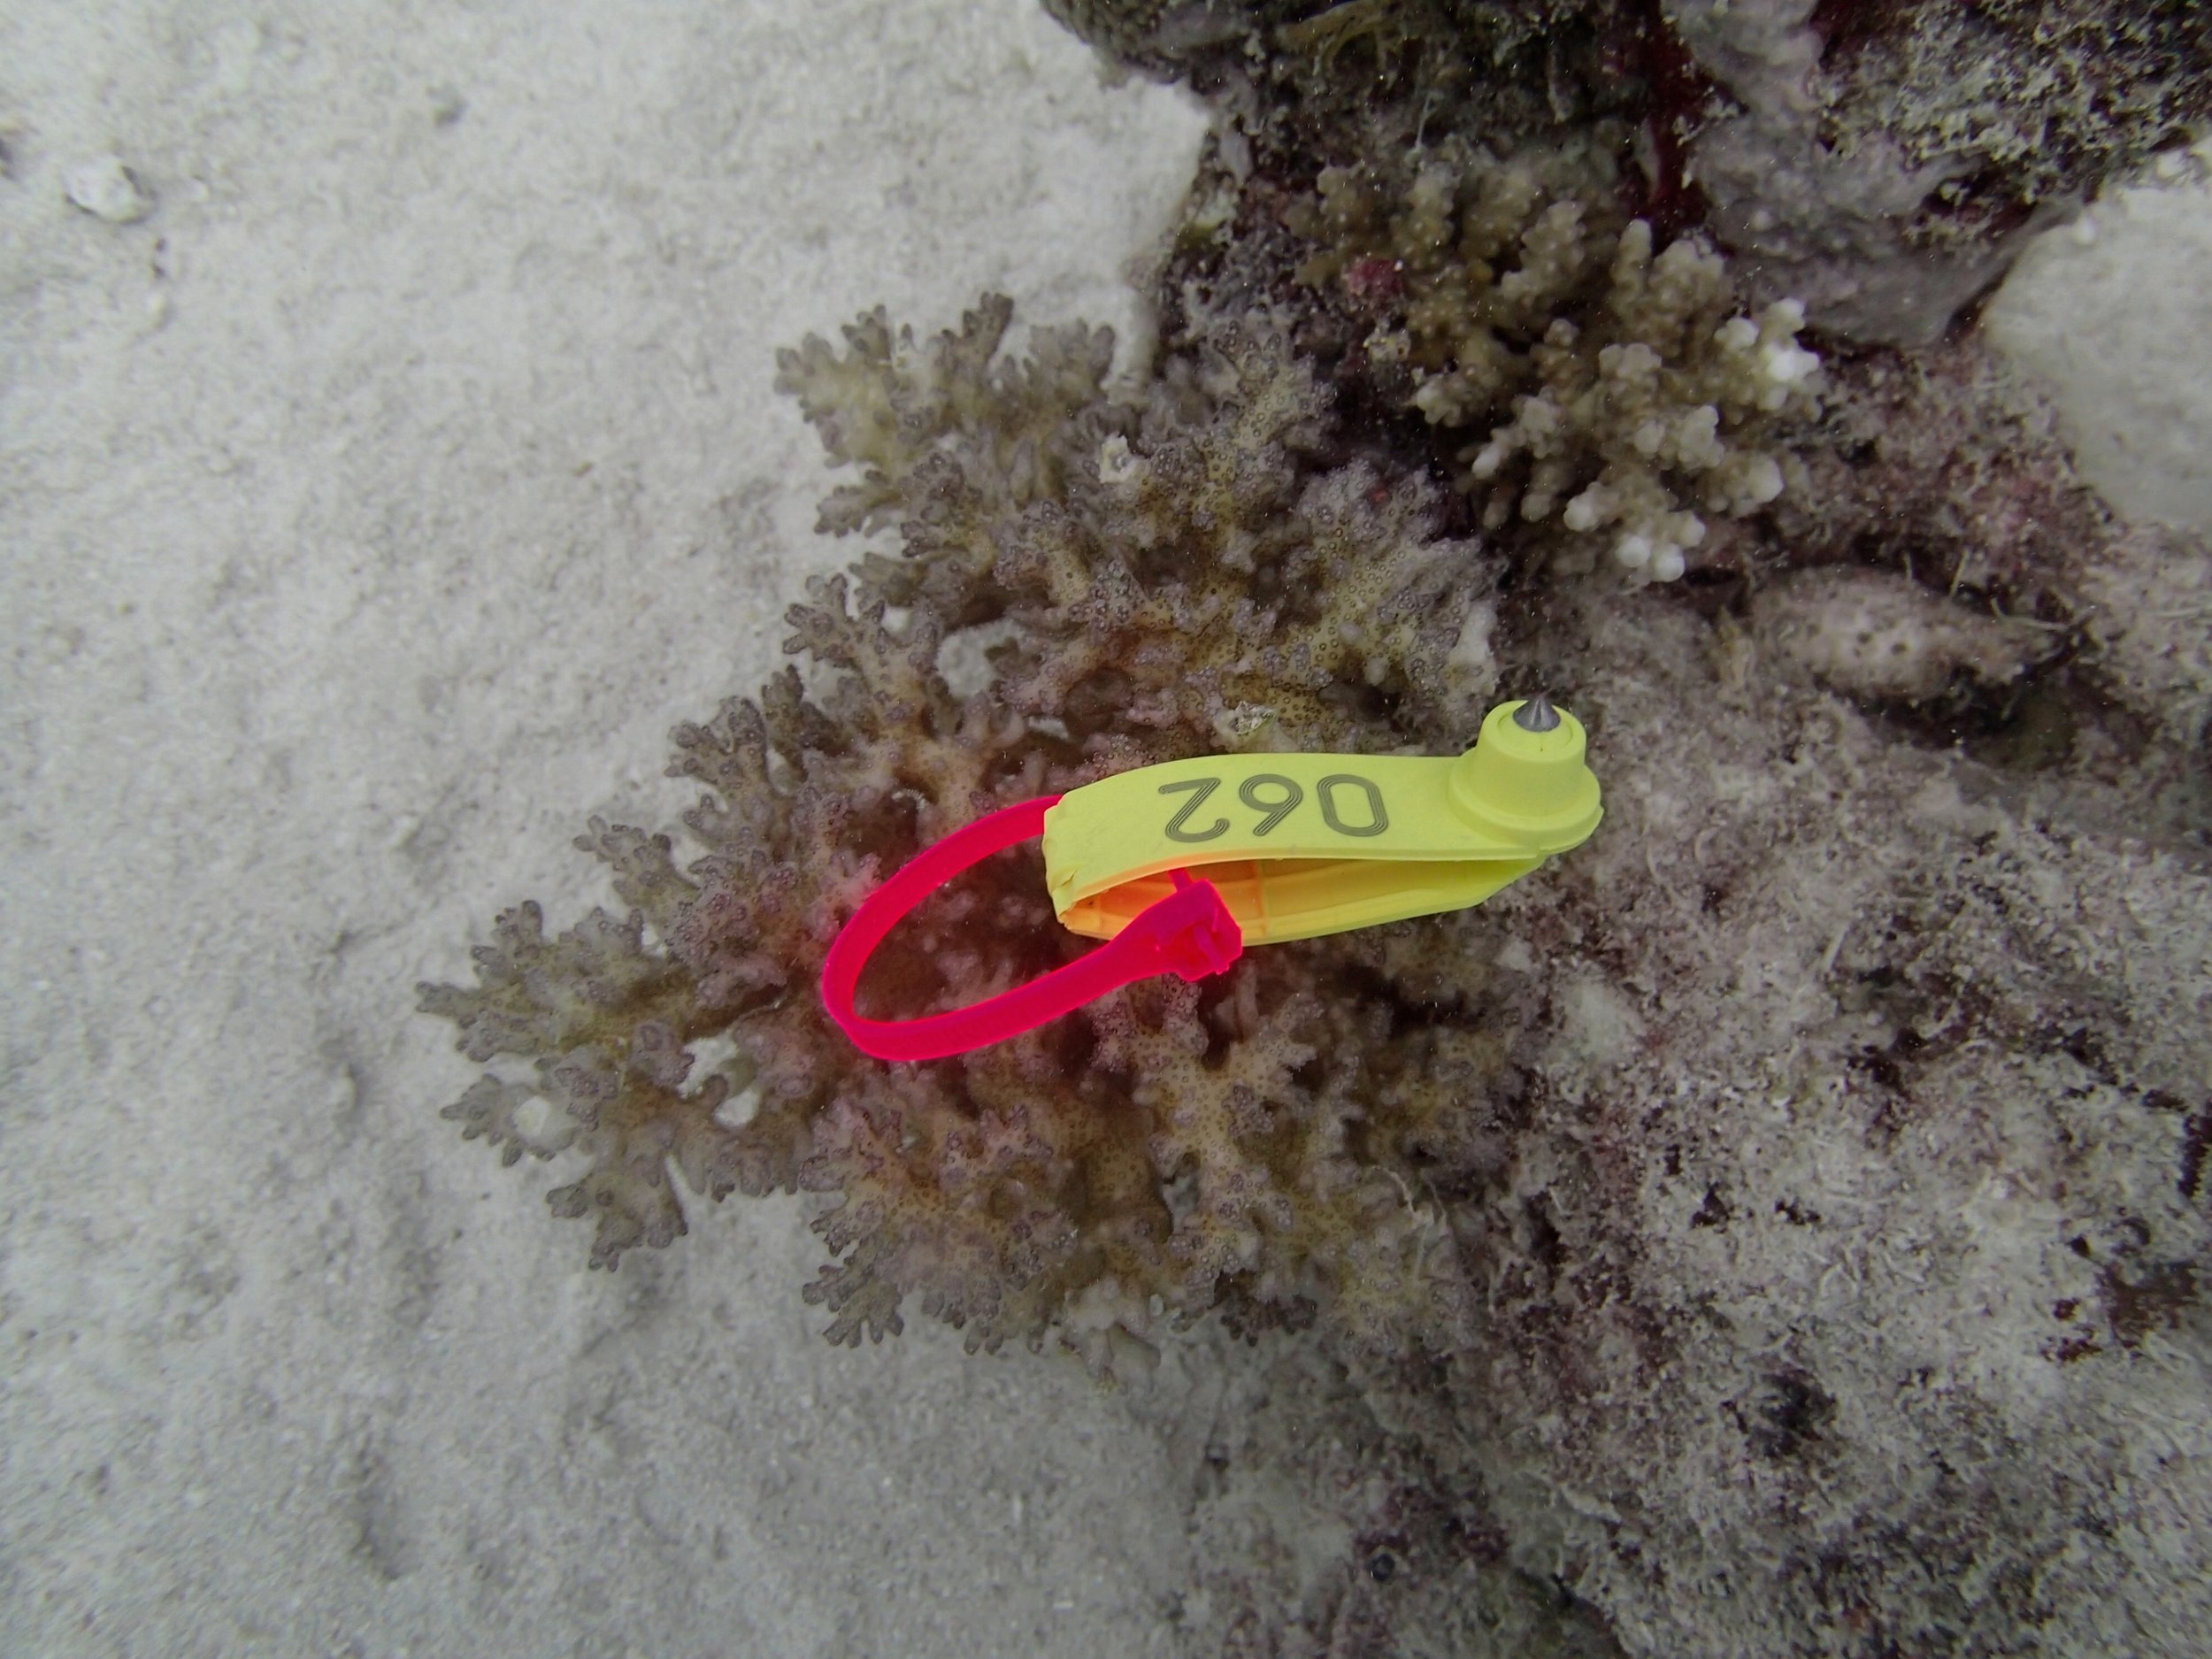
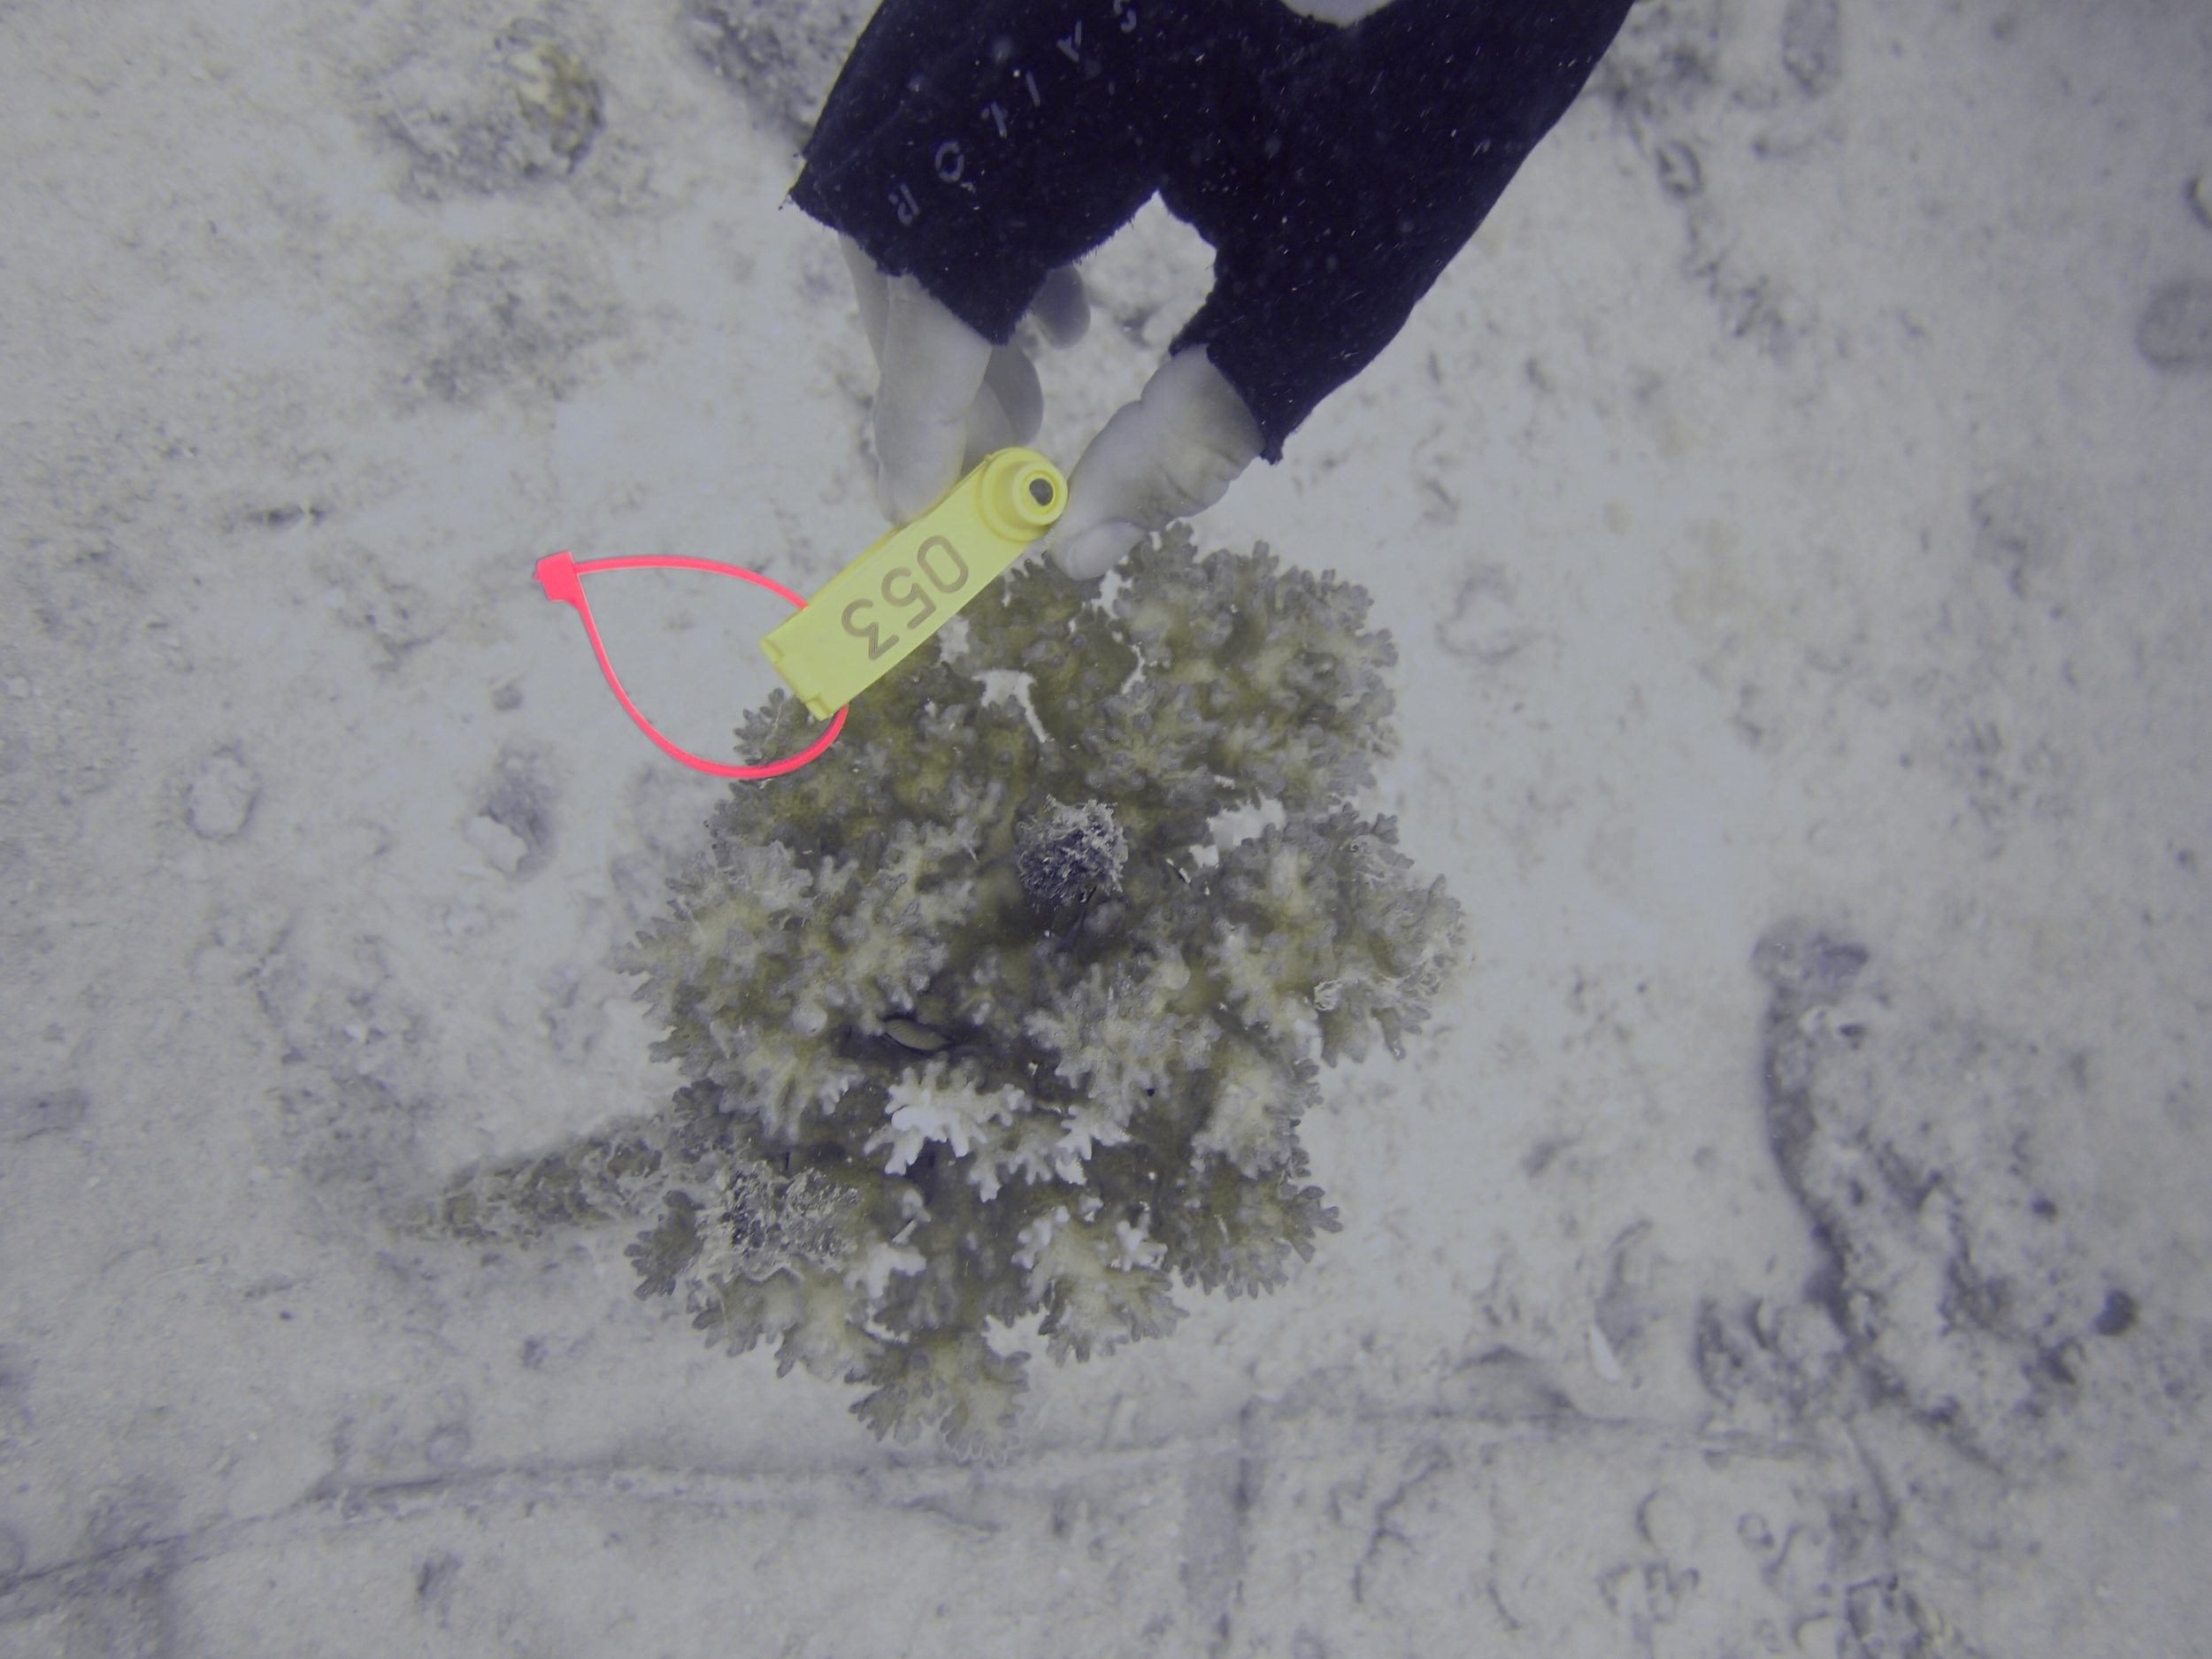
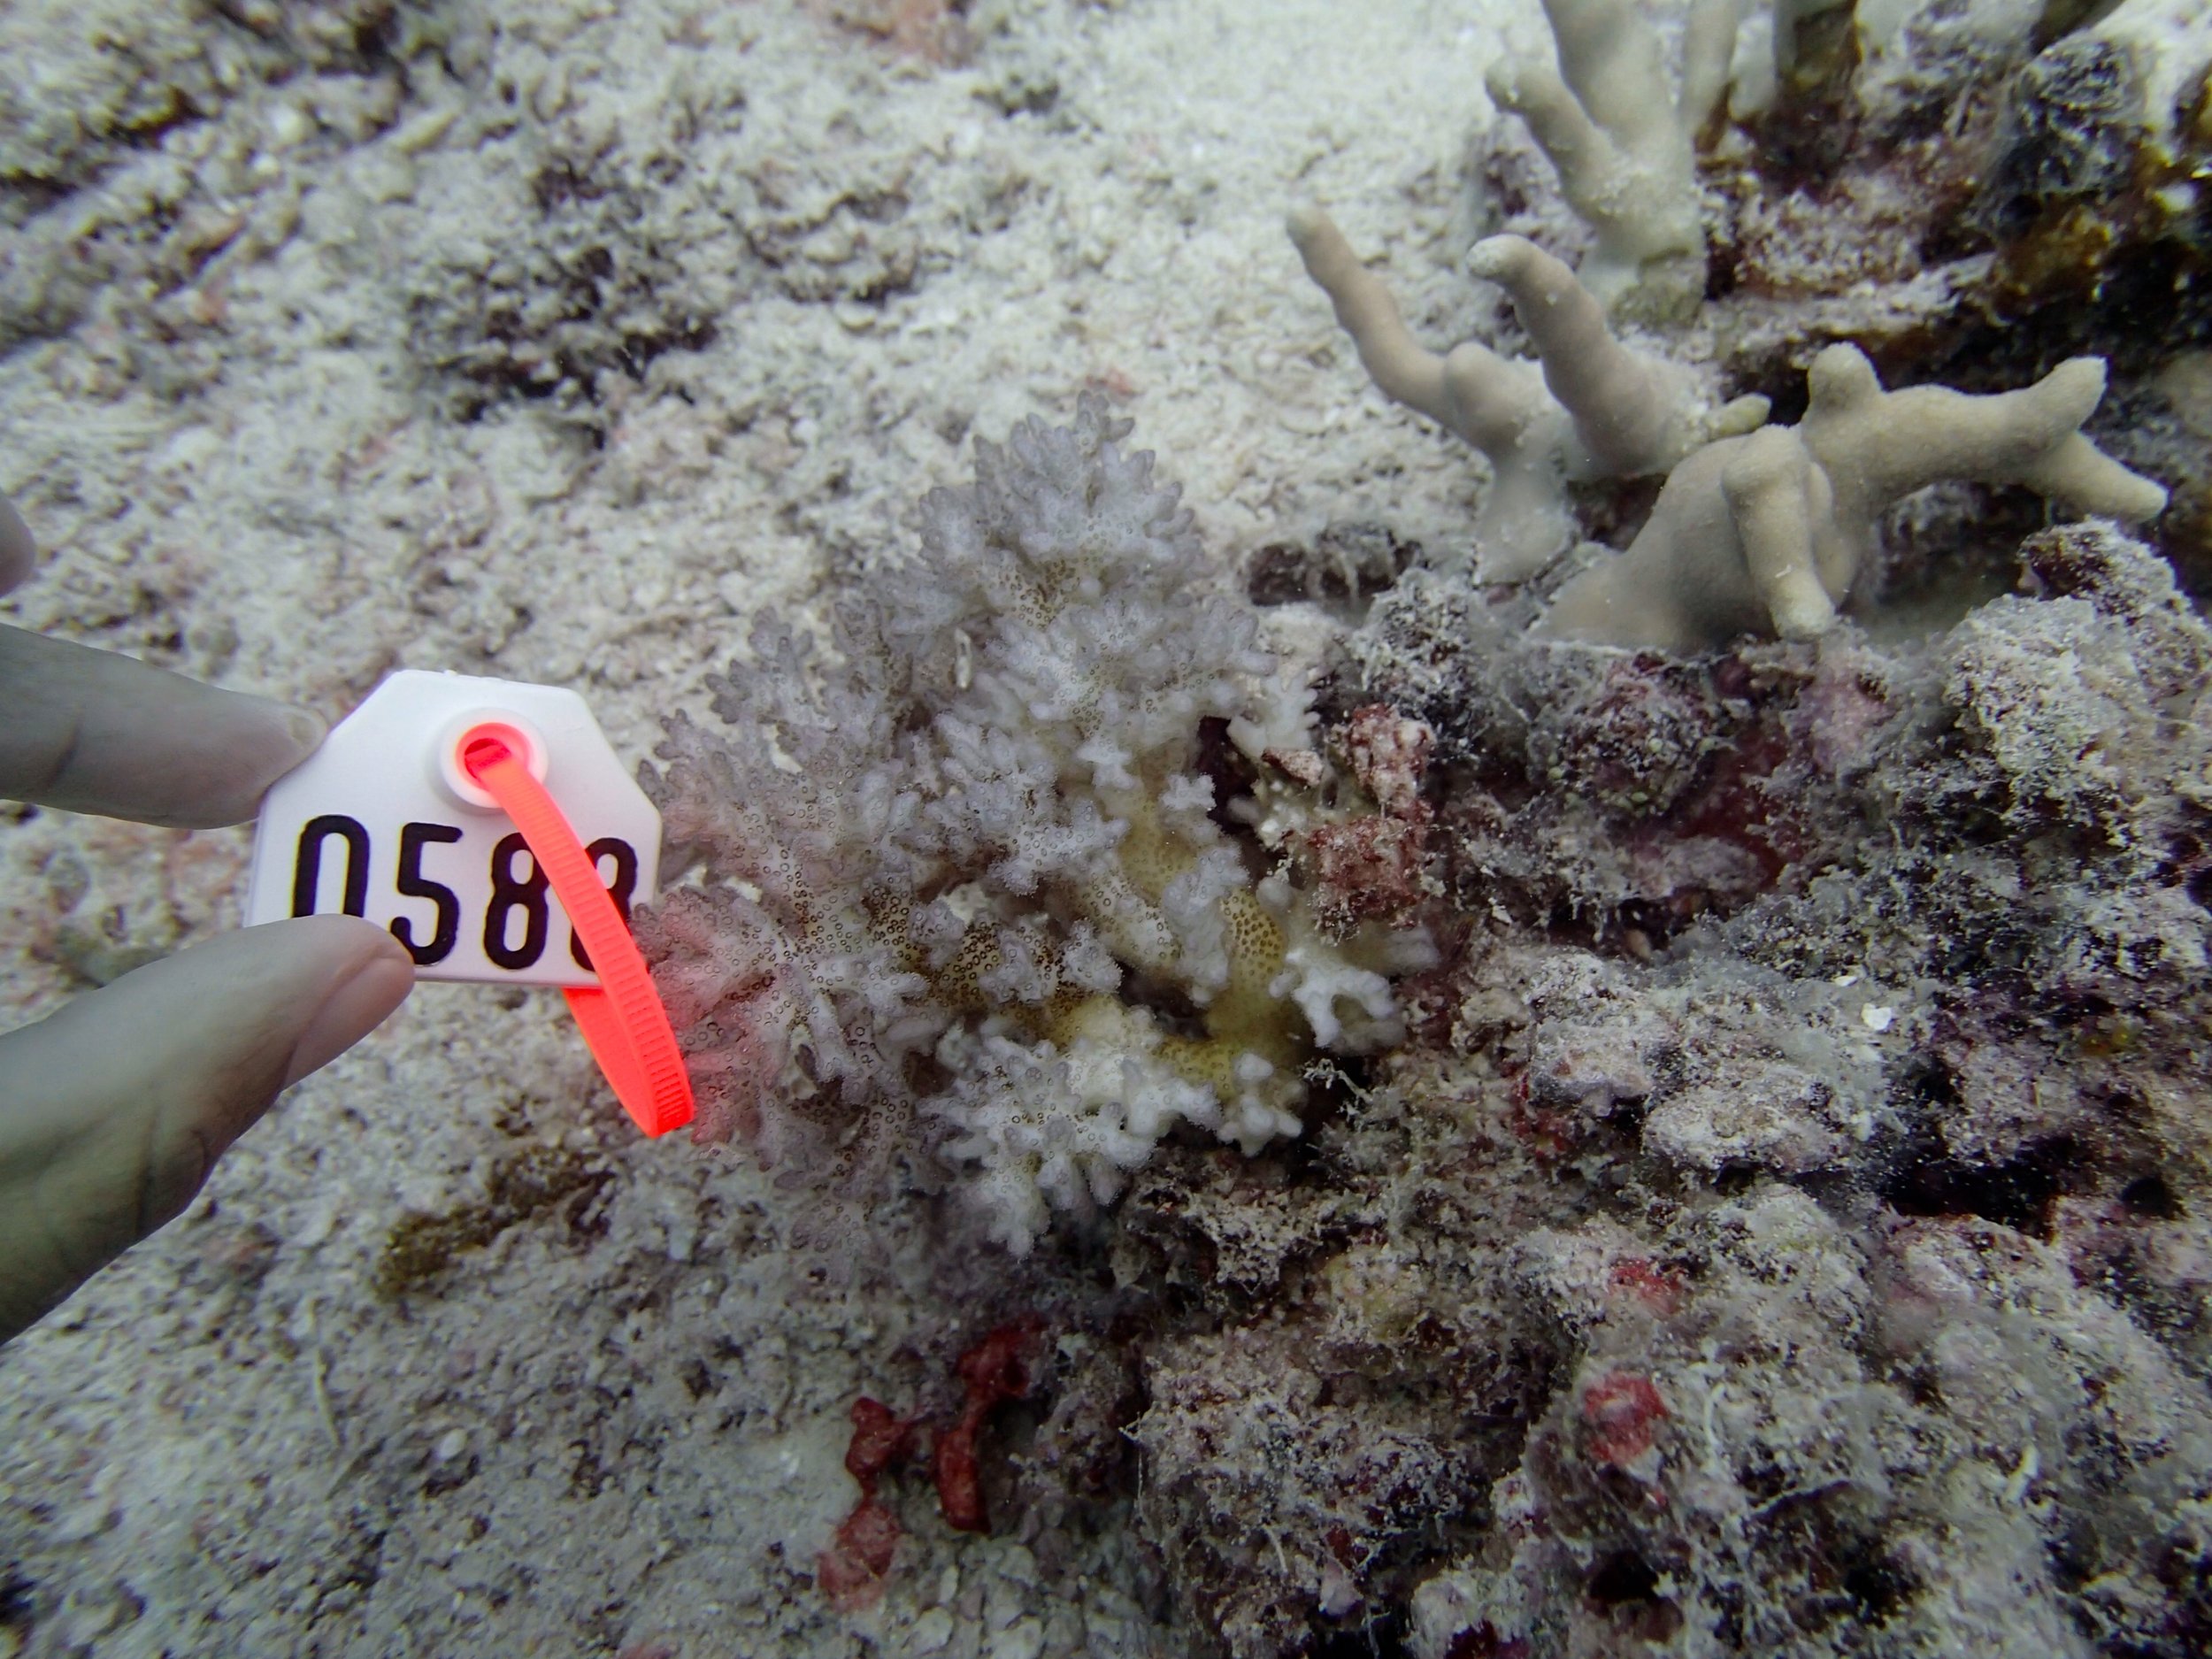
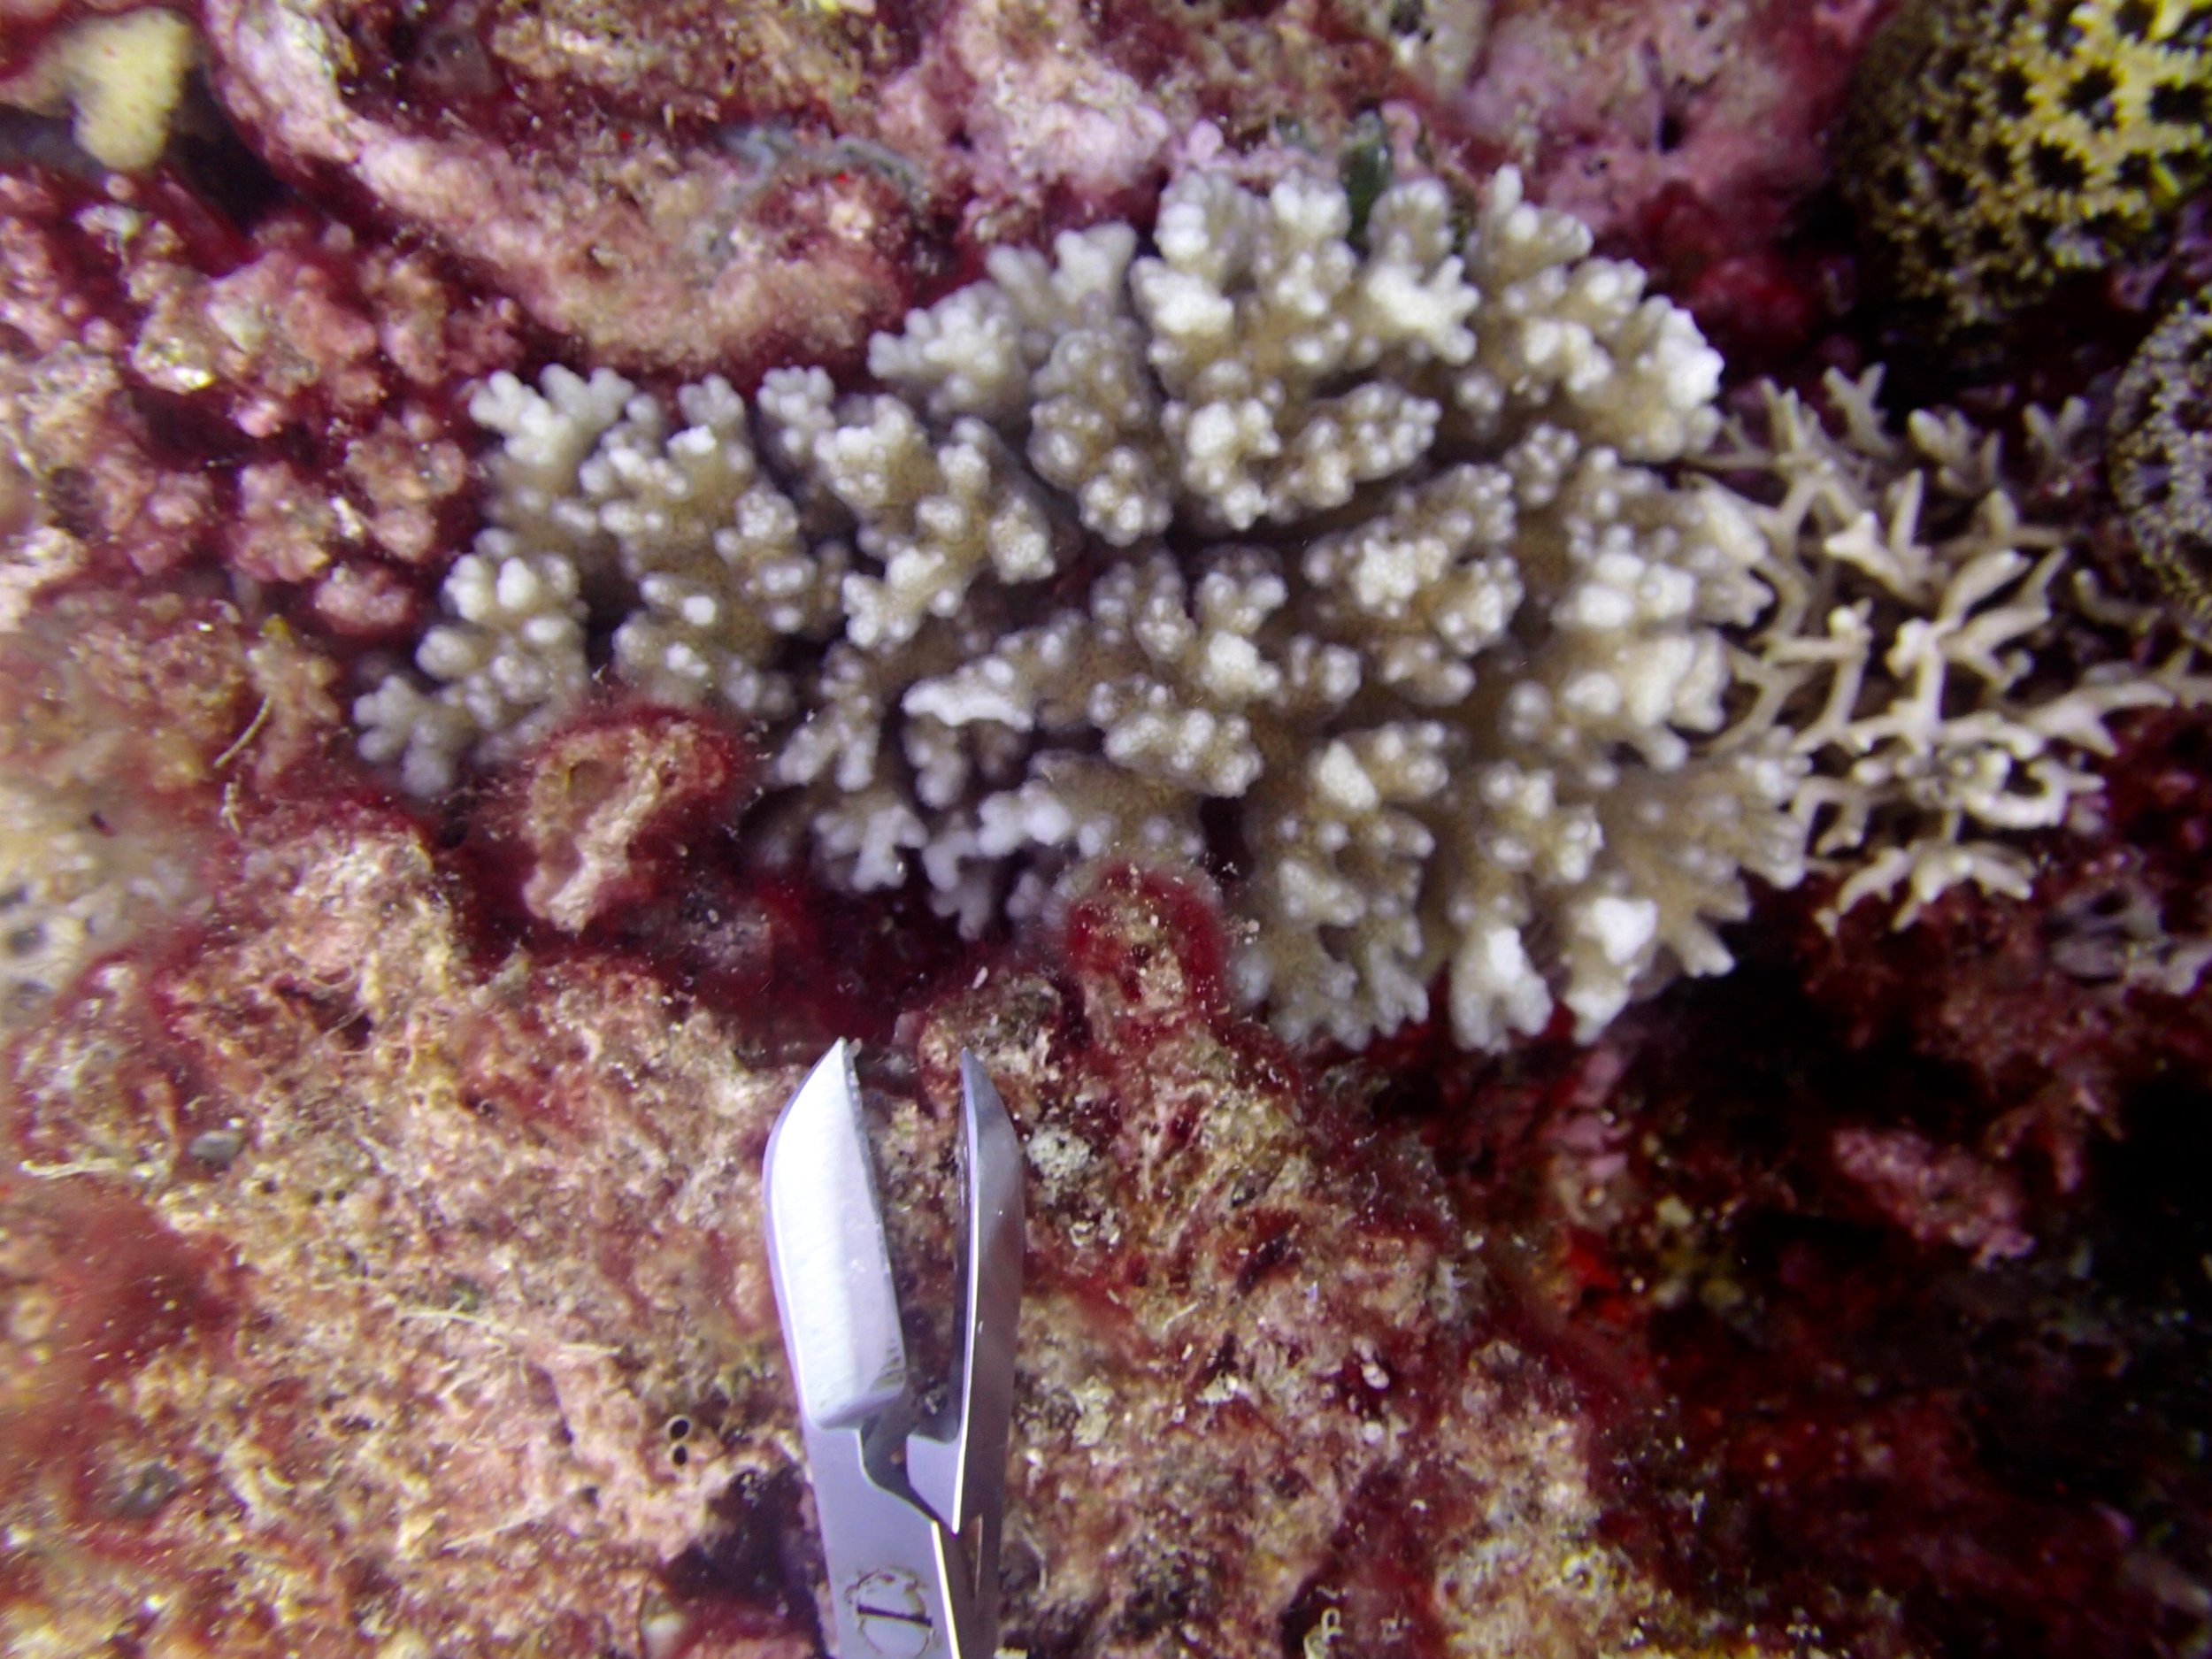
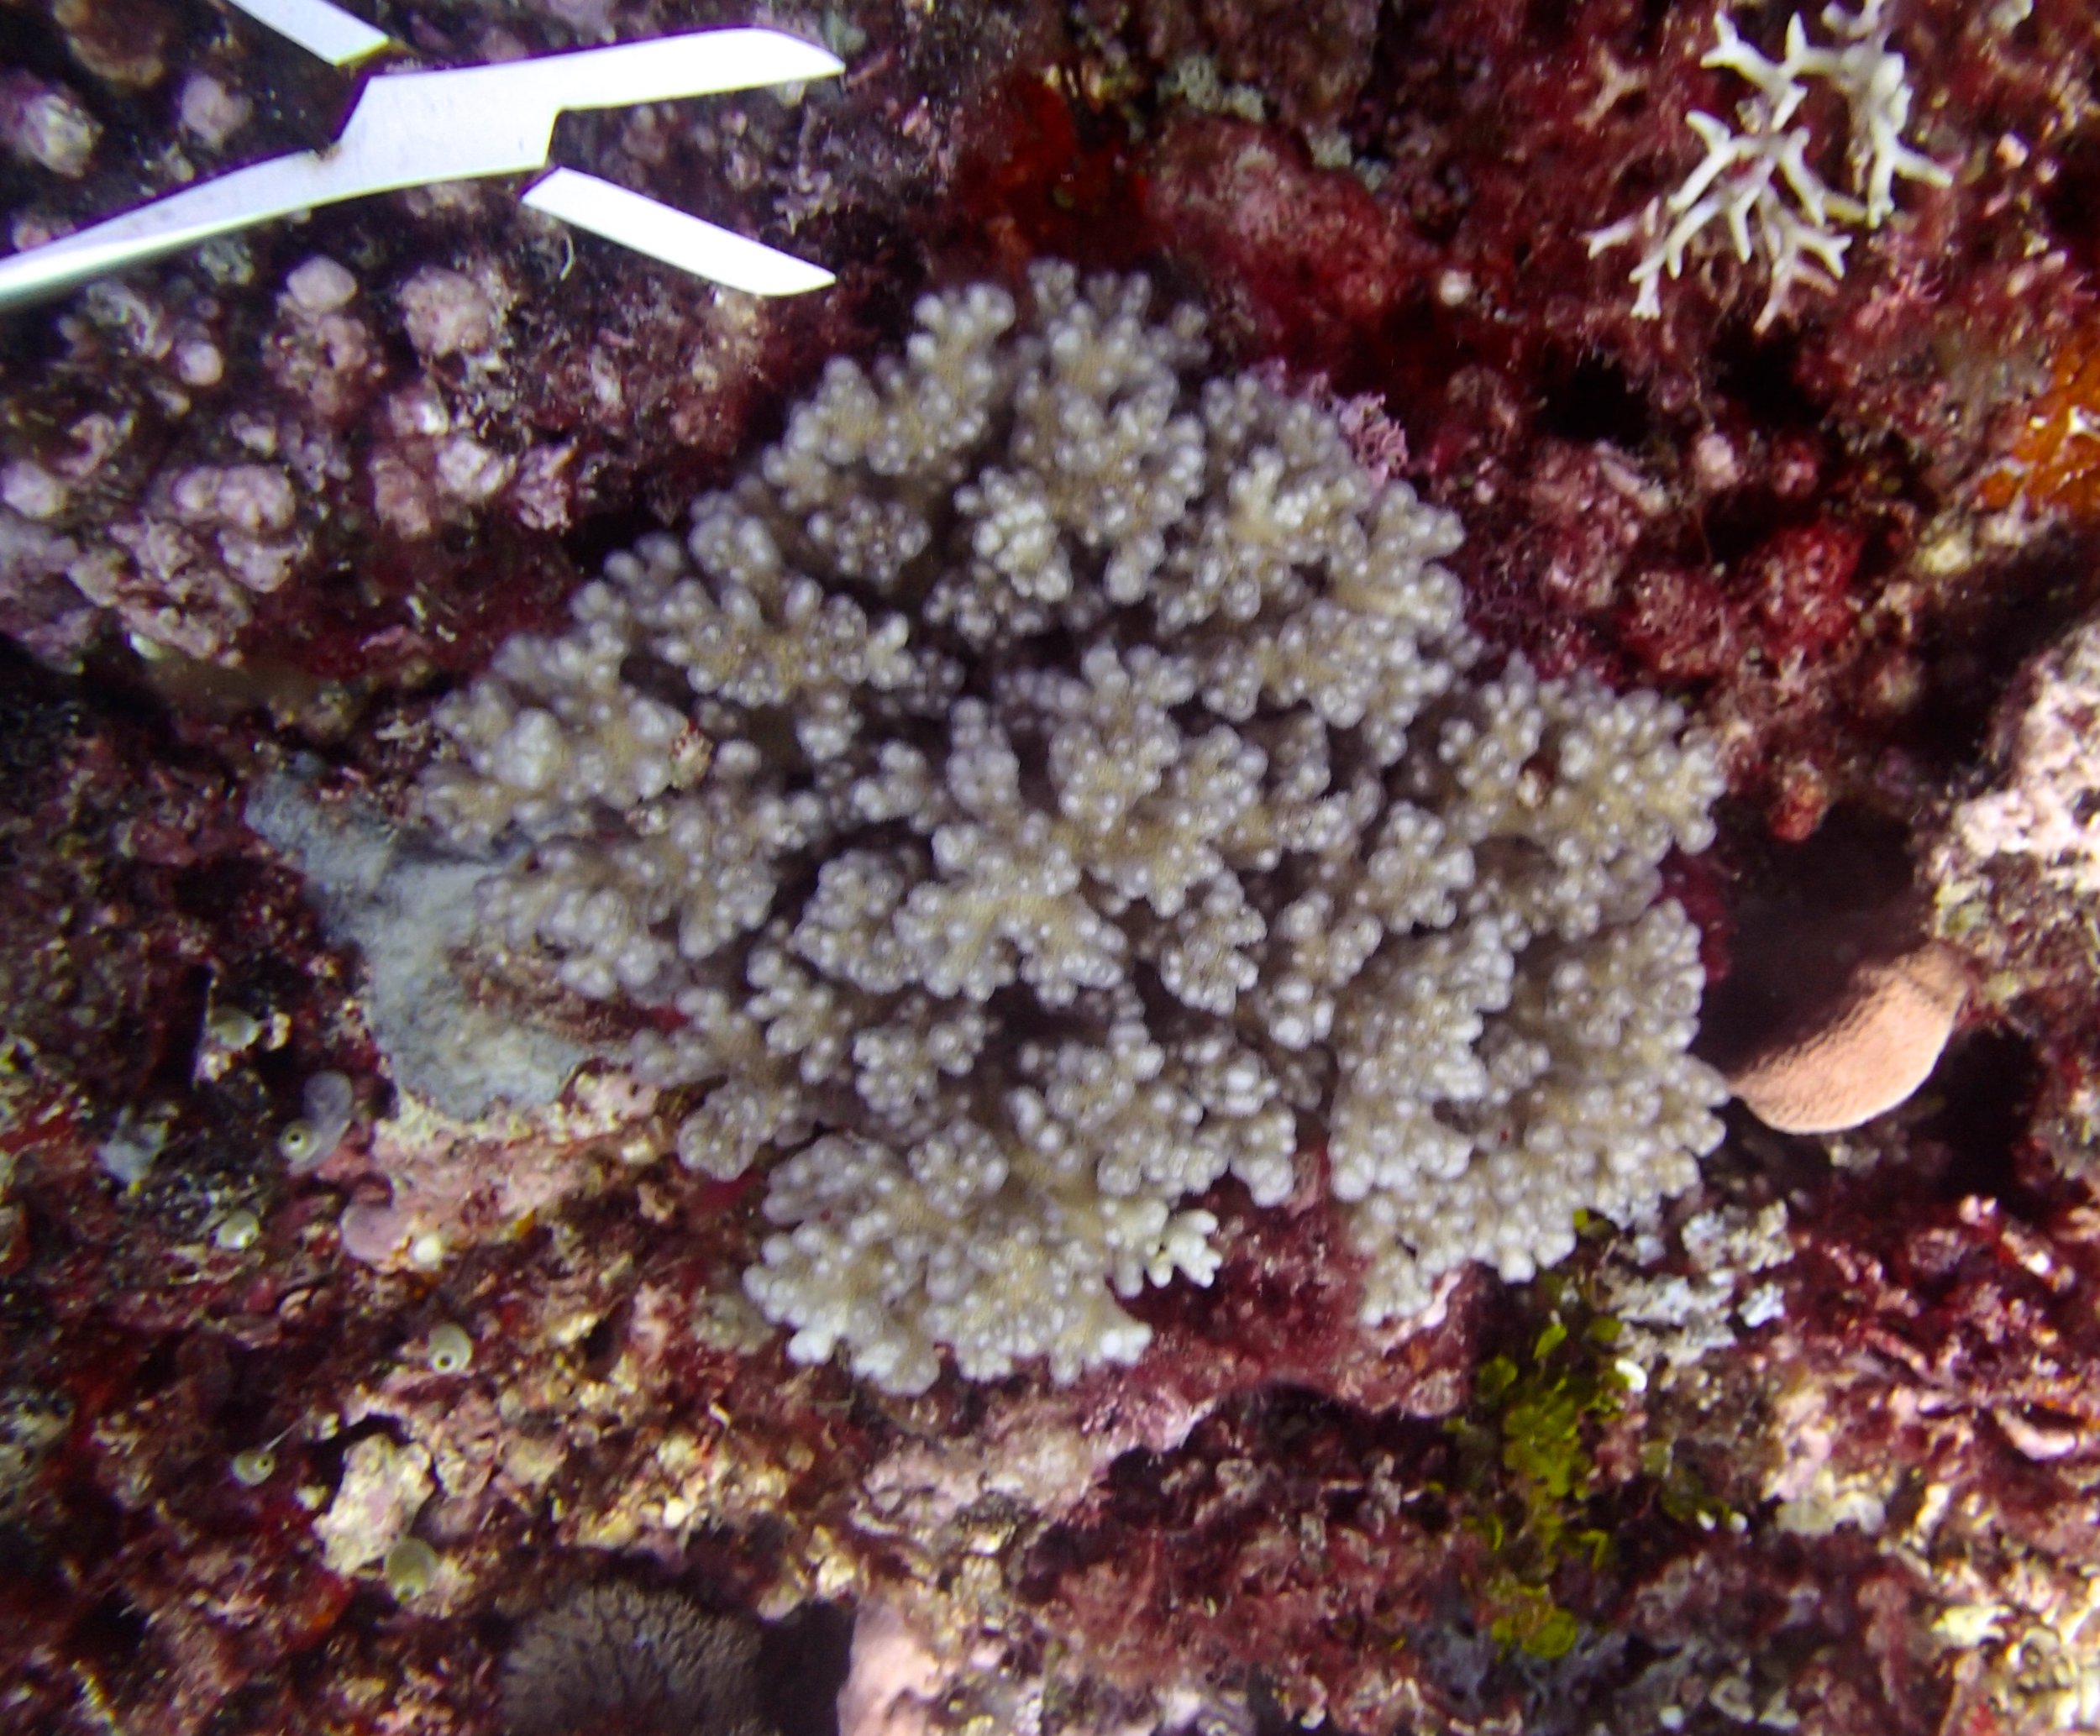
Images of all sampled colonies can be found under the dive site from which they were sampled (on the following pages). However, I have compiled all pictures used for assessing colony size here for convenience: please note that the length from the metal, grey, protruding spike (to the left of my finger) to the right-most side of the tag is 6.1 cm (this scaling object was used to scale the image and calculate maximum colony length and planar surface area.).